 🏷️ Likely Rental
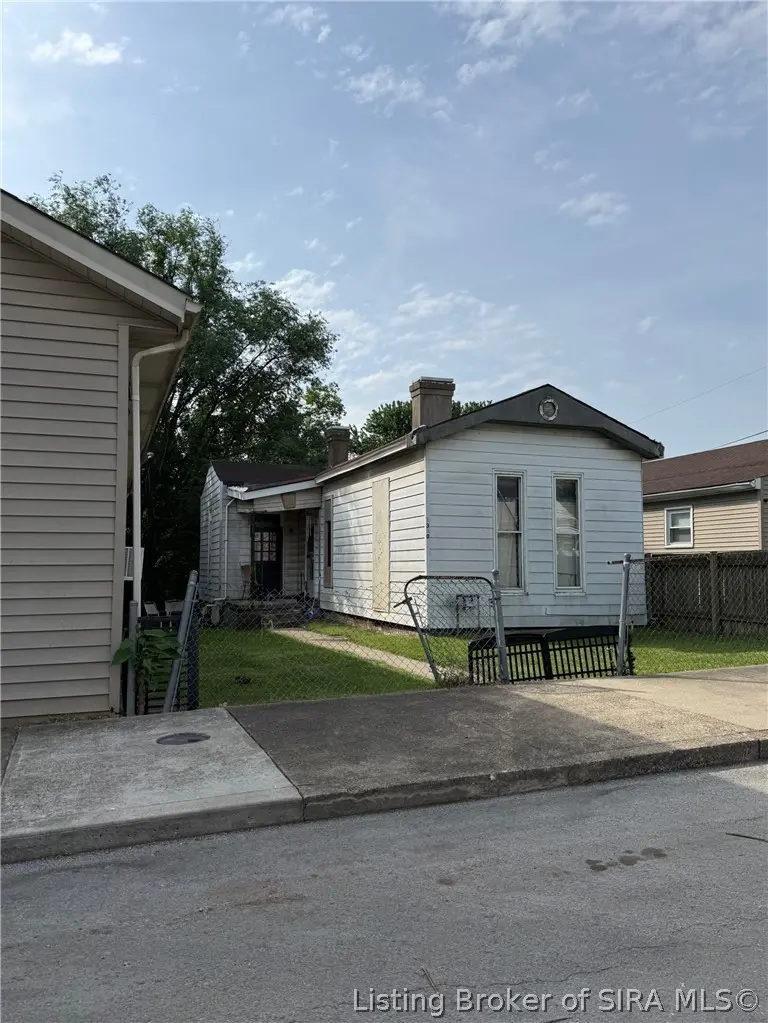
1340 Beeler St · New Albany, IN
Flood risk 7/10 · Major
- FEMA flood zone
- X (unshaded)
- Chance of flooding over 30 yrs
- 0.77%
- Est. flood insurance / yr
- $473 – $860
Fire risk 1/10 · Minimal
- Est. fire insurance / yr
- $717 – $1,331
Heat risk 5/10 · Moderate
- Hot days now (above 106°F)
- 7 days/yr
- Hot days in 30 yrs
- 20 days/yr
Wind risk 2/10 · Minimal
- Chance of severe wind over 30 yrs
- 2.0%
Air-quality risk 2/10 · Minimal
- Unhealthy air days now
- 1 days/yr
- Unhealthy air days in 30 yrs
- 2 days/yr
Risk factors via First Street. Map © Google.
Why this score? — see what drove the B grade
The composite is a weighted blend of 9 inputs, each scored 0–100. Each bar is that input's sub-score; the figure is the points it added to the 100-point composite (weight × sub-score).
- Cash flow +30.0/30.0
- DSCR +10.0/10.0
- 1% rule +9.1/10.0
- ARV discount +7.5/15.0
- Rent growth +4.3/5.0
- Schools +4.2/10.0
- Livability +3.7/5.0
- Condition / age +2.5/5.0
- Appreciation +0.0/10.0
$64,900
🖨 Deal sheet 📄 Offer letter ✓ Due diligence
Listing remarks
Great opportunity for investors! Nice size home with great cash flow opportunity at this price with a partial basement! Conveniently located off Vincennes St and close to Downtown New Albany! Current tenant pays $900 per month. All square footage and information are deemed to be accurate but buyers to verify. Tenants rights apply. Current tenants are month to month. Sold "As Is. "
Key facts
- Partial basement
- 4,443 sq ft lot
- Built 1929
Tags
Property features AI
Exterior
- Utilities: Public sewer; Public water connected
- Home design: Single-story home; Frame construction
- Construction: Frame construction; Below-grade unfinished area (basement) of 390; Above-grade finished area of 780
- Exterior features: Paved road access; Residential zoning
Interior
- Kitchen: Kitchen on the first floor
- Bedrooms: Bedroom on the first floor
- Bathrooms: 1 full bathroom
- Heating & cooling: Forced air heating
- Interior features: Unfinished basement
Neighborhood map
What this means for you Summary
Snapshot
- This is a 1-bed/1.0-bath single-family listed at $65k.
Deal economics
- At list price, monthly cash flow is $233 ($3k/yr) — positive.
- The deal already cash-flows at list — no discount required.
- Meets the 1% rule at list price ($916 rent vs $65k).
- Recommended offer: $63k (3.0% below list) — sets the bar for market timing.
- Cap rate 11.6% vs local median 3.8% in New Albany — top-decile yield for the area; either an underpriced asset or a hidden risk that comps aren't pricing in. Stress-test before assuming the spread holds.
Location & tenants
- Location reads 73/100 on livability (#100 in IN) — a middle-class / working-renter tenant base. Strengths: cost of living A+, housing A+, health & safety B; Watch: commute C-, employment D+, schools D.
- New Albany-Floyd County Consolidated Schools (suburban): math 46% / reading 50% proficiency, ranked #68 of 301 in IN (top 23%) — families likely to look elsewhere, expect single-tenant / working-renter base with shorter leases.
- Market conditions: Rents rising fast (+7.2%/yr); 269 active listings in the ZIP; 26 comparable units currently listed for rent nearby; rentals at typical pace (median 20d on market — plan ~3-4 weeks tenant-placement turnaround); 297 units permitted in Floyd County in 2024 (84 in 5+ unit buildings).
- This rent is only 18% of the median local income ($63k/yr) — well below the 30% rent-burden line; pricing power to push rent on renewal without tenant pushback.
Forward outlook
- Local home prices are declining (-3.0%/yr); year-one equity from $449 of loan paydown is wiped out by about $2k of value loss. Plan a longer hold.
- Floyd County population projected at +10% by 2050 — modest demand growth; plan on rents tracking national, not racing it.
- At projected returns (-3.0% appreciation + 7.2% rent growth), your $18k cash investment doubles in ~6 years — after that, you're playing with house money.
Negotiation context
- It's been on market 55 days — a 3% lower offer ($63k) is reasonable based on typical stale-listing flexibility.
Risks & watch-outs
- Watch-outs: flood insurance adds $56/mo; built in 1929 — expect roof / HVAC / electrical / plumbing capex.
- Climate carrying-cost: major flood risk; extreme-heat days projected 7→20/yr by 2055 (HVAC capex compounding) — expect insurance premiums to compound above CPI over the hold.
Questions for the listing agent
- It's been on market 55 days. Have you received any prior offers? Is the seller open to a 3% concession, seller financing, or rate buy-down credit?
- Built in 1929 — when were the roof, HVAC, electrical panel, plumbing, and water heater last replaced?
- What's the actual annual flood-insurance premium (NFIP or private), and is the property in a SFHA with mandatory coverage?
- Is there a deadline driving the sale (1031 exchange, divorce, estate, relocation)? That informs how much negotiation room exists.
- Schools are D-rated, which usually means shorter tenancies and higher turnover. Who's the typical renter profile here, and what's been the actual vacancy rate?
- What's the average days-on-market for RENTAL listings here right now (not sales)? A rising rental-DOM trend means longer vacancies and softer asking-rent achievability than the comps imply.
- What's the recent tenant-quality profile in this submarket — average credit score on applications, eviction rate, late-payment / NSF rate, and stable-employment percentage? A property-management company in the area should have these aggregated.
- How much new for-sale + rental construction is in the pipeline within 1–3 miles? Heavy new supply typically softens prices + rents 12–24 months out; constrained supply supports both.
Investment metrics
- 1% rule
- 1.41% ✓
- Cap rate
- 11.64%
- Cash-on-cash
- 19.08%
- DSCR
- 1.85
- GRM
- 5.9
CMA / ARV
- ARV (on-the-fly)
- $141,180
- Comps found
- 12
Show comp detail 12 sales within ~0.75 mi
| Address | Dist | Beds/Ba | Sqft | Sold | Price | $/sf | Match |
|---|---|---|---|---|---|---|---|
| 1016 Clark St | 0.11mi | 2/1.0 (+1) | 760 (-3%) | 8mo | $159,900 | $210 | 79 |
| 1102 Beeler St | 0.22mi | 2/1.0 (+1) | 752 (-4%) | 1mo | $158,000 | $210 | 78 |
| 1512 Locust St | 0.11mi | 2/1.0 (+1) | 832 (+7%) | 12mo | $124,900 | $150 | 69 |
| 1516 Charlestown Rd | 0.31mi | 2/1.0 (+1) | 832 (+7%) | 3mo | $186,900 | $225 | 67 |
| 1104 Ekin Ave | 0.25mi | 2/1.0 (+1) | 841 (+8%) | 6mo | $51,000 | $61 | 65 |
| 525 E 8th St | 0.46mi | 2/1.0 (+1) | 826 (+6%) | 1mo | $149,900 | $181 | 63 |
| 1521 Ekin Ave | 0.13mi | 2/1.0 (+1) | 896 (+15%) | 2mo | $162,000 | $181 | 62 |
| 1825 Center St | 0.61mi | 2/1.0 (+1) | 776 (-0%) | 4mo | $115,000 | $148 | 62 |
| 1748 E Spring St | 0.51mi | 1/1.0 | 720 (-8%) | 12mo | $100,000 | $139 | 54 |
| 1131 Burton Ave | 0.52mi | 2/2.0 (+1) | 854 (+10%) | 4mo | $156,210 | $183 | 47 |
| 2007 Culbertson Ave | 0.58mi | 2/1.0 (+1) | 872 (+12%) | 12mo | $92,000 | $106 | 38 |
| 97 Galt St | 0.74mi | 2/1.0 (+1) | 856 (+10%) | 8mo | $145,000 | $169 | 37 |
Match score weights: distance 35% · size 25% · config 20% · recency 20%. Top-matched comps best support the ARV.
Projected returns pro-forma
-3.0% appreciation · 7.24% rent growth · sell at horizon
- IRR
- 11.2%
- Equity multiple
- 1.47×
- Total profit
- $8,467
- Equity at exit
- $9,677
- IRR
- 23.6%
- Equity multiple
- 3.47×
- Total profit
- $44,936
- Equity at exit
- $5,611
Cash invested: $18,172 (down + closing). Projections, not guarantees.
Landlord ↔ Tenant lean methodology
- Overall (STATE)
- 90 Strongly Landlord-Friendly
- State Indiana
- 90 Strongly Landlord-Friendly · R+11
- County
- — inherits STATE
- City
- — inherits STATE
ZIP-level market 47150
- Rents YoY
- 7.2%
- Active inventory
- 269
- Price-to-rent
- 5.9×
Monthly cashflow live
- Estimated rent
- $916 high interval (Pro) →
- Mortgage (P&I)
- −$340
- Tax from tax record
- −$68 /mo · $811/yr
- Insurance
- −$27
- Flood insurance flood zone
- −$56 /mo · $666/yr
- HOA
- −$0
- Vacancy / Maint / Mgmt
- −$192
- Net cashflow
- $233
Break-even live
UW: 25.0% down · 7.5% · 30yr · 1.5% tax · 5.0% vac · 8.0% maint · 8.0% mgmt
Financing live
Cash to close
- Down payment
- $16,225
- Closing costs
- $1,947
- Reserves months
- —
- Total cash needed
- —
Loan-product check · same deal, 3 products live
Conventional
25% down · 7.5% · 30yr
- Down + closing
- —
- Monthly P&I
- —
- Monthly cashflow
- —
- DSCR
- —
- Eligible?
- —
Personal DTI + credit; lowest rate.
DSCR
20% down · 8.5% · 30yr
- Down + closing
- —
- Monthly P&I
- —
- Monthly cashflow
- —
- DSCR
- —
- Eligible?
- —
No personal income docs; deal must DSCR.
Hard money
10% down · 12.0% · 12mo
- Down + closing
- —
- Monthly P&I
- —
- Monthly cashflow
- —
- DSCR
- —
- Eligible?
- —
Short-term bridge; refi at stabilization.
Rent comps 26 comps
| Address | Beds | Baths | Sqft | Rent | $/sqft | DOM | Units | Dist |
|---|---|---|---|---|---|---|---|---|
| 1409 Chartres St Unit 2 New Albany, IN | 1.0 | 1.0 | 650 | $750 | $1.15 | 14d | 1 | 0.14mi |
| 1409 Chartres St Unit 2 New Albany, IN | 1.0 | 1.0 | 700 | $750 | $1.07 | 23d | 1 | 0.14mi |
| 812 Culbertson Ave New Albany, IN | 2.0 | 1.0 | 1000 | $1,095 | $1.09 | 21d | 1 | 0.34mi |
| 508 Vincennes St New Albany, IN | 1.0 | 1.0 | 750 | $850 | $1.13 | 23d | 1 | 0.35mi |
| 905 E Elm St New Albany, IN | 1.0–2.0 | 1.0 | 937 | $765 | $0.82 | 23d | 1 | 0.41mi |
| 1307 E Market St #1 New Albany, IN | 2.0 | 1.0 | 936 | $1,190 | $1.27 | 16d | 1 | 0.52mi |
| 1307 E Market St #2 New Albany, IN | 1.0 | 1.0 | 804 | $975 | $1.21 | 15d | 1 | 0.52mi |
| 1637 E Market St New Albany, IN | 1.0 | 1.0 | 643 | $1,066 | $1.66 | 3d | 1 | 0.57mi |
| 608 E Spring St Unit 2 New Albany, IN | 2.0 | 2.0 | 1100 | $1,195 | $1.09 | 3d | 1 | 0.62mi |
| 608 E Spring St Unit 2 New Albany, IN | 2.0 | 2.0 | 1100 | $1,195 | $1.09 | 23d | 1 | 0.62mi |
| 121 E 14th St Unit 2 New Albany, IN | 1.0 | 1.0 | 650 | $825 | $1.27 | 20d | 1 | 0.65mi |
| 2032 Culbertson Ave Unit 6 New Albany, IN | 1.0 | 1.0 | 550 | $695 | $1.26 | 3d | 1 | 0.66mi |
| 1201 Dewey St #3 New Albany, IN | 1.0 | 1.0 | 700 | $775 | $1.11 | 16d | 1 | 0.66mi |
| 2121 Culbertson Ave Unit D New Albany, IN | 1.0 | 1.0 | 650 | $750 | $1.15 | 23d | 1 | 0.71mi |
| 1316 Roosevelt Ave Unit 11 New Albany, IN | 2.0 | 1.5 | 700 | $950 | $1.36 | 23d | 1 | 0.71mi |
| 309 E Spring St Unit 310-106 New Albany, IN | 2.0 | 2.0 | 1005 | $1,250 | $1.24 | 16d | 1 | 0.72mi |
| 309 E Spring St Unit 310-203 New Albany, IN | 2.0 | 2.5 | 1005 | $1,250 | $1.24 | 3d | 1 | 0.72mi |
| 1940 Center St Unit 2 New Albany, IN | 1.0 | 1.0 | 650 | $725 | $1.12 | 21d | 1 | 0.73mi |
| 2239 Charlestown Rd Apt 104 New Albany, IN | 1.0 | 1.0 | 842 | $1,100 | $1.31 | 14d | 1 | 0.76mi |
| 1108 State St New Albany, IN | 2.0 | 1.0 | 982 | $1,150 | $1.17 | 21d | 1 | 0.80mi |
| 1808 Bono Rd New Albany, IN | 1.0–2.0 | 1.0–2.0 | 1000 | $795 | $0.80 | 3d | 1 | 0.98mi |
| 1226 Naghel St Unit 2 New Albany, IN | 1.0 | 1.0 | 600 | $725 | $1.21 | 23d | 1 | 1.14mi |
| 1226 Naghel St Unit 2 New Albany, IN | 1.0 | 1.0 | 650 | $725 | $1.12 | 21d | 1 | 1.14mi |
| 1107 Silverton Ct Unit 1 Clarksville, IN | 1.0 | 1.0 | 650 | $795 | $1.22 | 21d | 1 | 1.28mi |
| 1429 Slate Run Rd New Albany, IN | 1.0–2.0 | 1.0–2.0 | 1200 | $1,155 | $0.96 | 14d | 4 | 1.36mi |
| 2676 Grant Line Rd New Albany, IN | 1.0–2.0 | 1.0–2.0 | 828 | $948 | $1.14 | 1d | 12 | 1.36mi |
Listing history 17 events
-
2026-06-18days on market $64,900 Active 55 DOM
-
2026-06-17remarks 383-char remark
-
2026-06-17days on market $64,900 Active 54 DOM
-
2026-06-16days on market $64,900 Active 53 DOM
-
2026-06-15days on market $64,900 Active 52 DOM
-
2026-06-13days on market $64,900 Active 50 DOM
-
2026-06-10days on market $64,900 Active 47 DOM
-
2026-06-09days on market $64,900 Active 46 DOM
-
2026-06-08days on market $64,900 Active 45 DOM
-
2026-06-07days on market $64,900 Active 44 DOM
-
2026-06-03days on market $64,900 Active 40 DOM
-
2026-06-02days on market $64,900 Active 39 DOM
-
2026-06-01days on market $64,900 Active 38 DOM
-
2026-05-31days on market $64,900 Active 37 DOM
-
2026-04-24$69,900 Active
-
2025-01-29price $74,899
-
2024-10-02price $74,900
ⓘ Source: listings_history table (triggers on properties + properties_extension) + one-shot
backfill from property_details.listing_events for pre-trigger history.
Tax reassessment forecast IN · Partial reset (capped growth)
- Current annual tax
- $811 · $68/mo
- Projected year-2 tax
- $811 · $68/mo
- Expected delta
- $0/yr ($0/mo · 0.0%)
ⓘ Screening estimate from a state-policy table — verify with the county assessor before closing.
Climate risk First Street
- Flood 7/10 Severe FEMA zone X (unshaded) · 77% chance over 30 yrs
- Wildfire 1/10 Low
- Heat 5/10 Major 7 d/yr ≥106°F today · 20 d/yr by 30 yrs out
- Wind 2/10 Low 2% chance of damaging wind over 30 yrs
- Air quality 2/10 Low 1 unhealthy d/yr today · 2 by 30 yrs out
Nearby sold comps map
Loading sold comps map…
Walkable amenities ~0.75 mi
Loading nearby amenities…
Taxation est. · year 1
- Rental income
- $10,997
- − Mortgage interest
- −$3,635
- − Property taxes
- −$811
- − Insurance
- −$991
- − Repairs & maintenance
- −$880
- − Management
- −$880
- − Depreciation
- −$1,888
- Taxable income
- $1,912
- Est. tax owed @ 24.0%
- −$459
- After-tax cash flow
- $2,342/yr
For passive investors: Depreciation is non-cash, so a rental often shows a tax loss while cash-flowing — sheltering income. Rental losses are passive: they offset passive income freely, and up to $25,000/yr can offset ordinary (W-2) income if you actively participate and your MAGI is under $100k (phasing out to $0 by $150k); unused losses carry forward. On sale, claimed depreciation is recaptured at up to 25%, and gains may owe capital-gains tax (a 1031 exchange can defer both). Figures are a year-1 estimate at your 24.0% rate — not tax advice; consult a CPA.
Schools (NCES district)
- District
- New Albany-Floyd County Consolidated Schools
- NCES district ID
- 1807410
- Math proficiency
- 46% ▼ -4.00%
- Reading proficiency
- 50% ▼ -3.00%
- Median HH income
- $54,709
- Composite
- 41.57/100
- National rank
- #3441
- State rank
- #68 of 301 in IN
Livability — New Albany
- Score
- 73/100
- State rank
- #100
- US rank
- #5454
Category grades
Schools grade is shown separately in the Schools card above.
Census & demographics
- Census place
- New Albany, IN
- County
- Floyd County · 49,144 people
- City population
- 49,144
- Metro
- Louisville/Jefferson County, KY-IN
- Population (ZIP)
- 49,144
- Household income
- $62,820
- Rent vs Own
- Severe rent burden
- 1737.0
Population outlook (Floyd County) Hauer SSP2
- Today (2025)
- 82,092 people
- By 2030
- 84,384 · +2.8%
- By 2040
- 87,919 · +7.1%
- By 2050
- 89,958 · +9.6%
- By 2075
- 94,159 · +14.7%
- By 2100
- 91,907 · +12.0%
Race, ethnicity, and origin ACS 2023
- Neighborhood character
- Predominantly White (82%)
- Race & ethnicity
- White 82% Black 8% Two or more races 6% Hispanic / Latino 5% Asian 1%
- Common ancestry
- Italian 3% Slovak 2% Lithuanian 2%
- Foreign-born
- 3% · Canada
- Languages at home
- 96% English-only · Spanish 2% Other Asian/Pacific 1%
Political lean MEDSL · Floyd
- 2024 margin
- R (+15.5) · D 41.4% · R 56.9% · Other 1.7%
- 2008→2024 swing
- -5.4pp toward R · 2008: -10.1pp · 2024: -15.5pp
- All cycles
- 2024: R+15.5 2020: R+14.1 2016: R+20.1 2012: R+14.3 2008: R+10.1
Not yet ingested
- Civics
- —
Market trends
- HPI YoY
- ▼ -185.20%
- Current HPI
- 206.7738
- Rent YoY
- ▲ 7.24%
- Metro
- Louisville/Jefferson County, KY-IN
- State GDP YoY
- ▲ 2.90%
- F500 in state
- 18
Industry mix (Fortune 500 HQ in IN)
| Industry | F500 HQs | Revenue |
|---|---|---|
| Industrial Machinery | 2 | $37B |
|
||
| Healthcare | 1 | $177B |
|
||
| Pharmaceuticals | 1 | $45B |
|
||
| Metals / Steel | 1 | $18B |
|
||
| Agriculture | 1 | $17B |
|
||
| Packaging | 1 | $12B |
|
||
Price history
-6.7% since first listed3 events — show timeline
- 2026-04-24 Listed $69,900 SIRA
- 2025-01-29 Price Changed $74,899 SIRA
- 2024-10-02 Price Changed $74,900 SIRA
Property tax history
+2.4%/yrLatest (2024): $811 · -9.9% YoY. Source: county tax records.
Cash-flow waterfall
monthlySold comps — $/sqft
last 12 mo · ≤1 miLoading sold comps…