105 4th Ave · Caroga Lake, NY
Flood risk 1/10 · Minimal
- FEMA flood zone
- X
- Chance of flooding over 30 yrs
- 0.0%
- Est. flood insurance / yr
- $507 – $1,088
Fire risk 2/10 · Minimal
- Est. fire insurance / yr
- $691 – $1,283
Heat risk 1/10 · Minimal
- Hot days now (above 90°F)
- 7 days/yr
- Hot days in 30 yrs
- 16 days/yr
Wind risk 2/10 · Minimal
- Chance of severe wind over 30 yrs
- 3.0%
Air-quality risk 1/10 · Minimal
- Unhealthy air days now
- 0 days/yr
- Unhealthy air days in 30 yrs
- 0 days/yr
Risk factors via First Street. Map © Google.
Why this score? — see what drove the B- grade
The composite is a weighted blend of 9 inputs, each scored 0–100. Each bar is that input's sub-score; the figure is the points it added to the 100-point composite (weight × sub-score).
- Cash flow +20.3/30.0
- ARV discount +15.0/15.0
- Appreciation +10.0/10.0
- DSCR +6.4/10.0
- 1% rule +5.4/10.0
- Schools +3.1/10.0
- Livability +3.1/5.0
- Rent growth +2.5/5.0
- Condition / age +1.0/5.0
$150,000
🖨 Deal sheet 📄 Offer letter ✓ Due diligence
Listing remarks
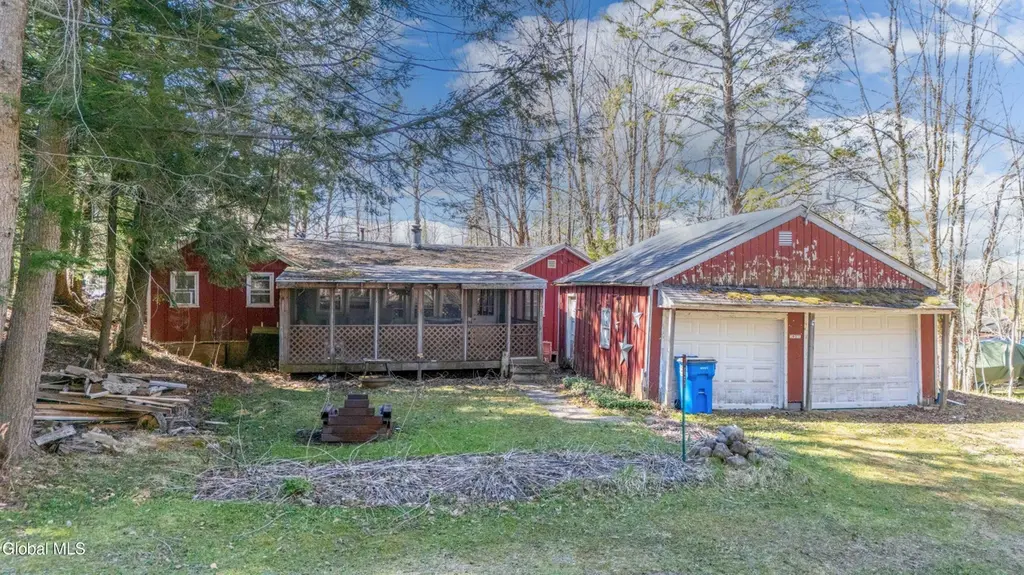
Calling all Fixer uppers and Investors! Spacious 4-bedroom, 1-bath home with deeded lake access to East Caroga Lake, located in the Avenues. This property offers incredible potential for anyone looking to create their ideal retreat or vacation rental. The generous layout provides ample space for family and guests, featuring a large 3-season sun porch perfect for relaxing and entertaining. A detached 2-car garage adds convenience and additional storage. Lake access is just a short walk or golf cart ride away--ideal for making the most of summer days on the water. With a little vision and updating, this home can truly shine. Being sold with most furnishings and offered As-Is. Inspections
Key facts
- 3-season sun porch
- Deeded lake access
- 0.24 acre lot
Tags
Property features AI
Finance
- Other: Lot size approximately 0.24 acres
- HOA & community: Has association with annual fee of $80; Association provides beach access; Association fee covers other items
Exterior
- Parking: 2 garage spaces; 2 total parking spaces
- Utilities: 100 amp electric service; Septic tank
- Home design: Single family residence; Fixer condition
- Construction: Wood siding
- Exterior features: Shingle roof
Interior
- Kitchen: Gas oven; Refrigerator
- Bedrooms: Four bedrooms on the first floor
- Bathrooms: One full bathroom on the first floor
- Heating & cooling: Propane heating; Wood heating; Has heating
- Interior features: Seven total rooms; Pillar/post/pier basement
Neighborhood map
What this means for you Summary
Snapshot
- This is a 4-bed/1.0-bath single-family listed at $150k. Condition is rated poor.
Deal economics
- At list price, monthly cash flow is $192 ($2k/yr) — positive.
- The deal already cash-flows at list — no discount required.
- Meets the 1% rule at list price ($2k rent vs $150k).
- Recommended offer: $148k (1.5% below list) — sets the bar for market timing.
- Cap rate 7.8% vs local median 1.4% in Caroga Lake — top-decile yield for the area; either an underpriced asset or a hidden risk that comps aren't pricing in. Stress-test before assuming the spread holds.
Location & tenants
- Location reads 62/100 on livability (#870 in NY) — a middle-class / working-renter tenant base. Strengths: cost of living A+; Watch: housing C-, health & safety C-, schools D+.
- Wheelerville Union Free School District (rural): math 35% / reading 30% proficiency, ranked #707 of 755 in NY (top 94%) — families likely to look elsewhere, expect single-tenant / working-renter base with shorter leases.
- Market conditions: 165 active listings in the ZIP; 112 units permitted in Fulton County in 2024 (50 in 5+ unit buildings).
Forward outlook
- In year one you build about $16k of equity ($1k loan paydown + $15k appreciation (10.0% local appreciation)).
- Fulton County population projected at -23% by 2050 — secular population decline; favor cash flow + early exit over multi-decade hold.
- At projected returns (10.0% appreciation + 3.0% rent growth), your $42k cash investment doubles in ~3 years — after that, you're playing with house money.
- By year 3, paydown + projected appreciation supports a ~$41k cash-out refi (75% LTV) — recoverable capital for the next deal without selling this one.
Negotiation context
- It's been on market 26 days — a 2% lower offer ($148k) is reasonable based on typical stale-listing flexibility.
- 2 sale attempts with the ask held roughly flat each time — persistent listings suggest the price (not the market) is what's stuck; bring a comps-based counter.
Risks & watch-outs
- Watch-outs: built in 1956 — expect roof / HVAC / electrical / plumbing capex.
Questions for the listing agent
- Have any recent inspections been done? Can we get a copy of the seller's disclosures and any deferred-maintenance estimates?
- Built in 1956 — when were the roof, HVAC, electrical panel, plumbing, and water heater last replaced?
- What does the HOA fee cover, when was the last increase, and are there any pending special assessments or reserve-fund shortfalls?
- Is there a deadline driving the sale (1031 exchange, divorce, estate, relocation)? That informs how much negotiation room exists.
- Schools are D-rated, which usually means shorter tenancies and higher turnover. Who's the typical renter profile here, and what's been the actual vacancy rate?
- Crime grade is F in this area — have there been break-ins, vandalism, or insurance claims at this property in the last 3 years? What carrier currently insures it and at what premium?
- What's the average days-on-market for RENTAL listings here right now (not sales)? A rising rental-DOM trend means longer vacancies and softer asking-rent achievability than the comps imply.
- What's the recent tenant-quality profile in this submarket — average credit score on applications, eviction rate, late-payment / NSF rate, and stable-employment percentage? A property-management company in the area should have these aggregated.
- How much new for-sale + rental construction is in the pipeline within 1–3 miles? Heavy new supply typically softens prices + rents 12–24 months out; constrained supply supports both.
Investment metrics
- 1% rule
- 1.04% ✓
- Cap rate
- 7.83%
- Cash-on-cash
- 5.49%
- DSCR
- 1.24
- GRM
- 8.0
CMA / ARV
- ARV (on-the-fly)
- $207,264
- Comps found
- 1
Show comp detail 1 sale within ~0.75 mi
| Address | Dist | Beds/Ba | Sqft | Sold | Price | $/sf | Match |
|---|---|---|---|---|---|---|---|
| 116 1st Ave | 0.11mi | 4/1.0 | 1,400 (-14%) | 9mo | $178,000 | $127 | 64 |
Match score weights: distance 35% · size 25% · config 20% · recency 20%. Top-matched comps best support the ARV.
Projected returns pro-forma
10.0% appreciation · 3.0% rent growth · sell at horizon
- IRR
- 28.3%
- Equity multiple
- 3.24×
- Total profit
- $93,968
- Equity at exit
- $135,132
- IRR
- 24.6%
- Equity multiple
- 7.36×
- Total profit
- $267,144
- Equity at exit
- $291,417
Cash invested: $42,000 (down + closing). Projections, not guarantees.
Landlord ↔ Tenant lean methodology
- Overall (STATE)
- 15 Strongly Tenant-Friendly
- State New York
- 15 Strongly Tenant-Friendly · D+10
- County
- — inherits STATE
- City
- — inherits STATE
ZIP-level market 12078
- Home prices YoY
- 12.2%
- Active inventory
- 165
- Price-to-rent
- 8.0×
Monthly cashflow live
- Estimated rent
- $1,564 medium interval (Pro) →
- Mortgage (P&I)
- −$787
- Tax est. 1.5%
- −$188 /mo · $2,250/yr
- Insurance
- −$62
- HOA
- −$7
- Vacancy / Maint / Mgmt
- −$329
- Net cashflow
- $192
Break-even live
UW: 25.0% down · 7.5% · 30yr · 1.5% tax · 5.0% vac · 8.0% maint · 8.0% mgmt
Financing live
Cash to close
- Down payment
- $37,500
- Closing costs
- $4,500
- Reserves months
- —
- Total cash needed
- —
Loan-product check · same deal, 3 products live
Conventional
25% down · 7.5% · 30yr
- Down + closing
- —
- Monthly P&I
- —
- Monthly cashflow
- —
- DSCR
- —
- Eligible?
- —
Personal DTI + credit; lowest rate.
DSCR
20% down · 8.5% · 30yr
- Down + closing
- —
- Monthly P&I
- —
- Monthly cashflow
- —
- DSCR
- —
- Eligible?
- —
No personal income docs; deal must DSCR.
Hard money
10% down · 12.0% · 12mo
- Down + closing
- —
- Monthly P&I
- —
- Monthly cashflow
- —
- DSCR
- —
- Eligible?
- —
Short-term bridge; refi at stabilization.
HOA detail
- Monthly dues
- $7 · $84/yr
- Likely covers
- water
Listing history 5 events
-
2026-05-21status Pending
-
2026-04-25$150,000 Active
-
2025-11-04historical
-
2025-09-05price $160,000
-
2025-08-15$175,000 Active
ⓘ Source: listings_history table (triggers on properties + properties_extension) + one-shot
backfill from property_details.listing_events for pre-trigger history.
Climate risk First Street
- Flood 1/10 Low FEMA zone X · 0% chance over 30 yrs
- Wildfire 2/10 Low
- Heat 1/10 Low 7 d/yr ≥90°F today · 16 d/yr by 30 yrs out
- Wind 2/10 Low 3% chance of damaging wind over 30 yrs
- Air quality 1/10 Low 0 unhealthy d/yr today · 0 by 30 yrs out
Nearby sold comps map
Loading sold comps map…
Walkable amenities ~0.75 mi
Loading nearby amenities…
Taxation est. · year 1
- Rental income
- $18,773
- − Mortgage interest
- −$8,402
- − Property taxes
- −$2,250
- − Insurance
- −$750
- − Repairs & maintenance
- −$1,502
- − Management
- −$1,502
- − HOA
- −$84
- − Depreciation
- −$4,364
- Taxable loss
- −$81
- Est. tax savings @ 24.0%
- +$19
- After-tax cash flow
- $2,327/yr
For passive investors: Depreciation is non-cash, so a rental often shows a tax loss while cash-flowing — sheltering income. Rental losses are passive: they offset passive income freely, and up to $25,000/yr can offset ordinary (W-2) income if you actively participate and your MAGI is under $100k (phasing out to $0 by $150k); unused losses carry forward. On sale, claimed depreciation is recaptured at up to 25%, and gains may owe capital-gains tax (a 1031 exchange can defer both). Figures are a year-1 estimate at your 24.0% rate — not tax advice; consult a CPA.
Condition & rehab AI · 12 photos
This property requires extensive renovations to bring it up to modern standards and increase its value. Immediate repairs are needed to the roof and exterior, while interior updates will significantly enhance its appeal.
Repairs flagged
- Major roof — visible damage and wear
- Major exterior siding — peeling paint
- Major kitchen cabinets — dated and worn
- Major bathroom fixtures — dated and worn
- Major HVAC system — visible rust and wear
Value-add opportunities
- Both exterior paint job — enhances curb appeal and value
- Both HVAC system replacement — improves comfort and energy efficiency
- Both kitchen and bathroom updates — modernizes spaces and increases value
Renovation cost estimate screening
| Repair item | Severity | Est. cost |
|---|---|---|
| roof · visible damage and wear | Major | $15,000–50,000 |
| exterior siding · peeling paint | Major | $15,000–50,000 |
| kitchen cabinets · dated and worn | Major | $15,000–50,000 |
| bathroom fixtures · dated and worn | Major | $15,000–50,000 |
| HVAC system · visible rust and wear | Major | $15,000–50,000 |
| Total estimated repair cost · 5 items | $75,000–250,000 |
Value-add ROI direction
- Both exterior paint job — enhances curb appeal and value ↑
- Both HVAC system replacement — improves comfort and energy efficiency ↑
- Both kitchen and bathroom updates — modernizes spaces and increases value ↑
ⓘ Cost ranges are severity-bucket heuristics (US national rule-of-thumb). Get contractor quotes + a written scope before underwriting a rehab budget.
Schools (NCES district)
- District
- Wheelerville Union Free School District
- NCES district ID
- 3631200
- Math proficiency
- 35% ▲ 5.00%
- Reading proficiency
- 30% ▼ -5.00%
- Median HH income
- $47,872
- Composite
- 30.81/100
- National rank
- #11381
- State rank
- #707 of 755 in NY
Livability — Caroga Lake
- Score
- 62/100
- State rank
- #870
- US rank
- #16797
Category grades
Schools grade is shown separately in the Schools card above.
Census & demographics
- Census place
- Caroga Lake, NY
- Population (ZIP)
- 23,087
Population outlook (Fulton County) Hauer SSP2
- Today (2025)
- 51,132 people
- By 2030
- 49,114 · -3.9%
- By 2040
- 44,373 · -13.2%
- By 2050
- 39,321 · -23.1%
- By 2075
- 28,503 · -44.3%
- By 2100
- 19,268 · -62.3%
Race, ethnicity, and origin ACS 2023
- Neighborhood character
- Predominantly White (86%)
- Race & ethnicity
- White 86% Two or more races 8% Hispanic / Latino 5% Black 2% Asian 1%
- Hispanic origin (detail)
- Puerto Rican 3%
- Common ancestry
- Lithuanian 5% Romanian 4% Iranian 4%
- Foreign-born
- 2% · Canada, China
- Languages at home
- 97% English-only · Spanish 2%
Political lean MEDSL · Fulton
- 2024 margin
- Solid R (+35.9) · D 32.1% · R 67.9%
- 2008→2024 swing
- -26.6pp toward R · 2008: -9.2pp · 2024: -35.9pp
- All cycles
- 2024: R+35.9 2020: R+31.4 2016: R+35.5 2012: R+10.5 2008: R+9.2
Not yet ingested
- Civics
- —
Market trends
- HPI YoY
- ▲ 34.22%
- Current HPI
- 315.1368
- Rent YoY
- —
- Metro
- —
- State GDP YoY
- ▲ 2.60%
- F500 in state
- 92
Industry mix (Fortune 500 HQ in NY)
| Industry | F500 HQs | Revenue |
|---|---|---|
| Financial Services | 10 | $950B |
|
||
| Consumer Goods | 9 | $162B |
|
||
| Insurance | 4 | $225B |
|
||
| Telecommunications | 2 | $144B |
|
||
| Pharmaceuticals | 2 | $112B |
|
||
| Media / Entertainment | 2 | $69B |
|
||
Price history
-14.3% since first listed5 events — show timeline
- 2026-05-21 Pending — Global MLS
- 2026-04-25 Listed $150,000 Global MLS
- 2025-11-04 Listing Removed — Global MLS
- 2025-09-05 Price Changed $160,000 Global MLS
- 2025-08-15 Listed $175,000 Global MLS
Cash-flow waterfall
monthlySold comps — $/sqft
last 12 mo · ≤1 miLoading sold comps…