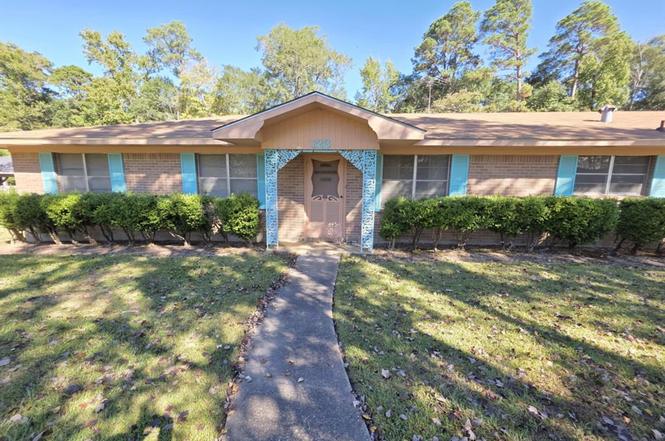
123 Frank Dr. Dr · Logansport, LA
Flood risk 1/10 · Minimal
- FEMA flood zone
- X (unshaded)
- Chance of flooding over 30 yrs
- 0.0%
- Est. flood insurance / yr
- $507 – $1,088
Fire risk 3/10 · Minor
- Est. fire insurance / yr
- $1,269 – $2,357
Heat risk 7/10 · Major
- Hot days now (above 111°F)
- 7 days/yr
- Hot days in 30 yrs
- 22 days/yr
Wind risk 8/10 · Major
- Chance of severe wind over 30 yrs
- 80.0%
Air-quality risk 1/10 · Minimal
- Unhealthy air days now
- 0 days/yr
- Unhealthy air days in 30 yrs
- 0 days/yr
Risk factors via First Street. Map © Google.
Why this score? — see what drove the B- grade
The composite is a weighted blend of 9 inputs, each scored 0–100. Each bar is that input's sub-score; the figure is the points it added to the 100-point composite (weight × sub-score).
- Cash flow +24.4/30.0
- ARV discount +15.0/15.0
- DSCR +7.9/10.0
- 1% rule +5.9/10.0
- Appreciation +5.0/10.0
- Schools +3.5/10.0
- Livability +3.2/5.0
- Rent growth +2.5/5.0
- Condition / age +2.5/5.0
$99,999
🖨 Deal sheet 📄 Offer letter ✓ Due diligence
Listing remarks
Well kept brick house located on nice large lot! This property hosts lots of storage spaces, inside and out with 2 storage buildings that stay with the property. With 2 bedrooms, 2 full baths, a den, living room and dining room, you can come in and make this place fit your needs! Good square footage to expand if you need! Appliances included, double over, cooktop stove, refrigerator, washer and dryer. Nice screened in porch for those mornings or evenings you just need to sit and relax, find a comfy spot for yourself and enjoy! This great property is nestled in a neat subdivision in Logansport, Louisiana! Side note: RV and RV cover to be removed from property. Minerals Reserved.
Key facts
- Screened in porch
- Brick house
- Large lot
Tags
Property features AI
Finance
- Other: RV cover excluded (reserved by seller)
- Financial info: Listing terms accept Cash, Conventional, FHA, USDA Loan, and VA Loan
- HOA & community: No homeowners association
Exterior
- Parking: One covered parking space; One carport space; Driveway
- Utilities: City water; City sewer; Co-op electric; Asphalt access; Not in a municipal utility district
- Home design: Single family residence; One story; Residential property in Pugh Acres subdivision; Property faces: (not specified)
- Construction: Brick construction; Composition roof; Slab foundation; Built in 1972
- Exterior features: Storage; Chain link and partial fencing; Cleared lot with large backyard grass area; Directions: From Hwy. 84 turn onto Frank Drive; house located at the rear of the subdivision
Interior
- Kitchen: Electric cooktop; Double oven; Refrigerator
- Bedrooms: Primary bedroom on main level with ensuite bathroom (approx. 15 x 14); Second bedroom on main level (approx. 12 x 12)
- Flooring: Carpet; Vinyl
- Bathrooms: Two full bathrooms; Primary bathroom on main level (approx. 10 x 8); Additional bathroom on main level (approx. 14 x 8)
- Heating & cooling: Central heating; Central air conditioning
- Interior features: Paneling; Seven total rooms; Two living areas; One dining area; Fireplace (decorative) in living room
- Laundry & utility: Washer; Dryer
Neighborhood map
What this means for you Summary
Snapshot
- This is a 2-bed/2.0-bath single-family listed at $100k.
Deal economics
- At list price, monthly cash flow is $204 ($2k/yr) — positive.
- The deal already cash-flows at list — no discount required.
- Meets the 1% rule at list price ($1k rent vs $100k).
- Recommended offer: $88k (12.0% below list) — sets the bar for market timing.
Location & tenants
- Location reads 64/100 on livability (#162 in LA) — a middle-class / working-renter tenant base. Strengths: cost of living A+, housing A+, crime B; Watch: amenities F, commute F, employment D-.
- Desoto Parish (rural): math 35% / reading 48% proficiency, ranked #21 of 98 in LA (top 21%) — families likely to look elsewhere, expect single-tenant / working-renter base with shorter leases.
- Market conditions: 7 active listings in the ZIP; 113 units permitted in De Soto Parish in 2024 (0 in 5+ unit buildings).
Forward outlook
- In year one you build about $4k of equity ($691 loan paydown + $3k appreciation (3.0% local appreciation)).
- De Soto County population projected at +8% by 2050 — modest demand growth; plan on rents tracking national, not racing it.
- At projected returns (3.0% appreciation + 3.0% rent growth), your $28k cash investment doubles in ~5 years — after that, you're playing with house money.
- By year 9, paydown + projected appreciation supports a ~$31k cash-out refi (75% LTV) — recoverable capital for the next deal without selling this one.
Negotiation context
- It's been on market 198 days — a 12% lower offer ($88k) is reasonable based on typical stale-listing flexibility.
- 4 sale attempts; this cycle's ask has dropped $29k (22%) from the opening price — seller is motivated, your offer sets the floor, not the list.
Risks & watch-outs
- Climate carrying-cost: severe wind risk, 80% chance of damaging wind over 30y; extreme-heat days projected 7→22/yr by 2055 (HVAC capex compounding) — expect insurance premiums to compound above CPI over the hold.
Questions for the listing agent
- It's been on market 198 days. Have you received any prior offers? Is the seller open to a 12% concession, seller financing, or rate buy-down credit?
- Built in 1972 — when were the roof, HVAC, electrical panel, plumbing, and water heater last replaced?
- Why hasn't it sold? Are there any deal-killer items the seller is aware of (foundation, flood, title, zoning, code violations)?
- Is there a deadline driving the sale (1031 exchange, divorce, estate, relocation)? That informs how much negotiation room exists.
- What's the average days-on-market for RENTAL listings here right now (not sales)? A rising rental-DOM trend means longer vacancies and softer asking-rent achievability than the comps imply.
- What's the recent tenant-quality profile in this submarket — average credit score on applications, eviction rate, late-payment / NSF rate, and stable-employment percentage? A property-management company in the area should have these aggregated.
- How much new for-sale + rental construction is in the pipeline within 1–3 miles? Heavy new supply typically softens prices + rents 12–24 months out; constrained supply supports both.
Investment metrics
- 1% rule
- 1.09% ✓
- Cap rate
- 8.74%
- Cash-on-cash
- 8.73%
- DSCR
- 1.39
- GRM
- 7.7
CMA / ARV
- ARV (on-the-fly)
- $139,200
- Comps found
- 5
Show comp detail 5 sales within ~0.75 mi
| Address | Dist | Beds/Ba | Sqft | Sold | Price | $/sf | Match |
|---|---|---|---|---|---|---|---|
| 138 Frank Dr | 0.11mi | 3/1.5 (+1) | 1,400 (-12%) | 15mo | $99,000 | $71 | 54 |
| 1001 N Bogle Rd | 0.55mi | 3/1.5 (+1) | 1,564 (-2%) | 21mo | $172,500 | $110 | 46 |
| 310 6th St | 0.68mi | 3/3.0 (+1) | 1,425 (-11%) | 0mo | $155,000 | $109 | 41 |
| 705 Price St | 0.66mi | 3/2.0 (+1) | 1,453 (-9%) | 11mo | $125,000 | $86 | 40 |
| 904 Uncas St | 0.71mi | 3/2.0 (+1) | 1,800 (+12%) | 3mo | $156,000 | $87 | 39 |
Match score weights: distance 35% · size 25% · config 20% · recency 20%. Top-matched comps best support the ARV.
Projected returns pro-forma
3.0% appreciation · 3.0% rent growth · sell at horizon
- IRR
- 15.7%
- Equity multiple
- 1.89×
- Total profit
- $25,009
- Equity at exit
- $44,964
- IRR
- 17.3%
- Equity multiple
- 3.53×
- Total profit
- $70,861
- Equity at exit
- $69,295
Cash invested: $28,000 (down + closing). Projections, not guarantees.
Landlord ↔ Tenant lean methodology
- Overall (STATE)
- 90 Strongly Landlord-Friendly
- State Louisiana
- 90 Strongly Landlord-Friendly · R+12
- County
- — inherits STATE
- City
- — inherits STATE
ZIP-level market 71049
- Active inventory
- 7
- Price-to-rent
- 7.7×
Monthly cashflow live
- Estimated rent
- $1,086 medium interval (Pro) →
- Mortgage (P&I)
- −$524
- Tax from tax record
- −$88 /mo · $1,056/yr
- Insurance
- −$42
- HOA
- −$0
- Vacancy / Maint / Mgmt
- −$228
- Net cashflow
- $204
Break-even live
UW: 25.0% down · 7.5% · 30yr · 1.5% tax · 5.0% vac · 8.0% maint · 8.0% mgmt
Financing live
Cash to close
- Down payment
- $25,000
- Closing costs
- $3,000
- Reserves months
- —
- Total cash needed
- —
Loan-product check · same deal, 3 products live
Conventional
25% down · 7.5% · 30yr
- Down + closing
- —
- Monthly P&I
- —
- Monthly cashflow
- —
- DSCR
- —
- Eligible?
- —
Personal DTI + credit; lowest rate.
DSCR
20% down · 8.5% · 30yr
- Down + closing
- —
- Monthly P&I
- —
- Monthly cashflow
- —
- DSCR
- —
- Eligible?
- —
No personal income docs; deal must DSCR.
Hard money
10% down · 12.0% · 12mo
- Down + closing
- —
- Monthly P&I
- —
- Monthly cashflow
- —
- DSCR
- —
- Eligible?
- —
Short-term bridge; refi at stabilization.
Listing history 10 events
-
2026-05-14status Pending
-
2026-05-05price $99,999
-
2026-04-01price $119,000
-
2026-02-23status Active
-
2026-02-11status Pending
-
2025-10-14$129,000 Active
-
2025-07-07historical
-
2025-03-17status Active
-
2025-02-03historical Active Contingent
-
2025-01-13$129,000 Active
ⓘ Source: listings_history table (triggers on properties + properties_extension) + one-shot
backfill from property_details.listing_events for pre-trigger history.
Tax reassessment forecast LA · Resets to sale price
- Current annual tax
- $1,056 · $88/mo
- Projected year-2 tax
- $1,056 · $88/mo
- Expected delta
- $0/yr ($0/mo · 0.0%)
ⓘ Screening estimate from a state-policy table — verify with the county assessor before closing.
Climate risk First Street
- Flood 1/10 Low FEMA zone X (unshaded) · 0% chance over 30 yrs
- Wildfire 3/10 Moderate
- Heat 7/10 Severe 7 d/yr ≥111°F today · 22 d/yr by 30 yrs out
- Wind 8/10 Severe 80% chance of damaging wind over 30 yrs
- Air quality 1/10 Low 0 unhealthy d/yr today · 0 by 30 yrs out
Nearby sold comps map
Loading sold comps map…
Walkable amenities ~0.75 mi
Loading nearby amenities…
Taxation est. · year 1
- Rental income
- $13,028
- − Mortgage interest
- −$5,601
- − Property taxes
- −$1,056
- − Insurance
- −$500
- − Repairs & maintenance
- −$1,042
- − Management
- −$1,042
- − Depreciation
- −$2,909
- Taxable income
- $877
- Est. tax owed @ 24.0%
- −$211
- After-tax cash flow
- $2,233/yr
For passive investors: Depreciation is non-cash, so a rental often shows a tax loss while cash-flowing — sheltering income. Rental losses are passive: they offset passive income freely, and up to $25,000/yr can offset ordinary (W-2) income if you actively participate and your MAGI is under $100k (phasing out to $0 by $150k); unused losses carry forward. On sale, claimed depreciation is recaptured at up to 25%, and gains may owe capital-gains tax (a 1031 exchange can defer both). Figures are a year-1 estimate at your 24.0% rate — not tax advice; consult a CPA.
Schools (NCES district)
- District
- Desoto Parish
- NCES district ID
- 2200510
- Math proficiency
- 35% ▼ -37.00%
- Reading proficiency
- 48% ▼ -31.00%
- Median HH income
- $40,201
- Composite
- 34.75/100
- National rank
- #5130
- State rank
- #21 of 98 in LA
Livability — Logansport
- Score
- 64/100
- State rank
- #162
- US rank
- #13822
Category grades
Schools grade is shown separately in the Schools card above.
Census & demographics
- Census place
- Logansport, LA
- Population (ZIP)
- 3,366
Population outlook (De Soto County) Hauer SSP2
- Today (2025)
- 28,142 people
- By 2030
- 28,546 · +1.4%
- By 2040
- 29,357 · +4.3%
- By 2050
- 30,239 · +7.5%
- By 2075
- 33,412 · +18.7%
- By 2100
- 35,428 · +25.9%
Race, ethnicity, and origin ACS 2023
- Neighborhood character
- Predominantly White (72%)
- Race & ethnicity
- White 72% Black 23% Two or more races 4% Hispanic / Latino 2%
- Common ancestry
- Iranian 4% Lithuanian 4% Serbian 3%
- Foreign-born
- 0%
- Languages at home
- 99% English-only · French/Haitian/Cajun 1%
Political lean MEDSL · De Soto
- 2024 margin
- Solid R (+35.5) · D 31.8% · R 67.3%
- 2008→2024 swing
- -22.1pp toward R · 2008: -13.4pp · 2024: -35.5pp
- All cycles
- 2024: R+35.5 2020: R+24.8 2016: R+21.5 2012: R+13.8 2008: R+13.4
Not yet ingested
- Civics
- —
Market trends
- HPI YoY
- —
- Current HPI
- —
- Rent YoY
- —
- Metro
- —
- State GDP YoY
- ▲ 3.29%
- F500 in state
- 10
Industry mix (Fortune 500 HQ in LA)
| Industry | F500 HQs | Revenue |
|---|---|---|
| Telecommunications | 2 | $23B |
|
||
| Utilities | 1 | $12B |
|
||
| Wholesale / Distribution | 1 | $5B |
|
||
| Advertising | 1 | $2B |
|
||
Price history
-22.5% since first listed10 events — show timeline
- 2026-05-14 Pending — NTREIS
- 2026-05-05 Price Changed $99,999 NTREIS
- 2026-04-01 Price Changed $119,000 NTREIS
- 2026-02-23 Relisted — NTREIS
- 2026-02-11 Pending — NTREIS
- 2025-10-14 Listed $129,000 NTREIS
- 2025-07-07 Listing Removed — NTREIS
- 2025-03-17 Relisted — NTREIS
- 2025-02-03 Contingent — NTREIS
- 2025-01-13 Listed $129,000 NTREIS
Property tax history
+3.2%/yrLatest (2025): $1,056 · +3.2% YoY. Source: county tax records.
Cash-flow waterfall
monthlySold comps — $/sqft
last 12 mo · ≤1 miLoading sold comps…