 Multi-family
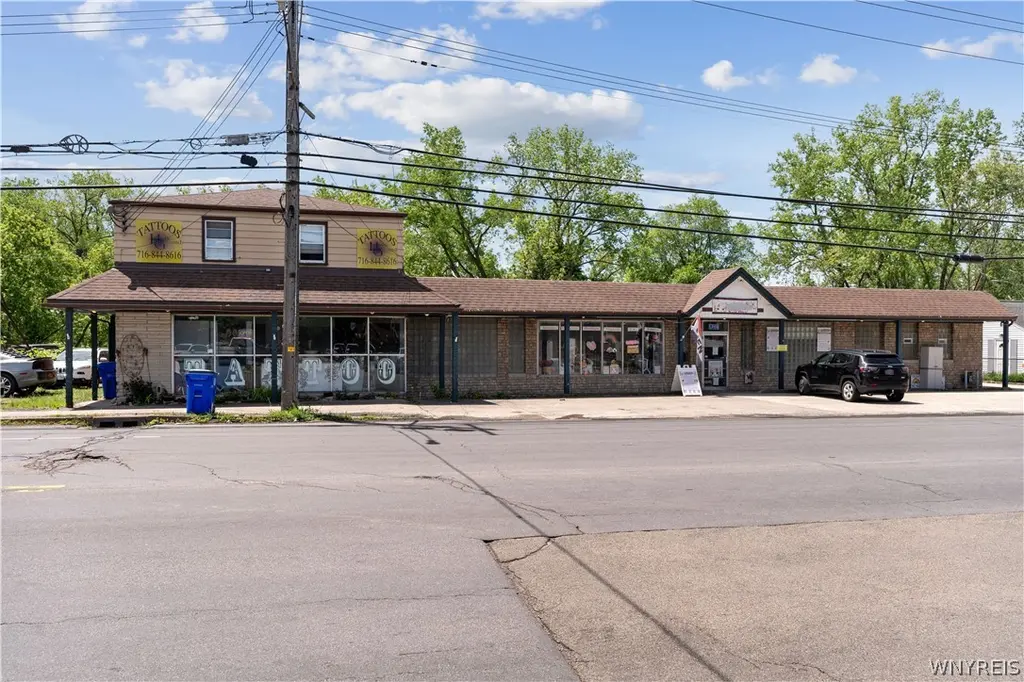
2895 Seneca St · West Seneca, NY
Flood risk No data
- FEMA flood zone
- —
- Chance of flooding over 30 yrs
- —
- Est. flood insurance / yr
- —
Fire risk No data
- Est. fire insurance / yr
- —
Heat risk No data
- Hot days now (above threshold)
- —
- Hot days in 30 yrs
- —
Wind risk No data
- Chance of severe wind over 30 yrs
- —
Air-quality risk No data
- Unhealthy air days now
- —
- Unhealthy air days in 30 yrs
- —
Risk factors via First Street. Map © Google.
Why this score? — see what drove the C grade
The composite is a weighted blend of 9 inputs, each scored 0–100. Each bar is that input's sub-score; the figure is the points it added to the 100-point composite (weight × sub-score).
- Cash flow +22.8/30.0
- ARV discount +7.5/15.0
- DSCR +7.3/10.0
- 1% rule +6.0/10.0
- Schools +4.5/10.0
- Livability +4.0/5.0
- Rent growth +2.5/5.0
- Condition / age +2.2/5.0
- Appreciation +0.0/10.0
$425,000
🖨 Deal sheet 📄 Offer letter ✓ Due diligence
Multi-family units
County records classify this as Multi-Family (2-4 Unit). Listing-text estimate: 1 unit. estimate disagrees with records
Listing remarks
Excellent location, don’t miss this wonderful opportunity! Affordable mixed use building with ample parking. The first commercial space is an established Tattoo studio (1,500 sq ft). The larger commercial space is a retail storefront (3,500 sq ft). Second floor has 2 apartments with laundry in units. Currently fully rented and cash-flowing! Right off the 400 Seneca street exit.
Key facts
- Laundry in units
- Ample parking
- Fully rented
Tags
Property features AI
Finance
- Other: Two-unit multi-family property; Two units in the community; Separate gas meters: 4; Separate electric meters: 4; Zoning: Other - see remarks
- Financial info: Owner pays trash collection and water; Operating expenses include trash and water
Exterior
- Parking: Concrete and paved parking; Multiple parking spaces (two or more)
- Utilities: Electricity connected (circuit breakers); Public water connected; Sewer connected; Cable available; High-speed internet available
- Home design: 2-story building; Existing construction; Flat roof
- Construction: Block and concrete construction; Block foundation
- Exterior features: Near public transit; Rectangular lot
Interior
- Flooring: Carpet; Laminate; Vinyl; Varies
- Bathrooms: 2 full bathrooms
- Heating & cooling: Gas forced-air heating
- Interior features: Accessible entrance; Varied floor coverings throughout
- Laundry & utility: Washer hookup; Gas water heater
Neighborhood map
What this means for you Summary
Snapshot
- This is a 3-bed/2.0-bath multifamily listed at $425k. Condition is rated fair.
Deal economics
- At list price, monthly cash flow is $743 ($9k/yr) — positive.
- The deal already cash-flows at list — no discount required.
- Meets the 1% rule at list price ($5k rent vs $425k).
- Recommended offer: $419k (1.5% below list) — sets the bar for market timing.
- Cap rate 8.4% vs local median 3.7% in West Seneca — top-decile yield for the area; either an underpriced asset or a hidden risk that comps aren't pricing in. Stress-test before assuming the spread holds.
Location & tenants
- Location reads 79/100 on livability (#130 in NY, #2,089 nationally) — a middle-class / working-renter tenant base. Strengths: housing A+, health & safety A+, crime A-; Watch: amenities D, commute F.
- West Seneca Central School District (suburban): math 49% / reading 55% proficiency, ranked #336 of 590 in NY (top 57%) — acceptable for families but not a draw, mixed tenant base, ~2y average lease.
- Market conditions: 201 active listings in the ZIP; 1 comparable units currently listed for rent nearby; 1,244 units permitted in Erie County in 2024 (563 in 5+ unit buildings).
Forward outlook
- Local home prices are declining (-3.0%/yr); year-one equity from $3k of loan paydown is wiped out by about $13k of value loss. Plan a longer hold.
Negotiation context
- It's been on market 17 days — a 2% lower offer ($419k) is reasonable based on typical stale-listing flexibility.
Questions for the listing agent
- Have any recent inspections been done? Can we get a copy of the seller's disclosures and any deferred-maintenance estimates?
- Built in 1969 — when were the roof, HVAC, electrical panel, plumbing, and water heater last replaced?
- Is there a deadline driving the sale (1031 exchange, divorce, estate, relocation)? That informs how much negotiation room exists.
- Schools are B-rated — typically a magnet for longer-tenancy family renters. What's the average tenant stay here, and is there a school-zone premium baked into asking?
- What's the average days-on-market for RENTAL listings here right now (not sales)? A rising rental-DOM trend means longer vacancies and softer asking-rent achievability than the comps imply.
- What's the recent tenant-quality profile in this submarket — average credit score on applications, eviction rate, late-payment / NSF rate, and stable-employment percentage? A property-management company in the area should have these aggregated.
- How much new apartment / multifamily construction is in the pipeline within 1–3 miles? Heavy new supply (>2% of stock underway) typically softens rents 12–24 months out; light construction supports rent growth.
Investment metrics
- 1% rule
- 1.10% ✓
- Cap rate
- 8.39%
- Cash-on-cash
- 7.49%
- DSCR
- 1.33
- GRM
- 7.6
CMA / ARV
No comps found within radius.
Projected returns pro-forma
-3.0% appreciation · 3.0% rent growth · sell at horizon
- IRR
- -4.8%
- Equity multiple
- 0.82×
- Total profit
- $-21,492
- Equity at exit
- $63,369
- IRR
- 4.9%
- Equity multiple
- 1.36×
- Total profit
- $42,484
- Equity at exit
- $36,746
Cash invested: $119,000 (down + closing). Projections, not guarantees.
Landlord ↔ Tenant lean methodology
- Overall (STATE)
- 15 Strongly Tenant-Friendly
- State New York
- 15 Strongly Tenant-Friendly · D+10
- County
- — inherits STATE
- City
- — inherits STATE
ZIP-level market 14224
- Active inventory
- 201
- Price-to-rent
- 22.8×
Monthly cashflow live
- Estimated rent
- $4,658 medium interval (Pro) →
- Mortgage (P&I)
- −$2,229
- Tax est. 1.5%
- −$531 /mo · $6,375/yr
- Insurance
- −$177
- HOA
- −$0
- Vacancy / Maint / Mgmt
- −$978
- Net cashflow
- $743
Break-even live
Sensitivity live
| Price | -10% $1,036 | -5% $890 | +0% $743 | +5% $596 | +10% $449 |
|---|---|---|---|---|---|
| Rent | -10% $375 | -5% $559 | +0% $743 | +5% $927 | +10% $1,111 |
| Rate | -1.0pp $957 | -0.5pp $851 | base $743 | +0.5pp $633 | +1.0pp $521 |
3-unit breakdown (identical units grouped — click to expand)
| Units | Beds | Baths | Est. rent |
|---|---|---|---|
| 3× units | 2 | 1 | $4,659 |
| #1 | 2 | 1 | $1,553 |
| #2 | 2 | 1 | $1,553 |
| #3 | 2 | 1 | $1,553 |
| Total (3 units) | $4,658 | ||
UW: 25.0% down · 7.5% · 30yr · 1.5% tax · 5.0% vac · 8.0% maint · 8.0% mgmt
Financing live
Cash to close
- Down payment
- $106,250
- Closing costs
- $12,750
- Reserves months
- —
- Total cash needed
- —
Loan-product check · same deal, 3 products live
Conventional
25% down · 7.5% · 30yr
- Down + closing
- —
- Monthly P&I
- —
- Monthly cashflow
- —
- DSCR
- —
- Eligible?
- —
Personal DTI + credit; lowest rate.
DSCR
20% down · 8.5% · 30yr
- Down + closing
- —
- Monthly P&I
- —
- Monthly cashflow
- —
- DSCR
- —
- Eligible?
- —
No personal income docs; deal must DSCR.
Hard money
10% down · 12.0% · 12mo
- Down + closing
- —
- Monthly P&I
- —
- Monthly cashflow
- —
- DSCR
- —
- Eligible?
- —
Short-term bridge; refi at stabilization.
Rent comps 1 comps
| Address | Beds | Baths | Sqft | Rent | $/sqft | DOM | Units | Dist |
|---|---|---|---|---|---|---|---|---|
| 396 Sudbury Rd Unit 396 Lackawanna, NY | 2.0 | 1.0 | 5211 | $1,250 | $0.24 | 44d | 1 | 1.16mi |
Listing history 12 events
-
2026-06-18days on market $425,000 Active 17 DOM
-
2026-06-17days on market $425,000 Active 16 DOM
-
2026-06-16days on market $425,000 Active 15 DOM
-
2026-06-15days on market $425,000 Active 14 DOM
-
2026-06-13days on market $425,000 Active 12 DOM
-
2026-06-10days on market $425,000 Active 9 DOM
-
2026-06-09days on market $425,000 Active 8 DOM
-
2026-06-08days on market $425,000 Active 7 DOM
-
2026-06-07days on market $425,000 Active 6 DOM
-
2026-06-03days on market $425,000 Active 2 DOM
-
2026-06-02remarks 380-char remark
-
2026-06-02$425,000 Active 1 DOM
ⓘ Source: listings_history table (triggers on properties + properties_extension) + one-shot
backfill from property_details.listing_events for pre-trigger history.
Nearby sold comps map
Loading sold comps map…
Walkable amenities ~0.75 mi
Loading nearby amenities…
Taxation est. · year 1
- Rental income
- $55,896
- − Mortgage interest
- −$23,807
- − Property taxes
- −$6,375
- − Insurance
- −$2,125
- − Repairs & maintenance
- −$4,472
- − Management
- −$4,472
- − Depreciation
- −$12,364
- Taxable income
- $2,282
- Est. tax owed @ 24.0%
- −$548
- After-tax cash flow
- $8,365/yr
For passive investors: Depreciation is non-cash, so a rental often shows a tax loss while cash-flowing — sheltering income. Rental losses are passive: they offset passive income freely, and up to $25,000/yr can offset ordinary (W-2) income if you actively participate and your MAGI is under $100k (phasing out to $0 by $150k); unused losses carry forward. On sale, claimed depreciation is recaptured at up to 25%, and gains may owe capital-gains tax (a 1031 exchange can defer both). Figures are a year-1 estimate at your 24.0% rate — not tax advice; consult a CPA.
Condition & rehab AI · 12 photos
This mixed-use building requires moderate renovations to improve its exterior and interior conditions, enhancing its resale and rental value.
Repairs flagged
- Major exterior siding — Significant wear and tear
- Major flooring — Worn carpet
- Major interior walls/paint — Painted walls need touch-up
Value-add opportunities
- Both exterior siding repair — Improves curb appeal and property value
- Both flooring replacement — Enhances interior aesthetics and usability
- Both paint touch-up — Enhances interior aesthetics and usability
Renovation cost estimate screening
| Repair item | Severity | Est. cost |
|---|---|---|
| exterior siding · Significant wear and tear | Major | $15,000–50,000 |
| flooring · Worn carpet | Major | $15,000–50,000 |
| interior walls/paint · Painted walls need touch-up | Major | $15,000–50,000 |
| Total estimated repair cost · 3 items | $45,000–150,000 |
Value-add ROI direction
- Both exterior siding repair — Improves curb appeal and property value ↑
- Both flooring replacement — Enhances interior aesthetics and usability ↑
- Both paint touch-up — Enhances interior aesthetics and usability ↑
ⓘ Cost ranges are severity-bucket heuristics (US national rule-of-thumb). Get contractor quotes + a written scope before underwriting a rehab budget.
Schools (NCES district)
- District
- West Seneca Central School District
- NCES district ID
- 3630780
- Math proficiency
- 49% ▼ -15.00%
- Reading proficiency
- 55% ▼ -4.00%
- Median HH income
- $54,231
- Composite
- 44.83/100
- National rank
- #2735
- State rank
- #336 of 590 in NY
Livability — West Seneca
- Score
- 79/100
- State rank
- #130
- US rank
- #2089
Category grades
Schools grade is shown separately in the Schools card above.
Census & demographics
- Census place
- West Seneca, NY
- City population
- 41,101
- Population (ZIP)
- 41,101
Population outlook (Erie County) Hauer SSP2
- Today (2025)
- 933,037 people
- By 2030
- 935,181 · +0.2%
- By 2040
- 928,531 · -0.5%
- By 2050
- 905,725 · -2.9%
- By 2075
- 834,037 · -10.6%
- By 2100
- 708,033 · -24.1%
Race, ethnicity, and origin ACS 2023
- Neighborhood character
- Predominantly White (91%)
- Race & ethnicity
- White 91% Hispanic / Latino 4% Two or more races 3% Black 2%
- Common ancestry
- Romanian 22% Lithuanian 2% Iranian 1%
- Foreign-born
- 2% · Canada
- Languages at home
- 95% English-only · Spanish 2% Russian/Polish/Slavic 1% Arabic 1%
Political lean MEDSL · Erie
- 2024 margin
- Lean D (+9.7) · D 54.8% · R 45.2%
- 2008→2024 swing
- -7.9pp toward R · 2008: 17.5pp · 2024: 9.7pp
- All cycles
- 2024: D+9.7 2020: D+14.7 2016: D+4.8 2012: D+15.6 2008: D+17.5
Not yet ingested
- Civics
- —
Market trends
- HPI YoY
- ▼ -211.03%
- Current HPI
- 303.7523
- Rent YoY
- —
- Metro
- —
- State GDP YoY
- ▲ 2.60%
- F500 in state
- 92
Industry mix (Fortune 500 HQ in NY)
| Industry | F500 HQs | Revenue |
|---|---|---|
| Financial Services | 10 | $950B |
|
||
| Consumer Goods | 9 | $162B |
|
||
| Insurance | 4 | $225B |
|
||
| Telecommunications | 2 | $144B |
|
||
| Pharmaceuticals | 2 | $112B |
|
||
| Media / Entertainment | 2 | $69B |
|
||
Price history
1 event — show timeline
- 2026-05-28 Listed $425,000 WNYREIS
Cash-flow waterfall
monthlySold comps — $/sqft
last 12 mo · ≤1 miLoading sold comps…