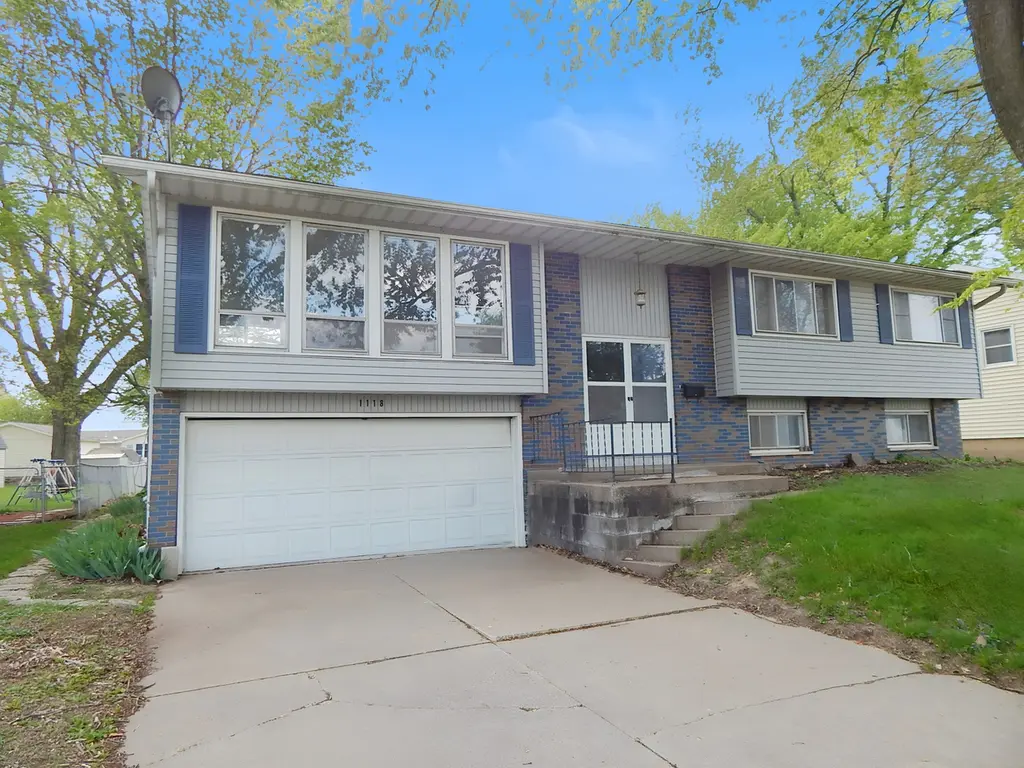
1118 N 13th St · Clinton, IA
Flood risk 1/10 · Minimal
- FEMA flood zone
- X (unshaded)
- Chance of flooding over 30 yrs
- 0.0%
- Est. flood insurance / yr
- $473 – $860
Fire risk 3/10 · Minor
- Est. fire insurance / yr
- $902 – $1,676
Heat risk 3/10 · Minor
- Hot days now (above 103°F)
- 7 days/yr
- Hot days in 30 yrs
- 16 days/yr
Wind risk 2/10 · Minimal
- Chance of severe wind over 30 yrs
- —
Air-quality risk 3/10 · Minor
- Unhealthy air days now
- 2 days/yr
- Unhealthy air days in 30 yrs
- 3 days/yr
Risk factors via First Street. Map © Google.
Why this score? — see what drove the C- grade
The composite is a weighted blend of 9 inputs, each scored 0–100. Each bar is that input's sub-score; the figure is the points it added to the 100-point composite (weight × sub-score).
- Cash flow +15.7/30.0
- ARV discount +14.6/15.0
- DSCR +4.8/10.0
- 1% rule +4.5/10.0
- Schools +4.5/10.0
- Livability +3.8/5.0
- Rent growth +2.5/5.0
- Condition / age +2.5/5.0
- Appreciation +0.0/10.0
$145,000
🖨 Deal sheet 📄 Offer letter ✓ Due diligence
Listing remarks
Check out the awesome details for this spacious home, which offers four generously sized bedrooms conveniently located on the main floor. Plus a possibility of 2- more non-conforming bedrooms in the lower level. The informal dining area features sliding glass doors that open onto a deck, perfect for outdoor meals and relaxing. The main level includes a full bathroom that was tastefully remodeled in 2003, providing modern comfort, while the kitchen boasts beautiful oak cabinets and a warm, inviting atmosphere. Lower level has a 1/2 bathroom. Additionally, the lower level includes a large, versatile living room that is ideal for family gatherings, entertainment, or a home office. Yard is over
Key facts
- Oak cabinets
- Oversized yard
- Remodeled bathroom
Tags
Property features AI
Finance
- Other: Property sits on a lot approximately 70 x 159 (less than 0.25 acre)
- HOA & community: No master association fee required
Exterior
- Parking: Attached concrete garage (2 vehicle capacity); 2 parking spaces total
- Utilities: Public water; Public sewer
- Home design: Detached single-family raised ranch; Fee simple ownership; Approximately 61–70 years old; Asphalt roof
- Construction: Vinyl siding and frame construction; Block foundation
- Exterior features: Deck; Lot is level to sloped
Interior
- Kitchen: Kitchen on main level (11 x 18)
- Bedrooms: 4 bedrooms total; Master bedroom on main level; Three additional main-level bedrooms (11 x 12; 10 x 11; 9 x 9)
- Flooring: Laminate flooring in living room; Other flooring types in bedrooms, dining and kitchen
- Bathrooms: 1 full bathroom; 1 half bathroom; Basement has bathroom access
- Heating & cooling: Natural gas heating; Steam heating
- Interior features: 8 total rooms; Basement with cellar; Below-grade finished area included
- Laundry & utility: Basement laundry room (5 x 6)
Neighborhood map
What this means for you Summary
Snapshot
- This is a 4-bed/2.5-bath single-family listed at $145k.
Deal economics
- At list price, monthly cash flow is $64 ($770/yr) — positive.
- The deal already cash-flows at list — no discount required.
- To meet the 1% rule (rent ≥ 1% of price), the offer needs to be $138k (5.0% below list).
- Recommended offer: $138k (5.0% below list) — sets the bar for 1% rule.
Location & tenants
- Location reads 75/100 on livability (#222 in IA, #4,192 nationally) — a middle-class / working-renter tenant base. Strengths: cost of living A+, housing A+, health & safety A+; Watch: amenities C-, crime D, employment D.
- Clinton Community School District (town): math 52% / reading 56% proficiency, ranked #273 of 289 in IA (top 94%) — acceptable for families but not a draw, mixed tenant base, ~2y average lease.
- Market conditions: 246 active listings in the ZIP; 116 units permitted in Clinton County in 2024 (50 in 5+ unit buildings).
Forward outlook
- Local home prices are declining (-3.0%/yr); year-one equity from $1k of loan paydown is wiped out by about $4k of value loss. Plan a longer hold.
- Clinton County population projected at -19% by 2050 — secular population decline; favor cash flow + early exit over multi-decade hold.
Negotiation context
- It's been on market 55 days — a 3% lower offer ($141k) is reasonable based on typical stale-listing flexibility.
- 7 sale attempts since 22y ago with the ask held roughly flat each time — persistent listings suggest the price (not the market) is what's stuck; bring a comps-based counter.
Questions for the listing agent
- It's been on market 55 days. Have you received any prior offers? Is the seller open to a 5% concession, seller financing, or rate buy-down credit?
- Built in 1964 — when were the roof, HVAC, electrical panel, plumbing, and water heater last replaced?
- Is there a deadline driving the sale (1031 exchange, divorce, estate, relocation)? That informs how much negotiation room exists.
- Schools are B-rated — typically a magnet for longer-tenancy family renters. What's the average tenant stay here, and is there a school-zone premium baked into asking?
- Crime grade is D in this area — have there been break-ins, vandalism, or insurance claims at this property in the last 3 years? What carrier currently insures it and at what premium?
- What's the average days-on-market for RENTAL listings here right now (not sales)? A rising rental-DOM trend means longer vacancies and softer asking-rent achievability than the comps imply.
- What's the recent tenant-quality profile in this submarket — average credit score on applications, eviction rate, late-payment / NSF rate, and stable-employment percentage? A property-management company in the area should have these aggregated.
- How much new for-sale + rental construction is in the pipeline within 1–3 miles? Heavy new supply typically softens prices + rents 12–24 months out; constrained supply supports both.
Investment metrics
- 1% rule
- 0.95% ✗
- Cap rate
- 6.82%
- Cash-on-cash
- 1.90%
- DSCR
- 1.08
- GRM
- 8.8
CMA / ARV
- ARV (median comp)
- $172,071
- List price
- $145,000
- Delta
- -15.73%
- Verdict
- UNDERPRICED
- Comps
- 20 within 1.0 mi
Show comp detail 12 sales within ~0.75 mi
| Address | Dist | Beds/Ba | Sqft | Sold | Price | $/sf | Match |
|---|---|---|---|---|---|---|---|
| 1212 N 12th St | 0.16mi | 3/2.0 (-1) | 1,737 (-4%) | 0mo | $159,000 | $92 | 79 |
| 1324 13th Ave N | 0.16mi | 3/2.5 (-1) | 1,887 (+5%) | 1mo | $242,000 | $128 | 79 |
| 1145 N 14th St | 0.10mi | 3/2.0 (-1) | 1,643 (-9%) | 3mo | $241,000 | $147 | 71 |
| 918 Alanah Ln | 0.55mi | 4/3.0 | 1,706 (-5%) | 14mo | $319,509 | $187 | 52 |
| 1146 6th Ave N | 0.54mi | 3/2.5 (-1) | 1,649 (-8%) | 5mo | $180,000 | $109 | 52 |
| 1206 10th Ave N | 0.22mi | 3/1.0 (-1) | 1,532 (-15%) | 3mo | $184,900 | $121 | 51 |
| 1637 Garrett Ave | 0.42mi | 4/3.0 | 1,618 (-10%) | 12mo | $460,000 | $284 | 51 |
| 1630 Garrett Ave | 0.41mi | 4/3.0 | 1,597 (-11%) | 13mo | $449,120 | $281 | 49 |
| 1500 9th St NW | 0.60mi | 4/1.5 | 2,005 (+11%) | 2mo | $144,000 | $72 | 48 |
| 1024 10th Ave N | 0.37mi | 3/3.0 (-1) | 1,532 (-15%) | 4mo | $220,000 | $144 | 48 |
| 1356 Springdale Dr | 0.61mi | 4/2.0 | 2,044 (+13%) | 3mo | $175,000 | $86 | 44 |
| 1625 Garrett Ave | 0.41mi | 3/3.0 (-1) | 1,532 (-15%) | 13mo | $459,900 | $300 | 38 |
Match score weights: distance 35% · size 25% · config 20% · recency 20%. Top-matched comps best support the ARV.
Projected returns pro-forma
-3.0% appreciation · 3.0% rent growth · sell at horizon
- IRR
- -13.3%
- Equity multiple
- 0.52×
- Total profit
- $-19,377
- Equity at exit
- $21,620
- IRR
- -4.3%
- Equity multiple
- 0.72×
- Total profit
- $-11,473
- Equity at exit
- $12,537
Cash invested: $40,600 (down + closing). Projections, not guarantees.
Landlord ↔ Tenant lean methodology
- Overall (STATE)
- 83 Strongly Landlord-Friendly
- State Iowa
- 83 Strongly Landlord-Friendly · R+6
- County
- — inherits STATE
- City
- — inherits STATE
ZIP-level market 52732
- Home prices YoY
- -34.9%
- Active inventory
- 246
- Price-to-rent
- 8.8×
Monthly cashflow live
- Estimated rent
- $1,378 medium interval (Pro) →
- Mortgage (P&I)
- −$760
- Tax from tax record
- −$203 /mo · $2,440/yr
- Insurance
- −$60
- HOA
- −$0
- Vacancy / Maint / Mgmt
- −$289
- Net cashflow
- $64
Break-even live
UW: 25.0% down · 7.5% · 30yr · 1.5% tax · 5.0% vac · 8.0% maint · 8.0% mgmt
Financing live
Cash to close
- Down payment
- $36,250
- Closing costs
- $4,350
- Reserves months
- —
- Total cash needed
- —
Loan-product check · same deal, 3 products live
Conventional
25% down · 7.5% · 30yr
- Down + closing
- —
- Monthly P&I
- —
- Monthly cashflow
- —
- DSCR
- —
- Eligible?
- —
Personal DTI + credit; lowest rate.
DSCR
20% down · 8.5% · 30yr
- Down + closing
- —
- Monthly P&I
- —
- Monthly cashflow
- —
- DSCR
- —
- Eligible?
- —
No personal income docs; deal must DSCR.
Hard money
10% down · 12.0% · 12mo
- Down + closing
- —
- Monthly P&I
- —
- Monthly cashflow
- —
- DSCR
- —
- Eligible?
- —
Short-term bridge; refi at stabilization.
Listing history 32 events
-
2026-06-19days on market $145,000 Active 55 DOM
-
2026-06-18days on market $145,000 Active 54 DOM
-
2026-06-17days on market $145,000 Active 53 DOM
-
2026-06-16days on market $145,000 Active 52 DOM
-
2026-06-15days on market $145,000 Active 51 DOM
-
2026-06-14days on market $145,000 Active 49 DOM
-
2026-06-12days on market $145,000 Active 48 DOM
-
2026-06-09days on market $145,000 Active 45 DOM
-
2026-06-08days on market $145,000 Active 44 DOM
-
2026-06-07days on market $145,000 Active 43 DOM
-
2026-06-07days on market $145,000 Active 42 DOM
-
2026-06-03days on market $145,000 Active 39 DOM
-
2026-06-02days on market $145,000 Active 38 DOM
-
2026-06-01days on market $145,000 Active 37 DOM
-
2026-05-31days on market $145,000 Active 36 DOM
-
2026-05-30days on market $145,000 Active 35 DOM
-
2026-04-24$145,000 Active 746-char remark
-
2026-04-17historical
-
2026-03-31status Active
-
2026-03-20status Pending
-
2026-02-17status Active
-
2026-02-16historical
-
2026-01-23price
-
2026-01-18status Active
-
2026-01-14historical
-
2026-01-06historical
-
2025-11-18Active
-
2025-03-23historical
-
2024-09-27Active
-
2023-11-20soldstatus $173,000
-
2004-11-29soldstatus $108,000
-
2004-08-06$115,900
ⓘ Source: listings_history table (triggers on properties + properties_extension) + one-shot
backfill from property_details.listing_events for pre-trigger history.
Tax reassessment forecast IA · Partial reset (capped growth)
- Current annual tax
- $2,440 · $203/mo
- Projected year-2 tax
- $2,440 · $203/mo
- Expected delta
- $0/yr ($0/mo · 0.0%)
ⓘ Screening estimate from a state-policy table — verify with the county assessor before closing.
Climate risk First Street
- Flood 1/10 Low FEMA zone X (unshaded) · 0% chance over 30 yrs
- Wildfire 3/10 Moderate
- Heat 3/10 Moderate 7 d/yr ≥103°F today · 16 d/yr by 30 yrs out
- Wind 2/10 Low
- Air quality 3/10 Moderate 2 unhealthy d/yr today · 3 by 30 yrs out
Nearby sold comps map
Loading sold comps map…
Walkable amenities ~0.75 mi
Loading nearby amenities…
Taxation est. · year 1
- Rental income
- $16,531
- − Mortgage interest
- −$8,122
- − Property taxes
- −$2,440
- − Insurance
- −$725
- − Repairs & maintenance
- −$1,322
- − Management
- −$1,322
- − Depreciation
- −$4,218
- Taxable loss
- −$1,619
- Est. tax savings @ 24.0%
- +$389
- After-tax cash flow
- $1,158/yr
For passive investors: Depreciation is non-cash, so a rental often shows a tax loss while cash-flowing — sheltering income. Rental losses are passive: they offset passive income freely, and up to $25,000/yr can offset ordinary (W-2) income if you actively participate and your MAGI is under $100k (phasing out to $0 by $150k); unused losses carry forward. On sale, claimed depreciation is recaptured at up to 25%, and gains may owe capital-gains tax (a 1031 exchange can defer both). Figures are a year-1 estimate at your 24.0% rate — not tax advice; consult a CPA.
Schools (NCES district)
- District
- Clinton Community School District
- NCES district ID
- 1907710
- Math proficiency
- 52% ▼ -13.00%
- Reading proficiency
- 56% ▼ -8.00%
- Median HH income
- $40,900
- Composite
- 45.22/100
- National rank
- #2666
- State rank
- #273 of 289 in IA
Livability — Clinton
- Score
- 75/100
- State rank
- #222
- US rank
- #4192
Category grades
Schools grade is shown separately in the Schools card above.
Census & demographics
- Census place
- Clinton, IA
- County
- Clinton County · 25,880 people
- City population
- 25,880
- Metro
- Clinton, IA
- Population (ZIP)
- 25,880
- Household income
- $61,105
- Rent vs Own
- Severe rent burden
- 889.0
Population outlook (Clinton County) Hauer SSP2
- Today (2025)
- 44,817 people
- By 2030
- 43,090 · -3.9%
- By 2040
- 39,513 · -11.8%
- By 2050
- 36,209 · -19.2%
- By 2075
- 31,888 · -28.8%
- By 2100
- 30,382 · -32.2%
Race, ethnicity, and origin ACS 2023
- Neighborhood character
- Predominantly White (86%)
- Race & ethnicity
- White 86% Two or more races 7% Hispanic / Latino 5% Black 4%
- Common ancestry
- Iranian 4% Portuguese 2% Lithuanian 2%
- Foreign-born
- 2% · Canada
- Languages at home
- 97% English-only · Spanish 2% Arabic 1%
Political lean MEDSL · Clinton
- 2024 margin
- R (+18.9) · D 39.8% · R 58.6% · Other 1.6%
- 2008→2024 swing
- -41.9pp toward R · 2008: 23.0pp · 2024: -18.9pp
- All cycles
- 2024: R+18.9 2020: R+10.3 2016: R+5.1 2012: D+22.9 2008: D+23.0
Not yet ingested
- Civics
- —
Market trends
- HPI YoY
- ▼ -83.23%
- Current HPI
- 155.3426
- Rent YoY
- —
- Metro
- Clinton, IA
- State GDP YoY
- ▲ 2.48%
- F500 in state
- 4
Industry mix (Fortune 500 HQ in IA)
| Industry | F500 HQs | Revenue |
|---|---|---|
| Financial Services | 1 | $16B |
|
||
| Retail / Convenience | 1 | $15B |
|
||
Price history
+25.1% since first listed16 events — show timeline
- 2026-04-24 Listed $145,000 MRED as Distributed by MLS Grid
- 2026-04-17 Listing Removed — MRED as Distributed by MLS Grid
- 2026-03-31 Relisted — MRED as Distributed by MLS Grid
- 2026-03-20 Pending — MRED as Distributed by MLS Grid
- 2026-02-17 Relisted — MRED as Distributed by MLS Grid
- 2026-02-16 Listing Removed — MRED as Distributed by MLS Grid
- 2026-01-23 Price Changed — MRED as Distributed by MLS Grid
- 2026-01-18 Relisted — MRED as Distributed by MLS Grid
- 2026-01-14 Listing Removed — MRED as Distributed by MLS Grid
- 2026-01-06 Listing Removed — RMLSA as Distributed by MLS Grid
- 2025-11-18 Listed — RMLSA as Distributed by MLS Grid
- 2025-03-23 Listing Removed — MRED as Distributed by MLS Grid
- 2024-09-27 Listed — RMLSA as Distributed by MLS Grid
- 2023-11-20 Sold (Public Records) $173,000 Public Records
- 2004-11-29 Sold (MLS) $108,000 RMLSA as Distributed by MLS Grid
- 2004-08-06 Listed $115,900 RMLSA as Distributed by MLS Grid
Property tax history
+0.6%/yrLatest (2025): $2,440 · +10.2% YoY. Source: county tax records.
Cash-flow waterfall
monthlySold comps — $/sqft
last 12 mo · ≤1 miLoading sold comps…