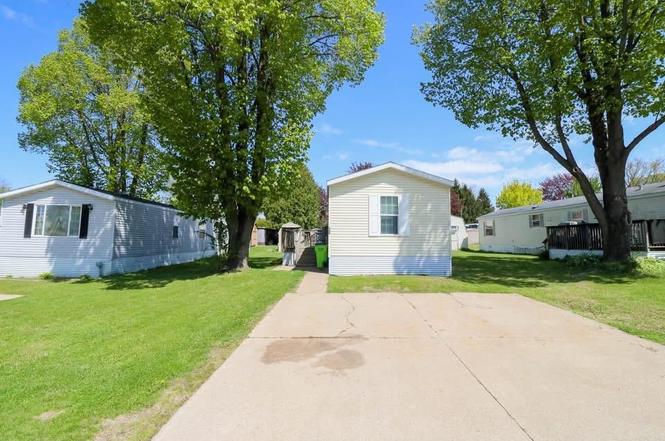
N3305 Cty M #125 · West Salem, WI
Flood risk No data
- FEMA flood zone
- —
- Chance of flooding over 30 yrs
- —
- Est. flood insurance / yr
- —
Fire risk No data
- Est. fire insurance / yr
- —
Heat risk No data
- Hot days now (above threshold)
- —
- Hot days in 30 yrs
- —
Wind risk No data
- Chance of severe wind over 30 yrs
- —
Air-quality risk No data
- Unhealthy air days now
- —
- Unhealthy air days in 30 yrs
- —
Risk factors via First Street. Map © Google.
Why this score? — see what drove the B+ grade
The composite is a weighted blend of 9 inputs, each scored 0–100. Each bar is that input's sub-score; the figure is the points it added to the 100-point composite (weight × sub-score).
- Cash flow +30.0/30.0
- 1% rule +10.0/10.0
- DSCR +10.0/10.0
- ARV discount +7.5/15.0
- Appreciation +5.0/10.0
- Schools +4.0/10.0
- Livability +3.8/5.0
- Rent growth +2.5/5.0
- Condition / age +2.5/5.0
$65,000
🖨 Deal sheet (PDF) 📄 Offer letter ✓ Due diligence
Listing remarks
Don?t miss this beautifully maintained 2015 Fortune 16x80 mobile home featuring 3 spacious bedrooms and 2 full bathrooms. Step inside to a clean, modern interior with an open and roomy layout that feels warm and welcoming. Recent updates include new flooring throughout and a frost barrier installed under the home for added comfort and efficiency. All appliances are less than 3 years old, making this home truly move-in ready. Well cared for and priced to sell, this is an excellent opportunity for comfortable, affordable living.
Key facts
- Modern interior
- Move-in ready
- New flooring
Tags
Neighborhood map
What this means for you Summary
Snapshot
- This is a 3-bed/2.0-bath single-family listed at $65k.
Deal economics
- At list price, monthly cash flow is $341 ($4k/yr) — positive.
- The deal already cash-flows at list — no discount required.
- Meets the 1% rule at list price ($1k rent vs $65k).
- Recommended offer: $63k (3.0% below list) — sets the bar for market timing.
Location & tenants
- Location reads 75/100 on livability (#155 in WI, #4,243 nationally) — a middle-class / working-renter tenant base. Strengths: cost of living A+, housing A+, crime A; Watch: health & safety D, amenities F, commute F.
- West Salem School District (suburban): math 46% / reading 43% proficiency, ranked #86 of 342 in WI (top 25%) — families likely to look elsewhere, expect single-tenant / working-renter base with shorter leases; only 18% free/reduced lunch — higher-income household profile.
- Market conditions: 1 active listings in the ZIP; 1 comparable units currently listed for rent nearby; 268 units permitted in La Crosse County in 2024 (10 in 5+ unit buildings).
Forward outlook
- In year one you build about $2k of equity ($449 loan paydown + $2k appreciation (3.0% local appreciation)).
- La Crosse County population projected at +14% by 2050 — modest demand growth; plan on rents tracking national, not racing it.
- At projected returns (3.0% appreciation + 3.0% rent growth), your $18k cash investment doubles in ~3 years — after that, you're playing with house money.
Negotiation context
- It's been on market 57 days — a 3% lower offer ($63k) is reasonable based on typical stale-listing flexibility.
Questions for the listing agent
- It's been on market 57 days. Have you received any prior offers? Is the seller open to a 3% concession, seller financing, or rate buy-down credit?
- Is there a deadline driving the sale (1031 exchange, divorce, estate, relocation)? That informs how much negotiation room exists.
- Schools are A-rated — typically a magnet for longer-tenancy family renters. What's the average tenant stay here, and is there a school-zone premium baked into asking?
- What's the average days-on-market for RENTAL listings here right now (not sales)? A rising rental-DOM trend means longer vacancies and softer asking-rent achievability than the comps imply.
- What's the recent tenant-quality profile in this submarket — average credit score on applications, eviction rate, late-payment / NSF rate, and stable-employment percentage? A property-management company in the area should have these aggregated.
- How much new for-sale + rental construction is in the pipeline within 1–3 miles? Heavy new supply typically softens prices + rents 12–24 months out; constrained supply supports both.
Investment metrics
- 1% rule
- 1.54% ✓
- Cap rate
- 12.58%
- Cash-on-cash
- 22.47%
- DSCR
- 2.00
- GRM
- 5.4
CMA / ARV
- ARV (on-the-fly)
- $270,080
- Comps found
- 12
Show comp detail 12 sales within ~0.75 mi
| Address | Dist | Beds/Ba | Sqft | Sold | Price | $/sf | Match |
|---|---|---|---|---|---|---|---|
| 353 Rose Street St N | 0.17mi | 2/1.0 (-1) | 1,222 (-4%) | 0mo | $258,000 | $211 | 75 |
| 222 Lincoln Avenue Ave N | 0.26mi | 3/1.0 | 1,222 (-4%) | 2mo | $245,000 | $200 | 75 |
| 404 Tilson Street North St | 0.24mi | 3/1.0 | 1,300 (+2%) | 13mo | $299,500 | $230 | 72 |
| W2869 Buol Rd | 0.53mi | 3/2.0 | 1,300 (+2%) | 7mo | $177,000 | $136 | 67 |
| 544 Leonard Street St N | 0.31mi | 3/2.0 | 1,160 (-9%) | 4mo | $385,000 | $332 | 67 |
| 133 Hamlin Street West St | 0.32mi | 3/2.0 | 1,321 (+3%) | 22mo | $295,000 | $223 | 62 |
| 353 Rose Street North St | 0.17mi | 2/1.0 (-1) | 1,222 (-4%) | 22mo | $211,000 | $173 | 57 |
| 120 Van Ness Street North St | 0.22mi | 3/1.0 | 1,444 (+13%) | 13mo | $335,000 | $232 | 54 |
| 428 Franklin Street West St | 0.31mi | 2/1.0 (-1) | 1,248 (-2%) | 23mo | $235,000 | $188 | 54 |
| 252 Hamlin Street East St | 0.37mi | 4/2.0 (+1) | 1,459 (+14%) | 19mo | $311,000 | $213 | 39 |
| 132 West Avenue South Ave | 0.52mi | 2/1.0 (-1) | 1,139 (-11%) | 17mo | $189,000 | $166 | 34 |
| 151 West Avenue South Ave | 0.50mi | 2/1.0 (-1) | 1,140 (-11%) | 19mo | $240,000 | $211 | 34 |
Match score weights: distance 35% · size 25% · config 20% · recency 20%. Top-matched comps best support the ARV.
Projected returns pro-forma
3.0% appreciation · 3.0% rent growth · sell at horizon
- IRR
- 28.7%
- Equity multiple
- 2.62×
- Total profit
- $29,551
- Equity at exit
- $29,227
- IRR
- 29.2%
- Equity multiple
- 5.11×
- Total profit
- $74,810
- Equity at exit
- $45,042
Cash invested: $18,200 (down + closing). Projections, not guarantees.
Landlord ↔ Tenant lean methodology
- Overall (STATE)
- 73 Landlord-Friendly
- State Wisconsin
- 73 Landlord-Friendly · R+2
- County
- — inherits STATE
- City
- — inherits STATE
ZIP-level market 55469
- Active inventory
- 1
- Price-to-rent
- 5.4×
Monthly cashflow live
- Estimated rent
- $1,000 medium interval (Pro) →
- Mortgage (P&I)
- −$341
- Tax est. 1.5%
- −$81 /mo · $975/yr
- Insurance
- −$27
- HOA
- −$0
- Vacancy / Maint / Mgmt
- −$210
- Net cashflow
- $341
Break-even live
Sensitivity live
| Price | -10% $386 | -5% $363 | +0% $341 | +5% $318 | +10% $296 |
|---|---|---|---|---|---|
| Rent | -10% $262 | -5% $301 | +0% $341 | +5% $380 | +10% $420 |
| Rate | -1.0pp $374 | -0.5pp $357 | base $341 | +0.5pp $324 | +1.0pp $307 |
UW: 25.0% down · 7.5% · 30yr · 1.5% tax · 5.0% vac · 8.0% maint · 8.0% mgmt
Financing live
Cash to close
- Down payment
- $16,250
- Closing costs
- $1,950
- Reserves months
- —
- Total cash needed
- —
Loan-product check · same deal, 3 products live
Conventional
25% down · 7.5% · 30yr
- Down + closing
- —
- Monthly P&I
- —
- Monthly cashflow
- —
- DSCR
- —
- Eligible?
- —
Personal DTI + credit; lowest rate.
DSCR
20% down · 8.5% · 30yr
- Down + closing
- —
- Monthly P&I
- —
- Monthly cashflow
- —
- DSCR
- —
- Eligible?
- —
No personal income docs; deal must DSCR.
Hard money
10% down · 12.0% · 12mo
- Down + closing
- —
- Monthly P&I
- —
- Monthly cashflow
- —
- DSCR
- —
- Eligible?
- —
Short-term bridge; refi at stabilization.
Rent comps 1 comps
| Address | Beds | Baths | Sqft | Rent | $/sqft | DOM | Units | Dist |
|---|---|---|---|---|---|---|---|---|
| 216 West Ave Unit 5 West Salem, WI | 2.0 | 2.0 | 950 | $1,000 | $1.05 | 15d | 1 | 0.49mi |
Listing history 22 events
-
2026-06-21days on market $65,000 Active 57 DOM
-
2026-06-19days on market $65,000 Active 55 DOM
-
2026-06-18days on market $65,000 Active 54 DOM
-
2026-06-17days on market $65,000 Active 53 DOM
-
2026-06-16days on market $65,000 Active 52 DOM
-
2026-06-15days on market $65,000 Active 51 DOM
-
2026-06-14days on market $65,000 Active 49 DOM
-
2026-06-13days on market $65,000 Active 48 DOM
-
2026-06-10days on market $65,000 Active 46 DOM
-
2026-06-09days on market $65,000 Active 45 DOM
-
2026-06-08days on market $65,000 Active 44 DOM
-
2026-06-07days on market $65,000 Active 43 DOM
-
2026-06-05days on market $65,000 Active 40 DOM
-
2026-06-03days on market $65,000 Active 39 DOM
-
2026-06-02days on market $65,000 Active 38 DOM
-
2026-06-01days on market $65,000 Active 37 DOM
-
2026-05-31days on market $65,000 Active 36 DOM
-
2026-05-30days on market $65,000 Active 35 DOM
-
2026-01-22status Pending
-
2026-01-13price $65,000
-
2026-01-06price $75,000
-
2025-12-19$80,000 Active
ⓘ Source: listings_history table (triggers on properties + properties_extension) + one-shot
backfill from property_details.listing_events for pre-trigger history.
Nearby sold comps map
Loading sold comps map…
Walkable amenities ~0.75 mi
Loading nearby amenities…
Taxation est. · year 1
- Rental income
- $12,000
- − Mortgage interest
- −$3,641
- − Property taxes
- −$975
- − Insurance
- −$325
- − Repairs & maintenance
- −$960
- − Management
- −$960
- − Depreciation
- −$1,891
- Taxable income
- $3,248
- Est. tax owed @ 24.0%
- −$780
- After-tax cash flow
- $3,310/yr
For passive investors: Depreciation is non-cash, so a rental often shows a tax loss while cash-flowing — sheltering income. Rental losses are passive: they offset passive income freely, and up to $25,000/yr can offset ordinary (W-2) income if you actively participate and your MAGI is under $100k (phasing out to $0 by $150k); unused losses carry forward. On sale, claimed depreciation is recaptured at up to 25%, and gains may owe capital-gains tax (a 1031 exchange can defer both). Figures are a year-1 estimate at your 24.0% rate — not tax advice; consult a CPA.
Schools (NCES district)
- District
- West Salem School District
- NCES district ID
- 5516350
- Math proficiency
- 46% ▼ -10.00%
- Reading proficiency
- 43% ▼ -9.00%
- Median HH income
- $66,312
- Composite
- 39.8/100
- National rank
- #3879
- State rank
- #86 of 342 in WI
Livability — West Salem
- Score
- 75/100
- State rank
- #155
- US rank
- #4243
Category grades
Schools grade is shown separately in the Schools card above.
Census & demographics
- Census place
- West Salem, WI
Population outlook (La Crosse County) Hauer SSP2
- Today (2025)
- 126,082 people
- By 2030
- 130,161 · +3.2%
- By 2040
- 137,231 · +8.8%
- By 2050
- 143,506 · +13.8%
- By 2075
- 160,149 · +27.0%
- By 2100
- 166,408 · +32.0%
Not yet ingested
- Political lean
- —
- Race & ethnicity
- —
- Common origin
- —
- Civics
- —
Market trends
- HPI YoY
- —
- Current HPI
- —
- Rent YoY
- —
- Metro
- —
- State GDP YoY
- ▲ 2.10%
- F500 in state
- 20
Industry mix (Fortune 500 HQ in WI)
| Industry | F500 HQs | Revenue |
|---|---|---|
| Industrial Machinery | 4 | $23B |
|
||
| Industrial Technology | 2 | $36B |
|
||
| Insurance | 1 | $36B |
|
||
| Professional Services | 1 | $19B |
|
||
| Utilities | 1 | $9B |
|
||
| Consumer Goods | 1 | $3B |
|
||
Price history
-18.8% since first listed4 events — show timeline
- 2026-01-22 Pending — SCWMLS
- 2026-01-13 Price Changed $65,000 SCWMLS
- 2026-01-06 Price Changed $75,000 SCWMLS
- 2025-12-19 Listed $80,000 SCWMLS
Cash-flow waterfall
monthlySold comps — $/sqft
last 12 mo · ≤1 miLoading sold comps…