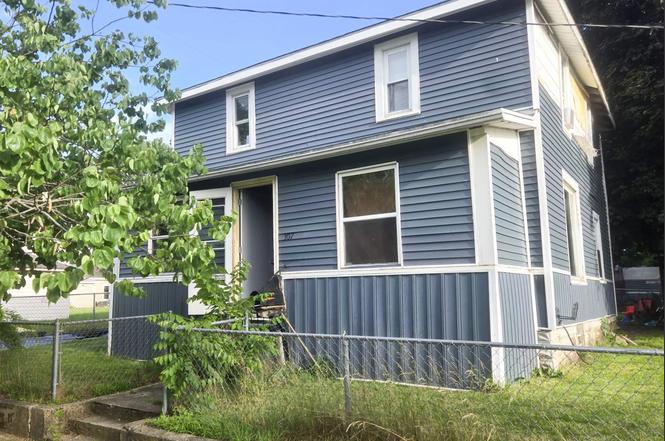
307 Michigan St · Three Rivers, MI
Flood risk 1/10 · Minimal
- FEMA flood zone
- X (unshaded)
- Chance of flooding over 30 yrs
- 0.0%
- Est. flood insurance / yr
- $473 – $860
Fire risk 1/10 · Minimal
- Est. fire insurance / yr
- $784 – $1,456
Heat risk 2/10 · Minimal
- Hot days now (above 101°F)
- 7 days/yr
- Hot days in 30 yrs
- 16 days/yr
Wind risk 2/10 · Minimal
- Chance of severe wind over 30 yrs
- —
Air-quality risk 2/10 · Minimal
- Unhealthy air days now
- 1 days/yr
- Unhealthy air days in 30 yrs
- 2 days/yr
Risk factors via First Street. Map © Google.
Why this score? — see what drove the B+ grade
The composite is a weighted blend of 9 inputs, each scored 0–100. Each bar is that input's sub-score; the figure is the points it added to the 100-point composite (weight × sub-score).
- Cash flow +30.0/30.0
- ARV discount +15.0/15.0
- DSCR +10.0/10.0
- 1% rule +8.8/10.0
- Schools +3.5/10.0
- Livability +3.5/5.0
- Rent growth +2.5/5.0
- Condition / age +2.5/5.0
- Appreciation +0.0/10.0
$89,900
🖨 Deal sheet (PDF) 📄 Offer letter ✓ Due diligence
Listing remarks MLS
PRICE REDUCED! Two Story Traditional Home, 3-Bedrooms 2 Full bath home in the Three Rivers Schools. Central air Fenced front yard, enclosed porch, mudroom off the kitchen. Full Basement and Storage Shed, Small fenced in Area for pet's.
Key facts
- Full basement
- City water
- Spacious lot
Tags
Property features AI
Exterior
- Utilities: Public water; Public sewer available at street; Natural gas
- Home design: Residential property; One-story structure; Built in 1900
- Construction: Aluminum and wood exterior; Basement foundation
- Exterior features: Road frontage
Interior
- Kitchen: Dishwasher; Disposal; Microwave; Range/Oven; Refrigerator
- Bedrooms: Primary bedroom on the first floor (14 x 12); Second bedroom on the second floor (18 x 16); Third bedroom on the second floor (approx. 16 wide)
- Bathrooms: Two full bathrooms (one on the first floor, one on the second floor)
- Heating & cooling: Natural gas heat; Heating system: Other (see remarks)
- Interior features: Basement present
- Laundry & utility: Washer
Neighborhood map
What this means for you Summary
Snapshot
- This is a 3-bed/2.0-bath single-family listed at $90k.
Deal economics
- At list price, monthly cash flow is $370 ($4k/yr) — positive.
- The deal already cash-flows at list — no discount required.
- Meets the 1% rule at list price ($1k rent vs $90k).
- Cap rate 11.2% vs local median 5.2% in Three Rivers — top-decile yield for the area; either an underpriced asset or a hidden risk that comps aren't pricing in. Stress-test before assuming the spread holds.
Location & tenants
- Location reads 70/100 on livability (#306 in MI) — a middle-class / working-renter tenant base. Strengths: cost of living A+, housing A+, health & safety A+; Watch: crime D, amenities F, commute F.
- Three Rivers Community Schools (town): math 37% / reading 45% proficiency, ranked #200 of 540 in MI (top 37%) — families likely to look elsewhere, expect single-tenant / working-renter base with shorter leases.
- Zoned schools: Norton Elementary School (math 62% / reading 52%, grade C+, #236 of 1,397 statewide, top 19%, 262 students, 61% FRL); Three Rivers Middle School (math 30% / reading 40%, grade F, #283 of 493 statewide, top 58%, 537 students, 47% FRL); Three Rivers High School (math 27% / reading 57%, grade F, #264 of 713 statewide, top 41%, 653 students, 44% FRL) — zoned schools at 50% FRL track the district average.
- Market conditions: 181 active listings in the ZIP; 1 comparable units currently listed for rent nearby; 125 units permitted in St. Joseph County in 2024 (0 in 5+ unit buildings).
Forward outlook
- Local home prices are declining (-3.0%/yr); year-one equity from $622 of loan paydown is wiped out by about $3k of value loss. Plan a longer hold.
- St. Joseph County population projected at -16% by 2050 — secular population decline; favor cash flow + early exit over multi-decade hold.
- At projected returns (-3.0% appreciation + 3.0% rent growth), your $25k cash investment doubles in ~7 years — after that, you're playing with house money.
Negotiation context
- Only 4 days on market — expect competitive offers; lowballing is unlikely to land.
- 6 sale attempts since 16y ago with the ask held roughly flat each time — persistent listings suggest the price (not the market) is what's stuck; bring a comps-based counter.
- Current owner paid $46k; list at $90k implies a 93% gain — meaningful room to come down on a strong offer.
Risks & watch-outs
- Watch-outs: built in 1900 — expect roof / HVAC / electrical / plumbing capex.
Questions for the listing agent
- Built in 1900 — when were the roof, HVAC, electrical panel, plumbing, and water heater last replaced?
- Is there a deadline driving the sale (1031 exchange, divorce, estate, relocation)? That informs how much negotiation room exists.
- Schools are D-rated, which usually means shorter tenancies and higher turnover. Who's the typical renter profile here, and what's been the actual vacancy rate?
- Crime grade is D in this area — have there been break-ins, vandalism, or insurance claims at this property in the last 3 years? What carrier currently insures it and at what premium?
- What's the average days-on-market for RENTAL listings here right now (not sales)? A rising rental-DOM trend means longer vacancies and softer asking-rent achievability than the comps imply.
- What's the recent tenant-quality profile in this submarket — average credit score on applications, eviction rate, late-payment / NSF rate, and stable-employment percentage? A property-management company in the area should have these aggregated.
- How much new for-sale + rental construction is in the pipeline within 1–3 miles? Heavy new supply typically softens prices + rents 12–24 months out; constrained supply supports both.
Investment metrics
- 1% rule
- 1.38% ✓
- Cap rate
- 11.23%
- Cash-on-cash
- 17.65%
- DSCR
- 1.79
- GRM
- 6.0
CMA / ARV
- ARV (on-the-fly)
- $174,080
- Comps found
- 12
Show comp detail 12 sales within ~0.75 mi
| Address | Dist | Beds/Ba | Sqft | Sold | Price | $/sf | Match |
|---|---|---|---|---|---|---|---|
| 1016 4th St | 0.11mi | 3/1.5 | 1,357 (-0%) | 7mo | $180,000 | $133 | 86 |
| 919 4th St | 0.16mi | 3/1.0 | 1,304 (-4%) | 2mo | $55,000 | $42 | 79 |
| 1401 Fifth St | 0.16mi | 3/2.0 | 1,312 (-4%) | 15mo | $213,000 | $162 | 74 |
| 1319 S Main St | 0.21mi | 3/1.0 | 1,404 (+3%) | 10mo | $150,000 | $107 | 72 |
| 902 4th St | 0.22mi | 2/1.0 (-1) | 1,410 (+4%) | 9mo | $30,000 | $21 | 67 |
| 906 Seventh St | 0.32mi | 3/2.0 | 1,240 (-9%) | 6mo | $195,000 | $157 | 65 |
| 1209 7th St | 0.23mi | 3/3.0 | 1,501 (+10%) | 6mo | $195,000 | $130 | 63 |
| 1006 Madison St | 0.58mi | 4/1.5 (+1) | 1,400 (+3%) | 9mo | $162,000 | $116 | 54 |
| 809 State St | 0.40mi | 3/1.0 | 1,500 (+10%) | 9mo | $165,000 | $110 | 52 |
| 630 S Lincoln Ave | 0.59mi | 3/1.0 | 1,264 (-7%) | 8mo | $205,000 | $162 | 50 |
| 612 S Hooker Ave | 0.56mi | 4/2.0 (+1) | 1,524 (+12%) | 10mo | $195,000 | $128 | 41 |
| 606 8th St | 0.51mi | 4/2.0 (+1) | 1,531 (+13%) | 13mo | $25,000 | $16 | 39 |
Match score weights: distance 35% · size 25% · config 20% · recency 20%. Top-matched comps best support the ARV.
Projected returns pro-forma
-3.0% appreciation · 3.0% rent growth · sell at horizon
- IRR
- 9.1%
- Equity multiple
- 1.36×
- Total profit
- $9,027
- Equity at exit
- $13,404
- IRR
- 18.3%
- Equity multiple
- 2.52×
- Total profit
- $38,281
- Equity at exit
- $7,773
Cash invested: $25,172 (down + closing). Projections, not guarantees.
Landlord ↔ Tenant lean methodology
- Overall (STATE)
- 62 Landlord-Friendly
- State Michigan
- 62 Landlord-Friendly · EVEN
- County
- — inherits STATE
- City
- — inherits STATE
ZIP-level market 49093
- Active inventory
- 181
- Price-to-rent
- 6.0×
Monthly cashflow live
- Estimated rent
- $1,245 medium interval (Pro) →
- Mortgage (P&I)
- −$471
- Tax from tax record
- −$104 /mo · $1,253/yr
- Insurance
- −$37
- HOA
- −$0
- Vacancy / Maint / Mgmt
- −$261
- Net cashflow
- $370
Break-even live
Sensitivity live
| Price | -10% $421 | -5% $396 | +0% $370 | +5% $345 | +10% $319 |
|---|---|---|---|---|---|
| Rent | -10% $272 | -5% $321 | +0% $370 | +5% $419 | +10% $469 |
| Rate | -1.0pp $416 | -0.5pp $393 | base $370 | +0.5pp $347 | +1.0pp $323 |
UW: 25.0% down · 7.5% · 30yr · 1.5% tax · 5.0% vac · 8.0% maint · 8.0% mgmt
Financing live
Cash to close
- Down payment
- $22,475
- Closing costs
- $2,697
- Reserves months
- —
- Total cash needed
- —
Loan-product check · same deal, 3 products live
Conventional
25% down · 7.5% · 30yr
- Down + closing
- —
- Monthly P&I
- —
- Monthly cashflow
- —
- DSCR
- —
- Eligible?
- —
Personal DTI + credit; lowest rate.
DSCR
20% down · 8.5% · 30yr
- Down + closing
- —
- Monthly P&I
- —
- Monthly cashflow
- —
- DSCR
- —
- Eligible?
- —
No personal income docs; deal must DSCR.
Hard money
10% down · 12.0% · 12mo
- Down + closing
- —
- Monthly P&I
- —
- Monthly cashflow
- —
- DSCR
- —
- Eligible?
- —
Short-term bridge; refi at stabilization.
Rent comps 1 comps
| Address | Beds | Baths | Sqft | Rent | $/sqft | DOM | Units | Dist |
|---|---|---|---|---|---|---|---|---|
| 320 Thomas St Three Rivers, MI | 1.0–2.0 | 1.0–1.5 | 925 | $1,245 | $1.35 | 15d | 4 | 0.53mi |
Listing history 4 events
-
2026-06-21days on market $89,900 Active 4 DOM
-
2026-06-17$89,900 Active 1 DOM
-
2026-06-17remarks 699-char remark
-
2026-06-17$89,900 Active 1 DOM
ⓘ Source: listings_history table (triggers on properties + properties_extension) + one-shot
backfill from property_details.listing_events for pre-trigger history.
Tax reassessment forecast MI · Partial reset (capped growth)
- Current annual tax
- $1,253 · $104/mo
- Projected year-2 tax
- $1,319 · $110/mo
- Expected delta
- +$66/yr (+$5/mo · 5.3%)
ⓘ Screening estimate from a state-policy table — verify with the county assessor before closing.
Climate risk First Street
- Flood 1/10 Low FEMA zone X (unshaded) · 0% chance over 30 yrs
- Wildfire 1/10 Low
- Heat 2/10 Low 7 d/yr ≥101°F today · 16 d/yr by 30 yrs out
- Wind 2/10 Low
- Air quality 2/10 Low 1 unhealthy d/yr today · 2 by 30 yrs out
Nearby sold comps map
Loading sold comps map…
Walkable amenities ~0.75 mi
Loading nearby amenities…
Taxation est. · year 1
- Rental income
- $14,940
- − Mortgage interest
- −$5,036
- − Property taxes
- −$1,253
- − Insurance
- −$450
- − Repairs & maintenance
- −$1,195
- − Management
- −$1,195
- − Depreciation
- −$2,615
- Taxable income
- $3,196
- Est. tax owed @ 24.0%
- −$767
- After-tax cash flow
- $3,676/yr
For passive investors: Depreciation is non-cash, so a rental often shows a tax loss while cash-flowing — sheltering income. Rental losses are passive: they offset passive income freely, and up to $25,000/yr can offset ordinary (W-2) income if you actively participate and your MAGI is under $100k (phasing out to $0 by $150k); unused losses carry forward. On sale, claimed depreciation is recaptured at up to 25%, and gains may owe capital-gains tax (a 1031 exchange can defer both). Figures are a year-1 estimate at your 24.0% rate — not tax advice; consult a CPA.
Schools (NCES district)
- District
- Three Rivers Community Schools
- NCES district ID
- 2633840
- Math proficiency
- 37% ▲ 1.00%
- Reading proficiency
- 45% ▼ -3.00%
- Median HH income
- $46,576
- Composite
- 34.97/100
- National rank
- #5058
- State rank
- #200 of 540 in MI
Livability — Three Rivers
- Score
- 70/100
- State rank
- #306
- US rank
- #7604
Category grades
Schools grade is shown separately in the Schools card above.
Census & demographics
- Census place
- Three Rivers, MI
- Population (ZIP)
- 18,439
Population outlook (St. Joseph County) Hauer SSP2
- Today (2025)
- 58,726 people
- By 2030
- 57,030 · -2.9%
- By 2040
- 53,266 · -9.3%
- By 2050
- 49,343 · -16.0%
- By 2075
- 40,441 · -31.1%
- By 2100
- 31,981 · -45.5%
Race, ethnicity, and origin ACS 2023
- Neighborhood character
- Predominantly White (84%)
- Race & ethnicity
- White 84% Two or more races 8% Hispanic / Latino 5% Black 5%
- Hispanic origin (detail)
- Mexican 4%
- Common ancestry
- Italian 11% Iranian 5% Romanian 3%
- Foreign-born
- 2% · Canada
- Languages at home
- 95% English-only · Spanish 3% Other Indo-European 1%
Political lean MEDSL · St. Joseph
- 2024 margin
- Solid R (+34.0) · D 32.2% · R 66.2% · Other 1.5%
- 2008→2024 swing
- -31.8pp toward R · 2008: -2.2pp · 2024: -34.0pp
- All cycles
- 2024: R+34.0 2020: R+31.7 2016: R+31.0 2012: R+12.3 2008: R+2.2
Not yet ingested
- Civics
- —
Market trends
- HPI YoY
- ▼ -159.07%
- Current HPI
- 226.5079
- Rent YoY
- —
- Metro
- —
- State GDP YoY
- ▲ 1.37%
- F500 in state
- 28
Industry mix (Fortune 500 HQ in MI)
| Industry | F500 HQs | Revenue |
|---|---|---|
| Automotive Parts | 3 | $48B |
|
||
| Automotive | 2 | $372B |
|
||
| Chemicals | 1 | $45B |
|
||
| Automotive Retail | 1 | $29B |
|
||
| Healthcare / Medical Devices | 1 | $23B |
|
||
| Automotive Technology | 1 | $20B |
|
||
Price history
+124.8% since first listed14 events — show timeline
- 2026-06-17 Listed $89,900 MiRealSource-MiMLS
- 2018-08-28 Sold (Public Records) $46,500 Public Records
- 2018-08-27 Sold (MLS) $46,500 SW Michigan MLS
- 2018-08-27 Sold (MLS) $46,500 REALCOMP
- 2018-08-13 Pending — SW Michigan MLS
- 2018-07-03 Price Changed $47,900 SW Michigan MLS
- 2018-05-28 Listed $47,900 MiRealSource-MiMLS
- 2018-05-28 Listed $49,900 SW Michigan MLS
- 2018-05-28 Listed $47,900 REALCOMP
- 2011-07-15 Sold (Public Records) $42,000 Public Records
- 2011-07-11 Sold (MLS) $42,000 REALCOMP
- 2011-07-11 Sold (MLS) $42,000 SW Michigan MLS
- 2010-11-03 Listed $40,000 REALCOMP
- 2010-11-03 Listed $40,000 SW Michigan MLS
Property tax history
+7.8%/yrLatest (2025): $1,253 · -36.9% YoY. Source: county tax records.
Cash-flow waterfall
monthlySold comps — $/sqft
last 12 mo · ≤1 miLoading sold comps…