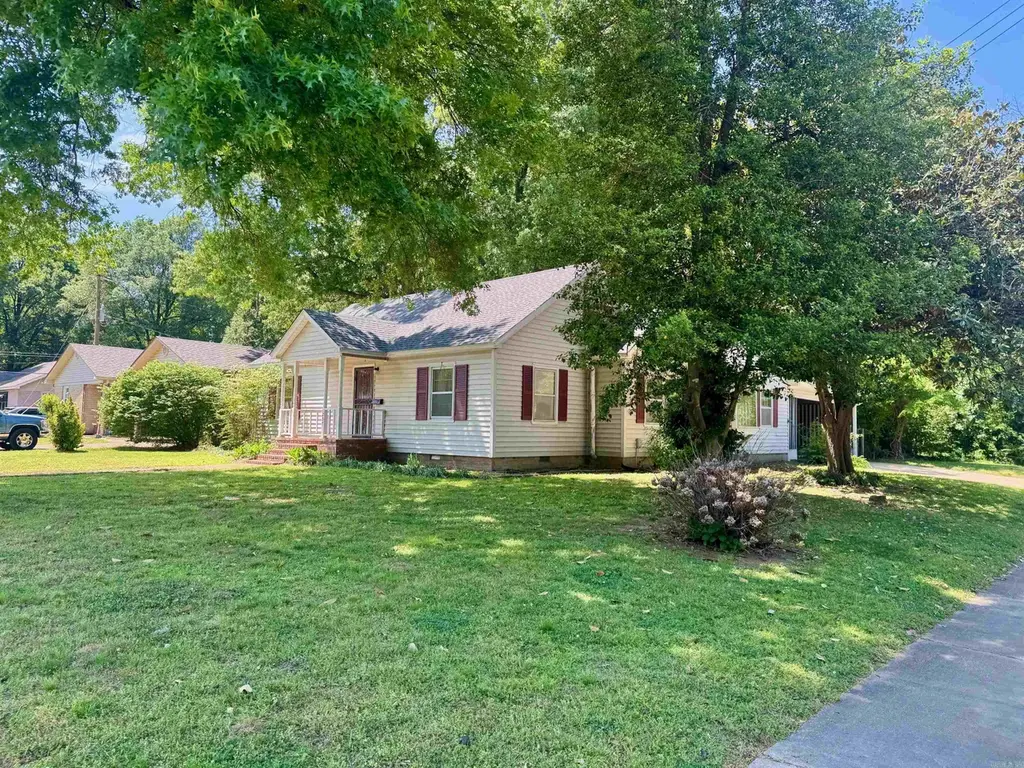
1237 Vine St · Jonesboro, AR
Flood risk 1/10 · Minimal
- FEMA flood zone
- X
- Chance of flooding over 30 yrs
- 0.0%
- Est. flood insurance / yr
- $507 – $1,088
Fire risk 2/10 · Minimal
- Est. fire insurance / yr
- $1,499 – $2,785
Heat risk 5/10 · Moderate
- Hot days now (above 109°F)
- 7 days/yr
- Hot days in 30 yrs
- 20 days/yr
Wind risk 4/10 · Minor
- Chance of severe wind over 30 yrs
- 8.0%
Air-quality risk 1/10 · Minimal
- Unhealthy air days now
- 0 days/yr
- Unhealthy air days in 30 yrs
- 0 days/yr
Risk factors via First Street. Map © Google.
Why this score? — see what drove the D+ grade
The composite is a weighted blend of 9 inputs, each scored 0–100. Each bar is that input's sub-score; the figure is the points it added to the 100-point composite (weight × sub-score).
- Cash flow +14.5/30.0
- ARV discount +12.1/15.0
- DSCR +4.4/10.0
- 1% rule +4.0/10.0
- Rent growth +3.4/5.0
- Livability +3.2/5.0
- Condition / age +2.5/5.0
- Schools +2.3/10.0
- Appreciation +0.0/10.0
$165,000
🖨 Deal sheet (PDF) 📄 Offer letter ✓ Due diligence
Listing remarks MLS
Tired of the cookie cutter new construction homes? This home has character & curb appeal all wrapped up in a nice layout. There are 2 living areas, 2 bedrooms, & a bath on the main & a 3rd bed & bath upstairs with loads of closet space. You will love the cozy deck off the breakfast area. There is also room for either a formal dining room, office. or playroom off of the kitchen. The backyard is fenced and has a metal outbuilding.
Key facts
- Metal outbuilding
- Fenced backyard
- Cozy deck
Tags
Property features AI
Finance
- Other: Annual taxes and tax year available (financial details excluded per instructions)
- Financial info: Financing options include VA, FHA, Conventional loans, cash, and in-house financing
- HOA & community: No area amenities listed
Exterior
- Parking: Carport for 2 cars
- Security: No security features listed
- Utilities: Public sewer; Public water; Municipal electric service (Entergy listed)
- Home design: Brick and frame combination exterior; Listed as unknown year built
- Construction: Crawl space foundation; Architectural shingle roof
- Exterior features: Deck; Porch; Fully fenced yard; Outside storage area; Paved road access; Level corner lot in a subdivision; Inside city limits
Interior
- Kitchen: Free-standing stove; Microwave; Dishwasher; Refrigerator stays
- Bedrooms: No bedroom-specific data provided
- Flooring: Carpet; Vinyl
- Bathrooms: 2 full bathrooms
- Heating & cooling: Central heat (gas); Central cooling (electric)
- Interior features: Washer connection; Dryer connection (electric); Gas and electric water heater options listed; Walk-in closets; Ceiling fans; Wood-burning stove fireplace; Sheetrock and paneling walls/ceilings
- Laundry & utility: Laundry room; Washer and dryer connections
Neighborhood map
What this means for you Summary
Snapshot
- This is a 3-bed/2.0-bath single-family listed at $165k.
Deal economics
- At list price, monthly cash flow is $36 ($426/yr) — positive.
- The deal already cash-flows at list — no discount required.
- To meet the 1% rule (rent ≥ 1% of price), the offer needs to be $149k (9.8% below list).
- Recommended offer: $149k (9.8% below list) — sets the bar for 1% rule.
- Cap rate 6.6% vs local median 4.4% in Jonesboro — top-decile yield for the area; either an underpriced asset or a hidden risk that comps aren't pricing in. Stress-test before assuming the spread holds.
Location & tenants
- Location reads 65/100 on livability (#145 in AR) — a middle-class / working-renter tenant base. Strengths: cost of living A+, housing A+, health & safety A+; Watch: crime F, amenities F, commute F.
- Jonesboro School District (urban): math 28% / reading 28% proficiency, ranked #169 of 238 in AR (top 71%) — low school quality limits family demand, transient renter base, plan for 1-2y turnover; 67% free/reduced lunch — lower-income household profile, screen leases tightly.
- Zoned schools: Kindergarten Center (503 students, 100% FRL); Annie Camp Jr. High School (math 22% / reading 34%, grade F, #150 of 201 statewide, top 76%, 784 students, 100% FRL); The Academies At Jonesboro High School (math 16% / reading 27%, grade F, #225 of 292 statewide, top 78%, 1,386 students, 100% FRL) — zoned schools average 100% FRL vs 67% district-wide (33 pts higher); higher-poverty schools than district average — tighter screening recommended.
- Market conditions: Rents rising (+3.6%/yr); 301 active listings in the ZIP; 926 units permitted in Craighead County in 2024 (69 in 5+ unit buildings).
- This rent runs 39% of the median local income ($45k/yr) — at the standard rent-burdened threshold; future hikes will face affordability resistance.
Forward outlook
- Local home prices are declining (-3.0%/yr); year-one equity from $1k of loan paydown is wiped out by about $5k of value loss. Plan a longer hold.
- Craighead County population projected at +38% by 2050 — long-run rental-demand tailwind backs the buy-and-hold thesis.
Negotiation context
- It's been on market 66 days — a 6% lower offer ($155k) is reasonable based on typical stale-listing flexibility.
- 2 sale attempts; this cycle's ask has dropped $30k (15%) from the opening price — seller is motivated, your offer sets the floor, not the list.
- Current owner paid $2k; list at $165k implies a 8150% gain — meaningful room to come down on a strong offer.
Risks & watch-outs
- Climate carrying-cost: extreme-heat days projected 7→20/yr by 2055 (HVAC capex compounding) — expect insurance premiums to compound above CPI over the hold.
Questions for the listing agent
- It's been on market 66 days. Have you received any prior offers? Is the seller open to a 10% concession, seller financing, or rate buy-down credit?
- Why hasn't it sold? Are there any deal-killer items the seller is aware of (foundation, flood, title, zoning, code violations)?
- Is there a deadline driving the sale (1031 exchange, divorce, estate, relocation)? That informs how much negotiation room exists.
- Schools are D-rated, which usually means shorter tenancies and higher turnover. Who's the typical renter profile here, and what's been the actual vacancy rate?
- Crime grade is F in this area — have there been break-ins, vandalism, or insurance claims at this property in the last 3 years? What carrier currently insures it and at what premium?
- The area grade is low — what's the realistic commute time and amenity access for the typical tenant pool here? Any planned neighborhood developments (good or bad) we should know about?
- What's the average days-on-market for RENTAL listings here right now (not sales)? A rising rental-DOM trend means longer vacancies and softer asking-rent achievability than the comps imply.
- What's the recent tenant-quality profile in this submarket — average credit score on applications, eviction rate, late-payment / NSF rate, and stable-employment percentage? A property-management company in the area should have these aggregated.
- How much new for-sale + rental construction is in the pipeline within 1–3 miles? Heavy new supply typically softens prices + rents 12–24 months out; constrained supply supports both.
Investment metrics
- 1% rule
- 0.90% ✗
- Cap rate
- 6.55%
- Cash-on-cash
- 0.92%
- DSCR
- 1.04
- GRM
- 9.2
CMA / ARV
- ARV (on-the-fly)
- $183,963
- Comps found
- 12
Show comp detail 12 sales within ~0.75 mi
| Address | Dist | Beds/Ba | Sqft | Sold | Price | $/sf | Match |
|---|---|---|---|---|---|---|---|
| 621 W Thomas Ave | 0.33mi | 3/2.0 | 2,035 (-2%) | 2mo | $182,000 | $89 | 81 |
| 1217 Olive St | 0.10mi | 3/2.0 | 1,920 (-7%) | 5mo | $106,000 | $55 | 80 |
| 1313 Nettleton Cir | 0.20mi | 3/2.0 | 2,223 (+8%) | 0mo | $227,000 | $102 | 78 |
| 735 W Oak Ave | 0.25mi | 4/2.0 (+1) | 1,985 (-4%) | 2mo | $56,000 | $28 | 75 |
| 901 Hester St | 0.55mi | 4/2.0 (+1) | 1,920 (-7%) | 0mo | $200,000 | $104 | 57 |
| 1821 James | 0.63mi | 3/2.0 | 1,930 (-7%) | 5mo | $160,000 | $83 | 55 |
| 1809 Alonzo St | 0.49mi | 3/2.0 | 1,802 (-13%) | 4mo | $149,000 | $83 | 52 |
| 503 Vine | 0.51mi | 4/2.0 (+1) | 1,875 (-9%) | 6mo | $199,900 | $107 | 50 |
| 915 W Monroe Ave W | 0.58mi | 3/1.5 | 1,894 (-8%) | 8mo | $112,500 | $59 | 50 |
| 1916 Crestview | 0.65mi | 4/3.0 (+1) | 2,180 (+6%) | 3mo | $229,900 | $105 | 49 |
| 1305 Rosemond | 0.55mi | 3/2.5 | 1,791 (-13%) | 2mo | $199,900 | $112 | 48 |
| 1520 S Main St S | 0.71mi | 2/2.0 (-1) | 1,764 (-15%) | 4mo | $70,000 | $40 | 34 |
Match score weights: distance 35% · size 25% · config 20% · recency 20%. Top-matched comps best support the ARV.
Projected returns pro-forma
-3.0% appreciation · 3.64% rent growth · sell at horizon
- IRR
- -14.1%
- Equity multiple
- 0.49×
- Total profit
- $-23,488
- Equity at exit
- $24,602
- IRR
- -4.3%
- Equity multiple
- 0.71×
- Total profit
- $-13,439
- Equity at exit
- $14,266
Cash invested: $46,200 (down + closing). Projections, not guarantees.
Landlord ↔ Tenant lean methodology
- Overall (STATE)
- 92 Strongly Landlord-Friendly
- State Arkansas
- 92 Strongly Landlord-Friendly · R+14
- County
- — inherits STATE
- City
- — inherits STATE
ZIP-level market 72401
- Home prices YoY
- -34.2%
- Rents YoY
- 3.6%
- Active inventory
- 301
- Price-to-rent
- 9.2×
Monthly cashflow live
- Estimated rent
- $1,488 medium interval (Pro) →
- Mortgage (P&I)
- −$865
- Tax est. 1.5%
- −$206 /mo · $2,475/yr
- Insurance
- −$69
- HOA
- −$0
- Vacancy / Maint / Mgmt
- −$313
- Net cashflow
- $36
Break-even live
Sensitivity live
| Price | -10% $150 | -5% $93 | +0% $36 | +5% $-21 | +10% $-79 |
|---|---|---|---|---|---|
| Rent | -10% $-82 | -5% $-23 | +0% $36 | +5% $94 | +10% $153 |
| Rate | -1.0pp $119 | -0.5pp $77 | base $36 | +0.5pp $-7 | +1.0pp $-51 |
UW: 25.0% down · 7.5% · 30yr · 1.5% tax · 5.0% vac · 8.0% maint · 8.0% mgmt
Financing live
Cash to close
- Down payment
- $41,250
- Closing costs
- $4,950
- Reserves months
- —
- Total cash needed
- —
Loan-product check · same deal, 3 products live
Conventional
25% down · 7.5% · 30yr
- Down + closing
- —
- Monthly P&I
- —
- Monthly cashflow
- —
- DSCR
- —
- Eligible?
- —
Personal DTI + credit; lowest rate.
DSCR
20% down · 8.5% · 30yr
- Down + closing
- —
- Monthly P&I
- —
- Monthly cashflow
- —
- DSCR
- —
- Eligible?
- —
No personal income docs; deal must DSCR.
Hard money
10% down · 12.0% · 12mo
- Down + closing
- —
- Monthly P&I
- —
- Monthly cashflow
- —
- DSCR
- —
- Eligible?
- —
Short-term bridge; refi at stabilization.
Listing history 23 events
-
2026-06-22days on market $165,000 Active 66 DOM
-
2026-06-19days on market $165,000 Active 64 DOM
-
2026-06-18days on market $165,000 Active 63 DOM
-
2026-06-17statusdays on market $165,000 Active 62 DOM
-
2026-06-16days on market $165,000 Price Change 61 DOM
-
2026-06-15days on market $165,000 Price Change 60 DOM
-
2026-06-14days on market $165,000 Price Change 58 DOM
-
2026-06-13pricestatusdays on market $165,000 Price Change 57 DOM
-
2026-06-10days on market $185,000 Active 55 DOM
-
2026-06-09days on market $185,000 Active 54 DOM
-
2026-06-08days on market $185,000 Active 53 DOM
-
2026-06-07days on market $185,000 Active 52 DOM
-
2026-06-05days on market $185,000 Active 49 DOM
-
2026-06-02days on market $185,000 Active 47 DOM
-
2026-06-01days on market $185,000 Active 46 DOM
-
2026-05-31days on market $185,000 Active 45 DOM
-
2026-05-30days on market $185,000 Active 44 DOM
-
2026-05-13price $185,000
-
2026-05-12price $185,000 455-char remark
Show marketing remark (455 chars)
Tired of the cookie cutter new construction homes? This home has character & curb appeal all wrapped up in a nice layout. There are 2 living areas, 2 bedrooms, & a bath on the main & a 3rd bed & bath upstairs with loads of closet space. You will love the cozy deck off the breakfast area. There is also room for either a formal dining room, office. or playroom off of the kitchen. The backyard is fenced and has a metal outbuilding.
-
2026-04-16$195,000 Active 455-char remark
Show marketing remark (455 chars)
Tired of the cookie cutter new construction homes? This home has character & curb appeal all wrapped up in a nice layout. There are 2 living areas, 2 bedrooms, & a bath on the main & a 3rd bed & bath upstairs with loads of closet space. You will love the cozy deck off the breakfast area. There is also room for either a formal dining room, office. or playroom off of the kitchen. The backyard is fenced and has a metal outbuilding.
-
2026-04-15$195,000 New Listing
-
2007-05-11soldstatus $2,000
-
1994-04-13soldstatus $72,000
ⓘ Source: listings_history table (triggers on properties + properties_extension) + one-shot
backfill from property_details.listing_events for pre-trigger history.
Climate risk First Street
- Flood 1/10 Low FEMA zone X · 0% chance over 30 yrs
- Wildfire 2/10 Low
- Heat 5/10 Major 7 d/yr ≥109°F today · 20 d/yr by 30 yrs out
- Wind 4/10 Moderate 8% chance of damaging wind over 30 yrs
- Air quality 1/10 Low 0 unhealthy d/yr today · 0 by 30 yrs out
Nearby sold comps map
Loading sold comps map…
Walkable amenities ~0.75 mi
Loading nearby amenities…
Taxation est. · year 1
- Rental income
- $17,860
- − Mortgage interest
- −$9,243
- − Property taxes
- −$2,475
- − Insurance
- −$825
- − Repairs & maintenance
- −$1,429
- − Management
- −$1,429
- − Depreciation
- −$4,800
- Taxable loss
- −$2,340
- Est. tax savings @ 24.0%
- +$562
- After-tax cash flow
- $988/yr
For passive investors: Depreciation is non-cash, so a rental often shows a tax loss while cash-flowing — sheltering income. Rental losses are passive: they offset passive income freely, and up to $25,000/yr can offset ordinary (W-2) income if you actively participate and your MAGI is under $100k (phasing out to $0 by $150k); unused losses carry forward. On sale, claimed depreciation is recaptured at up to 25%, and gains may owe capital-gains tax (a 1031 exchange can defer both). Figures are a year-1 estimate at your 24.0% rate — not tax advice; consult a CPA.
Schools (NCES district)
- District
- Jonesboro School District
- NCES district ID
- 0508280
- Math proficiency
- 28% ▼ -9.00%
- Reading proficiency
- 28% ▼ -8.00%
- Median HH income
- $34,347
- Composite
- 23.06/100
- National rank
- #7967
- State rank
- #169 of 238 in AR
Livability — Jonesboro
- Score
- 65/100
- State rank
- #145
- US rank
- #12692
Category grades
Schools grade is shown separately in the Schools card above.
Census & demographics
- Census place
- Jonesboro, AR
- County
- Craighead County · 97,185 people
- City population
- 91,245
- Metro
- Jonesboro, AR
- Population (ZIP)
- 42,602
- Household income
- $45,329
- Rent vs Own
- Severe rent burden
- 2606.0
Population outlook (Craighead County) Hauer SSP2
- Today (2025)
- 122,235 people
- By 2030
- 131,338 · +7.4%
- By 2040
- 149,862 · +22.6%
- By 2050
- 168,034 · +37.5%
- By 2075
- 208,094 · +70.2%
- By 2100
- 233,251 · +90.8%
Race, ethnicity, and origin ACS 2023
- Neighborhood character
- Diverse neighborhood (Simpson 0.56)
- Race & ethnicity
- White 60% Black 26% Hispanic / Latino 9% Two or more races 7%
- Hispanic origin (detail)
- Mexican 8%
- Common ancestry
- Slovak 2% Italian 1% Lithuanian 1%
- Foreign-born
- 4% · Canada
- Languages at home
- 92% English-only · Spanish 7%
Political lean MEDSL · Craighead
- 2024 margin
- Solid R (+37.4) · D 30.1% · R 67.5% · Other 2.4%
- 2008→2024 swing
- -12.9pp toward R · 2008: -24.5pp · 2024: -37.4pp
- All cycles
- 2024: R+37.4 2020: R+35.4 2016: R+35.2 2012: R+31.1 2008: R+24.5
Not yet ingested
- Civics
- —
Market trends
- HPI YoY
- ▼ -108.25%
- Current HPI
- 208.2079
- Rent YoY
- ▲ 3.64%
- Metro
- Jonesboro, AR
- State GDP YoY
- ▲ 3.80%
- F500 in state
- 10
Industry mix (Fortune 500 HQ in AR)
| Industry | F500 HQs | Revenue |
|---|---|---|
| Retail | 1 | $681B |
|
||
| Food / Agriculture | 1 | $53B |
|
||
| Retail / Energy | 1 | $22B |
|
||
| Transportation / Logistics | 1 | $12B |
|
||
| Energy | 1 | $4B |
|
||
Price history
+156.9% since first listed6 events — show timeline
- 2026-05-13 Price Changed $185,000 CARMLS
- 2026-05-12 Price Changed $185,000 NEABOR MLS
- 2026-04-16 Listed $195,000 NEABOR MLS
- 2026-04-15 Listed $195,000 CARMLS
- 2007-05-11 Sold (Public Records) $2,000 Public Records
- 1994-04-13 Sold (Public Records) $72,000 Public Records
Property tax history
-10.6%/yrLatest (2025): $91 · -52.3% YoY. Source: county tax records.
Cash-flow waterfall
monthlySold comps — $/sqft
last 12 mo · ≤1 miLoading sold comps…