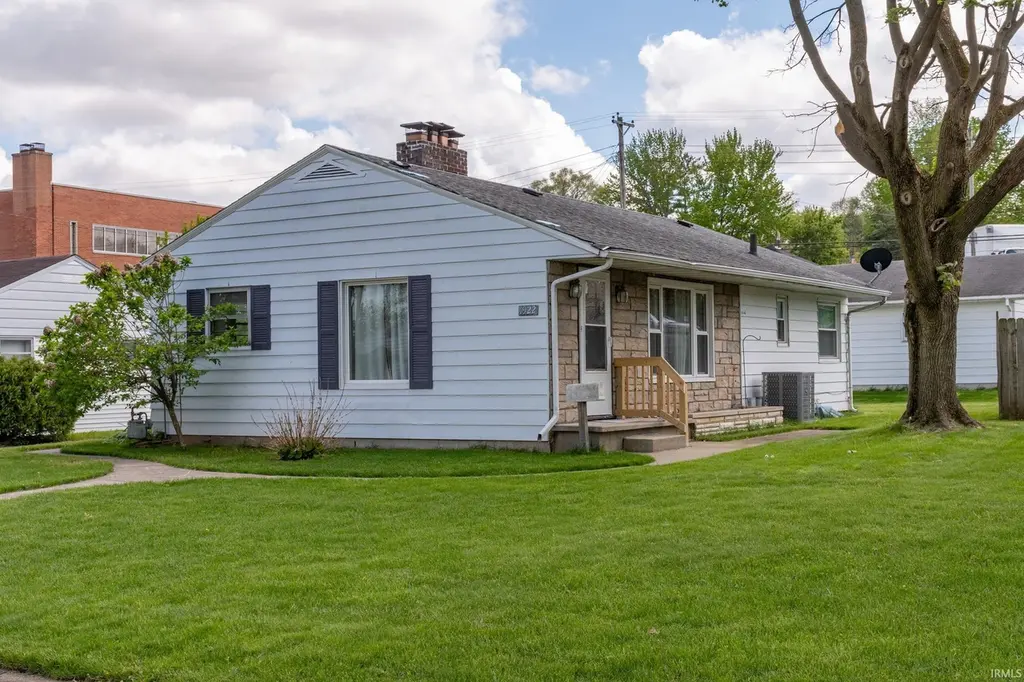
1922 E Fox St · South Bend, IN
Flood risk 1/10 · Minimal
- FEMA flood zone
- X (unshaded)
- Chance of flooding over 30 yrs
- 0.0%
- Est. flood insurance / yr
- $473 – $860
Fire risk 1/10 · Minimal
- Est. fire insurance / yr
- $717 – $1,331
Heat risk 3/10 · Minor
- Hot days now (above 99°F)
- 7 days/yr
- Hot days in 30 yrs
- 16 days/yr
Wind risk 2/10 · Minimal
- Chance of severe wind over 30 yrs
- —
Air-quality risk 3/10 · Minor
- Unhealthy air days now
- 2 days/yr
- Unhealthy air days in 30 yrs
- 3 days/yr
Risk factors via First Street. Map © Google.
Why this score? — see what drove the D+ grade
The composite is a weighted blend of 9 inputs, each scored 0–100. Each bar is that input's sub-score; the figure is the points it added to the 100-point composite (weight × sub-score).
- Cash flow +14.8/30.0
- ARV discount +14.1/15.0
- DSCR +4.5/10.0
- 1% rule +3.8/10.0
- Rent growth +3.5/5.0
- Livability +3.2/5.0
- Condition / age +2.5/5.0
- Schools +1.4/10.0
- Appreciation +0.0/10.0
$154,900
🖨 Deal sheet 📄 Offer letter ✓ Due diligence
Listing remarks MLS
Accepted offer at time of listing.
Key facts
- Main floor laundry
- Full basement
- Two car garage
Tags
Property features AI
Exterior
- Parking: Detached 2-car garage
- Utilities: Public water; Public sewer
- Home design: Single-family residence, site-built; One story; Above-grade finished living area and below-grade finished area present
- Construction: Vinyl siding; Asphalt roof
- Exterior features: Level lot
Interior
- Kitchen: Electric oven and electric range
- Bedrooms: Total of 6 rooms (bedroom count not specified)
- Flooring: Carpet and vinyl flooring
- Bathrooms: One full bathroom and one half bathroom; one main-level bathroom
- Heating & cooling: Natural gas forced-air heating; Central air conditioning
- Interior features: Wood-burning fireplace in family room and living room; one fireplace total; Full unfinished basement
- Laundry & utility: Washer and dryer (laundry on main level); Gas water heater
Neighborhood map
What this means for you Summary
Snapshot
- This is a 3-bed/1.0-bath single-family listed at $155k.
Deal economics
- At list price, monthly cash flow is $42 ($508/yr) — positive.
- The deal already cash-flows at list — no discount required.
- To meet the 1% rule (rent ≥ 1% of price), the offer needs to be $136k (12.4% below list).
- Recommended offer: $136k (12.4% below list) — sets the bar for 1% rule.
- Cap rate 6.6% vs local median 4.4% in South Bend — top-decile yield for the area; either an underpriced asset or a hidden risk that comps aren't pricing in. Stress-test before assuming the spread holds.
Location & tenants
- Location reads 64/100 on livability (#365 in IN) — a middle-class / working-renter tenant base. Strengths: cost of living A+, housing A+, health & safety A+; Watch: amenities D, employment D, crime F.
- South Bend Community School Corporation (urban): math 12% / reading 21% proficiency, ranked #284 of 301 in IN (top 94%) — low school quality limits family demand, transient renter base, plan for 1-2y turnover; 66% free/reduced lunch — lower-income household profile, screen leases tightly.
- Zoned schools: Lincoln Elementary School (math 7% / reading 6%, grade F, #964 of 994 statewide, top 97%, 467 students, 86% FRL); Riley High School (math 19% / reading 46%, grade F, #293 of 369 statewide, top 80%, 992 students, 67% FRL).
- Market conditions: Rents rising fast (+4.1%/yr); 77 active listings in the ZIP; 24 comparable units currently listed for rent nearby; rentals lingering (median 44d on market — plan ~5-8 weeks vacancy on turnover, expect pricing pressure); 50% of comp listings sitting > 30 days — soft ceiling on asking rent; lower-income renter base — watch delinquency; 754 units permitted in St. Joseph County in 2024 (460 in 5+ unit buildings).
- This rent runs 38% of the median local income ($43k/yr) — at the standard rent-burdened threshold; future hikes will face affordability resistance.
Forward outlook
- Local home prices are declining (-3.0%/yr); year-one equity from $1k of loan paydown is wiped out by about $5k of value loss. Plan a longer hold.
Negotiation context
- Only 3 days on market — expect competitive offers; lowballing is unlikely to land.
- 2 sale attempts since 5y ago with the ask held roughly flat each time — persistent listings suggest the price (not the market) is what's stuck; bring a comps-based counter.
Risks & watch-outs
- Watch-outs: built in 1949 — expect roof / HVAC / electrical / plumbing capex.
Questions for the listing agent
- Built in 1949 — when were the roof, HVAC, electrical panel, plumbing, and water heater last replaced?
- Is there a deadline driving the sale (1031 exchange, divorce, estate, relocation)? That informs how much negotiation room exists.
- Schools are F-rated, which usually means shorter tenancies and higher turnover. Who's the typical renter profile here, and what's been the actual vacancy rate?
- Crime grade is F in this area — have there been break-ins, vandalism, or insurance claims at this property in the last 3 years? What carrier currently insures it and at what premium?
- The area grade is low — what's the realistic commute time and amenity access for the typical tenant pool here? Any planned neighborhood developments (good or bad) we should know about?
- What's the average days-on-market for RENTAL listings here right now (not sales)? A rising rental-DOM trend means longer vacancies and softer asking-rent achievability than the comps imply.
- What's the recent tenant-quality profile in this submarket — average credit score on applications, eviction rate, late-payment / NSF rate, and stable-employment percentage? A property-management company in the area should have these aggregated.
- How much new for-sale + rental construction is in the pipeline within 1–3 miles? Heavy new supply typically softens prices + rents 12–24 months out; constrained supply supports both.
Investment metrics
- 1% rule
- 0.88% ✗
- Cap rate
- 6.62%
- Cash-on-cash
- 1.17%
- DSCR
- 1.05
- GRM
- 9.5
CMA / ARV
- ARV (median comp)
- $181,735
- List price
- $154,900
- Delta
- -14.77%
- Verdict
- UNDERPRICED
- Comps
- 20 within 1.0 mi
Show comp detail 12 sales within ~0.75 mi
| Address | Dist | Beds/Ba | Sqft | Sold | Price | $/sf | Match |
|---|---|---|---|---|---|---|---|
| 2611 Delaware St | 0.23mi | 3/1.0 | 936 (-7%) | 1mo | $164,000 | $175 | 77 |
| 2405 Woodmont Dr | 0.16mi | 2/1.0 (-1) | 1,056 (+5%) | 5mo | $122,500 | $116 | 75 |
| 1610 E Donald St | 0.34mi | 2/1.0 (-1) | 1,028 (+2%) | 3mo | $120,000 | $117 | 73 |
| 1804 E Calvert St | 0.24mi | 3/1.0 | 1,104 (+10%) | 2mo | $185,000 | $168 | 72 |
| 2523 Milburn Blvd | 0.35mi | 3/1.0 | 925 (-8%) | 4mo | $155,000 | $168 | 67 |
| 2536 Milburn Blvd | 0.35mi | 2/1.0 (-1) | 900 (-11%) | 0mo | $130,000 | $144 | 60 |
| 1917 Panama St | 0.70mi | 3/1.0 | 936 (-7%) | 2mo | $175,000 | $187 | 54 |
| 2909 Hilltop Dr | 0.55mi | 3/1.0 | 1,124 (+12%) | 3mo | $189,900 | $169 | 53 |
| 2828 Southridge Dr | 0.53mi | 3/1.0 | 1,140 (+13%) | 2mo | $215,000 | $189 | 52 |
| 1009 Somerset Ave | 0.46mi | 2/1.0 (-1) | 1,146 (+14%) | 0mo | $174,900 | $153 | 51 |
| 1714 S Twyckenham Dr | 0.54mi | 2/1.0 (-1) | 870 (-14%) | 1mo | $91,000 | $105 | 46 |
| 1340 E Calvert St | 0.60mi | 2/1.0 (-1) | 888 (-12%) | 3mo | $65,500 | $74 | 45 |
Match score weights: distance 35% · size 25% · config 20% · recency 20%. Top-matched comps best support the ARV.
Projected returns pro-forma
-3.0% appreciation · 4.08% rent growth · sell at horizon
- IRR
- -13.3%
- Equity multiple
- 0.52×
- Total profit
- $-20,919
- Equity at exit
- $23,096
- IRR
- -2.8%
- Equity multiple
- 0.80×
- Total profit
- $-8,512
- Equity at exit
- $13,393
Cash invested: $43,372 (down + closing). Projections, not guarantees.
Landlord ↔ Tenant lean methodology
- Overall (STATE)
- 90 Strongly Landlord-Friendly
- State Indiana
- 90 Strongly Landlord-Friendly · R+11
- County
- — inherits STATE
- City
- — inherits STATE
ZIP-level market 46613
- Home prices YoY
- -7.2%
- Rents YoY
- 4.1%
- Active inventory
- 77
- Price-to-rent
- 9.5×
Monthly cashflow live
- Estimated rent
- $1,357 high interval (Pro) →
- Mortgage (P&I)
- −$812
- Tax from tax record
- −$153 /mo · $1,833/yr
- Insurance
- −$65
- HOA
- −$0
- Vacancy / Maint / Mgmt
- −$285
- Net cashflow
- $42
Break-even live
UW: 25.0% down · 7.5% · 30yr · 1.5% tax · 5.0% vac · 8.0% maint · 8.0% mgmt
Financing live
Cash to close
- Down payment
- $38,725
- Closing costs
- $4,647
- Reserves months
- —
- Total cash needed
- —
Loan-product check · same deal, 3 products live
Conventional
25% down · 7.5% · 30yr
- Down + closing
- —
- Monthly P&I
- —
- Monthly cashflow
- —
- DSCR
- —
- Eligible?
- —
Personal DTI + credit; lowest rate.
DSCR
20% down · 8.5% · 30yr
- Down + closing
- —
- Monthly P&I
- —
- Monthly cashflow
- —
- DSCR
- —
- Eligible?
- —
No personal income docs; deal must DSCR.
Hard money
10% down · 12.0% · 12mo
- Down + closing
- —
- Monthly P&I
- —
- Monthly cashflow
- —
- DSCR
- —
- Eligible?
- —
Short-term bridge; refi at stabilization.
Rent comps 24 comps
| Address | Beds | Baths | Sqft | Rent | $/sqft | DOM | Units | Dist |
|---|---|---|---|---|---|---|---|---|
| 2804 Delaware St Mishawaka, IN | 2.0 | 1.0 | 720 | $1,200 | $1.67 | 13d | 1 | 0.14mi |
| 1701 E Donald St South Bend, IN | 2.0 | 1.0 | 720 | $1,075 | $1.49 | 43d | 1 | 0.27mi |
| 1729 E Calvert St South Bend, IN | 3.0 | 1.0 | 900 | $1,300 | $1.44 | 43d | 1 | 0.30mi |
| 1218 S 26th St South Bend, IN | 3.0 | 1.0 | 856 | $1,400 | $1.64 | 13d | 1 | 0.77mi |
| 1106 S 20th St South Bend, IN | 1.0–3.0 | 1.0–2.0 | 885 | $1,200 | $1.36 | 13d | 1 | 0.77mi |
| 1912 Miami St Unit 1912 South Bend, IN | 3.0 | 1.5 | 1300 | $1,400 | $1.08 | 43d | 1 | 0.93mi |
| 1149 E Indiana Ave South Bend, IN | 4.0 | 2.0 | 1344 | $1,200 | $0.89 | 13d | 1 | 0.95mi |
| 1126 E Broadway St South Bend, IN | 4.0 | 2.0 | 1492 | $1,365 | $0.91 | 21d | 1 | 1.04mi |
| 819 S 24th St South Bend, IN | 3.0 | 2.0 | 1480 | $1,795 | $1.21 | 43d | 1 | 1.05mi |
| 909 E Fairview Ave South Bend, IN | 3.0 | 1.0 | 1128 | $1,450 | $1.29 | 43d | 1 | 1.09mi |
| 754 S 23rd St South Bend, IN | 3.0 | 1.0 | 884 | $1,300 | $1.47 | 43d | 1 | 1.10mi |
| 821 E Fairview Ave South Bend, IN | 3.0 | 1.0 | 1248 | $1,399 | $1.12 | 43d | 1 | 1.13mi |
| 2114 High St South Bend, IN | 3.0 | 1.0 | 949 | $1,300 | $1.37 | 43d | 1 | 1.14mi |
| 3530 Northside Blvd South Bend, IN | 1.0–2.0 | 1.0 | 850 | $1,200 | $1.41 | 13d | 1 | 1.17mi |
| 2032 Southern Vw Unit 1a South Bend, IN | 2.0 | 1.0 | 1000 | $1,200 | $1.20 | 13d | 1 | 1.19mi |
| 211 Columbia St Mishawaka, IN | 4.0 | 2.5 | 1500 | $1,795 | $1.20 | 21d | 1 | 1.20mi |
| 1006 S 35th St South Bend, IN | 3.0 | 2.0 | 816 | $1,000 | $1.23 | 13d | 1 | 1.25mi |
| 4245 Irish Hills Dr South Bend, IN | 1.0–2.0 | 1.0–1.5 | 739 | $1,436 | $1.94 | 13d | 77 | 1.25mi |
| 737 S 30th St South Bend, IN | 3.0 | 2.0 | 1000 | $1,600 | $1.60 | 43d | 1 | 1.26mi |
| 922 Ridgedale Rd South Bend, IN | 2.0 | 1.0 | 864 | $1,200 | $1.39 | 13d | 1 | 1.29mi |
| 526 S 28th St South Bend, IN | 2.0 | 1.0 | 1000 | $1,350 | $1.35 | 13d | 1 | 1.37mi |
| 1007 E Chippewa Ave South Bend, IN | 3.0 | 1.0 | 1344 | $1,399 | $1.04 | 43d | 1 | 1.39mi |
| 525 E Eckman St South Bend, IN | 3.0 | 1.0 | 1400 | $1,500 | $1.07 | 43d | 1 | 1.41mi |
| 427 S 27th St South Bend, IN | 2.0 | 1.0 | 840 | $950 | $1.13 | 43d | 1 | 1.43mi |
Listing history 4 events
-
2026-05-06status Pending 650-char remark
-
2026-05-03$154,900 Active 650-char remark
-
2021-08-20soldstatus $125,000 34-char remark
Show marketing remark (34 chars)
Accepted offer at time of listing.
-
2021-07-20$125,000 34-char remark
Show marketing remark (34 chars)
Accepted offer at time of listing.
ⓘ Source: listings_history table (triggers on properties + properties_extension) + one-shot
backfill from property_details.listing_events for pre-trigger history.
Tax reassessment forecast IN · Partial reset (capped growth)
- Current annual tax
- $1,833 · $153/mo
- Projected year-2 tax
- $1,833 · $153/mo
- Expected delta
- $0/yr ($0/mo · 0.0%)
ⓘ Screening estimate from a state-policy table — verify with the county assessor before closing.
Climate risk First Street
- Flood 1/10 Low FEMA zone X (unshaded) · 0% chance over 30 yrs
- Wildfire 1/10 Low
- Heat 3/10 Moderate 7 d/yr ≥99°F today · 16 d/yr by 30 yrs out
- Wind 2/10 Low
- Air quality 3/10 Moderate 2 unhealthy d/yr today · 3 by 30 yrs out
Nearby sold comps map
Loading sold comps map…
Walkable amenities ~0.75 mi
Loading nearby amenities…
Taxation est. · year 1
- Rental income
- $16,283
- − Mortgage interest
- −$8,677
- − Property taxes
- −$1,833
- − Insurance
- −$774
- − Repairs & maintenance
- −$1,303
- − Management
- −$1,303
- − Depreciation
- −$4,506
- Taxable loss
- −$2,113
- Est. tax savings @ 24.0%
- +$507
- After-tax cash flow
- $1,015/yr
For passive investors: Depreciation is non-cash, so a rental often shows a tax loss while cash-flowing — sheltering income. Rental losses are passive: they offset passive income freely, and up to $25,000/yr can offset ordinary (W-2) income if you actively participate and your MAGI is under $100k (phasing out to $0 by $150k); unused losses carry forward. On sale, claimed depreciation is recaptured at up to 25%, and gains may owe capital-gains tax (a 1031 exchange can defer both). Figures are a year-1 estimate at your 24.0% rate — not tax advice; consult a CPA.
Schools (NCES district)
- District
- South Bend Community School Corporation
- NCES district ID
- 1810290
- Math proficiency
- 12% ▼ -10.00%
- Reading proficiency
- 21% ▼ -6.00%
- Median HH income
- $41,935
- Composite
- 14.21/100
- National rank
- #9452
- State rank
- #284 of 301 in IN
Livability — South Bend
- Score
- 64/100
- State rank
- #365
- US rank
- #13730
Category grades
Schools grade is shown separately in the Schools card above.
Census & demographics
- Census place
- South Bend, IN
- County
- Saint Joseph County · 189,048 people
- City population
- 99,767
- Metro
- South Bend-Mishawaka, IN-MI
- Population (ZIP)
- 12,279
- Household income
- $42,537
- Rent vs Own
- Severe rent burden
- 545.0
Population outlook (St. Joseph County) Hauer SSP2
- Today (2025)
- 273,186 people
- By 2030
- 273,594 · +0.1%
- By 2040
- 271,641 · -0.6%
- By 2050
- 269,187 · -1.5%
- By 2075
- 263,136 · -3.7%
- By 2100
- 245,659 · -10.1%
Race, ethnicity, and origin ACS 2023
- Neighborhood character
- Highly diverse neighborhood (Simpson 0.72)
- Race & ethnicity
- White 41% Hispanic / Latino 24% Black 23% Two or more races 22% Asian 2% Native American 1%
- Hispanic origin (detail)
- Mexican 22%
- Common ancestry
- Romanian 4% Italian 1% Slovak 1%
- Foreign-born
- 9% · Canada, Philippines
- Languages at home
- 81% English-only · Spanish 17% Other Asian/Pacific 1%
Political lean MEDSL · St. Joseph
- 2024 margin
- Toss-up / Even · D 50.0% · R 48.5% · Other 1.5%
- 2008→2024 swing
- -15.6pp toward R · 2008: 17.1pp · 2024: 1.5pp
- All cycles
- 2024: D+1.5 2020: D+5.8 2016: D+0.2 2012: D+3.5 2008: D+17.1
Not yet ingested
- Civics
- —
Market trends
- HPI YoY
- ▼ -20.88%
- Current HPI
- 270.0303
- Rent YoY
- ▲ 4.08%
- Metro
- South Bend-Mishawaka, IN-MI
- State GDP YoY
- ▲ 2.90%
- F500 in state
- 18
Industry mix (Fortune 500 HQ in IN)
| Industry | F500 HQs | Revenue |
|---|---|---|
| Industrial Machinery | 2 | $37B |
|
||
| Healthcare | 1 | $177B |
|
||
| Pharmaceuticals | 1 | $45B |
|
||
| Metals / Steel | 1 | $18B |
|
||
| Agriculture | 1 | $17B |
|
||
| Packaging | 1 | $12B |
|
||
Price history
+28.4% since first listed5 events — show timeline
- 2026-06-04 Sold (MLS) $160,500 IRMLS
- 2026-05-06 Pending — IRMLS
- 2026-05-03 Listed $154,900 IRMLS
- 2021-08-20 Sold (MLS) $125,000 IRMLS
- 2021-07-20 Listed $125,000 IRMLS
Property tax history
+10.1%/yrLatest (2025): $1,833 · +17.8% YoY. Source: county tax records.
Cash-flow waterfall
monthlySold comps — $/sqft
last 12 mo · ≤1 miLoading sold comps…