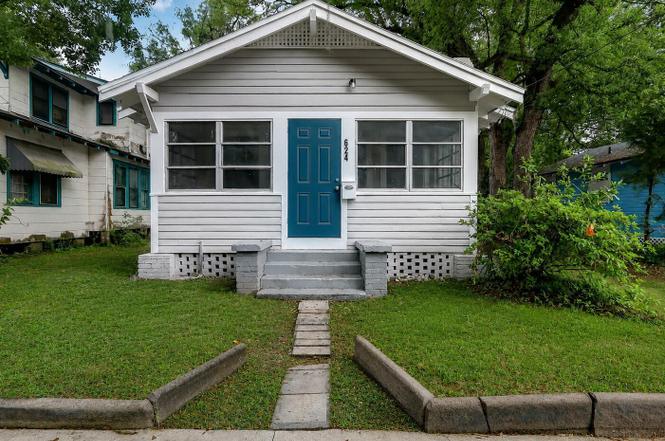
624 Fern St · Jacksonville, FL
Flood risk 1/10 · Minimal
- FEMA flood zone
- X (unshaded)
- Chance of flooding over 30 yrs
- 0.0%
- Est. flood insurance / yr
- $507 – $1,088
Fire risk 1/10 · Minimal
- Est. fire insurance / yr
- $947 – $1,759
Heat risk 9/10 · Severe
- Hot days now (above 107°F)
- 7 days/yr
- Hot days in 30 yrs
- 20 days/yr
Wind risk 9/10 · Severe
- Chance of severe wind over 30 yrs
- 99.0%
Air-quality risk 4/10 · Minor
- Unhealthy air days now
- 6 days/yr
- Unhealthy air days in 30 yrs
- 6 days/yr
Risk factors via First Street. Map © Google.
Why this score? — see what drove the D+ grade
The composite is a weighted blend of 9 inputs, each scored 0–100. Each bar is that input's sub-score; the figure is the points it added to the 100-point composite (weight × sub-score).
- Cash flow +19.9/30.0
- DSCR +6.3/10.0
- 1% rule +4.9/10.0
- Livability +4.2/5.0
- ARV discount +3.9/15.0
- Schools +3.9/10.0
- Rent growth +2.7/5.0
- Condition / age +2.5/5.0
- Appreciation +0.0/10.0
$120,000
🖨 Deal sheet 📄 Offer letter ✓ Due diligence
Listing remarks MLS
BEAUTIFUL INVESTMENT HOME. CLOSE TO TRANSPORTATION, SHOPPING AND MORE. A DIAMOND IN THE ROUGH.
Key facts
- 2018 roof
- 0.12-acre lot
- Space for parking
Tags
Property features AI
Exterior
- Parking: Off-street parking; On-street parking
- Utilities: Public sewer; Electricity connected; Sewer connected; Water connected
- Home design: Single-family residence; One level; Entry on level 1
- Construction: Frame construction with wood siding; Shingle roof
- Exterior features: Covered front porch; Glass-enclosed porch; Shed(s)
Interior
- Kitchen: Electric range
- Bedrooms: 3 bedrooms
- Flooring: Carpet; Vinyl
- Bathrooms: 2 full bathrooms
- Heating & cooling: Central heating (electric); Central air conditioning (electric)
- Interior features: Eat-in kitchen; Pantry; Primary bathroom with tub and shower
- Laundry & utility: Washer hookup; Electric dryer hookup; In-unit laundry
Neighborhood map
What this means for you Summary
Snapshot
- This is a 2-bed/2.0-bath single-family listed at $120k.
Deal economics
- At list price, monthly cash flow is $146 ($2k/yr) — positive.
- The deal already cash-flows at list — no discount required.
- To meet the 1% rule (rent ≥ 1% of price), the offer needs to be $119k (1.1% below list).
- Recommended offer: $106k (12.0% below list) — sets the bar for market timing.
- Cap rate 7.8% vs local median 4.0% in Jacksonville — top-decile yield for the area; either an underpriced asset or a hidden risk that comps aren't pricing in. Stress-test before assuming the spread holds.
Location & tenants
- Location reads 83/100 on livability (#50 in FL, #911 nationally) — a professional / high-income tenant draw. Strengths: amenities A+, commute A+, housing A+.
- Duval (urban): math 46% / reading 45% proficiency, ranked #48 of 73 in FL (top 66%) — families likely to look elsewhere, expect single-tenant / working-renter base with shorter leases.
- Market conditions: Rents flat; 194 active listings in the ZIP; 40 comparable units currently listed for rent nearby; rentals at typical pace (median 24d on market — plan ~3-4 weeks tenant-placement turnaround); lower-income renter base — watch delinquency; 6,503 units permitted in Duval County in 2024 (1,131 in 5+ unit buildings).
- This rent runs 36% of the median local income ($39k/yr) — at the standard rent-burdened threshold; future hikes will face affordability resistance.
Forward outlook
- Local home prices are declining (-3.0%/yr); year-one equity from $830 of loan paydown is wiped out by about $4k of value loss. Plan a longer hold.
- Duval County population projected at +19% by 2050 — long-run rental-demand tailwind backs the buy-and-hold thesis.
Negotiation context
- It's been on market 141 days — a 12% lower offer ($106k) is reasonable based on typical stale-listing flexibility.
- 7 sale attempts since 15y ago; this cycle's ask is 20% above the opening price — seller raised mid-cycle; expect resistance to lowballs.
Risks & watch-outs
- Watch-outs: built in 1938 — expect roof / HVAC / electrical / plumbing capex.
- Climate carrying-cost: severe wind risk, 99% chance of damaging wind over 30y; extreme-heat days projected 7→20/yr by 2055 (HVAC capex compounding) — expect insurance premiums to compound above CPI over the hold.
Questions for the listing agent
- It's been on market 141 days. Have you received any prior offers? Is the seller open to a 12% concession, seller financing, or rate buy-down credit?
- Built in 1938 — when were the roof, HVAC, electrical panel, plumbing, and water heater last replaced?
- Why hasn't it sold? Are there any deal-killer items the seller is aware of (foundation, flood, title, zoning, code violations)?
- Is there a deadline driving the sale (1031 exchange, divorce, estate, relocation)? That informs how much negotiation room exists.
- Schools are B-rated — typically a magnet for longer-tenancy family renters. What's the average tenant stay here, and is there a school-zone premium baked into asking?
- The area grade is low — what's the realistic commute time and amenity access for the typical tenant pool here? Any planned neighborhood developments (good or bad) we should know about?
- What's the average days-on-market for RENTAL listings here right now (not sales)? A rising rental-DOM trend means longer vacancies and softer asking-rent achievability than the comps imply.
- What's the recent tenant-quality profile in this submarket — average credit score on applications, eviction rate, late-payment / NSF rate, and stable-employment percentage? A property-management company in the area should have these aggregated.
- How much new for-sale + rental construction is in the pipeline within 1–3 miles? Heavy new supply typically softens prices + rents 12–24 months out; constrained supply supports both.
Investment metrics
- 1% rule
- 0.99% ✗
- Cap rate
- 7.75%
- Cash-on-cash
- 5.21%
- DSCR
- 1.23
- GRM
- 8.4
CMA / ARV
- ARV (on-the-fly)
- $111,210
- Comps found
- 12
Show comp detail 12 sales within ~0.75 mi
| Address | Dist | Beds/Ba | Sqft | Sold | Price | $/sf | Match |
|---|---|---|---|---|---|---|---|
| 4562 Notter Ave | 0.12mi | 3/2.0 (+1) | 1,052 (+4%) | 4mo | $139,000 | $132 | 79 |
| 334 Birch St | 0.39mi | 3/1.0 (+1) | 1,008 (-0%) | 4mo | $50,000 | $50 | 69 |
| 429 W 46th St | 0.54mi | 2/1.0 | 1,020 (+1%) | 2mo | $167,000 | $164 | 68 |
| 28 W 35th St | 0.45mi | 3/1.5 (+1) | 1,034 (+2%) | 4mo | $110,000 | $106 | 65 |
| 625 W 46th St | 0.53mi | 2/1.0 | 1,031 (+2%) | 5mo | $40,000 | $39 | 64 |
| 705 Oak Arbor Cir | 0.43mi | 3/2.0 (+1) | 1,094 (+8%) | 1mo | $160,000 | $146 | 61 |
| 4808 Silver St | 0.35mi | 3/1.0 (+1) | 1,120 (+11%) | 1mo | $135,000 | $121 | 56 |
| 733 Escambia St | 0.66mi | 3/1.0 (+1) | 975 (-4%) | 0mo | $90,000 | $92 | 54 |
| 569 W 49th St | 0.56mi | 2/1.0 | 924 (-9%) | 2mo | $57,000 | $62 | 54 |
| 557 Chestnut Dr | 0.61mi | 2/1.0 | 943 (-7%) | 4mo | $125,000 | $133 | 53 |
| 1004 W 26th St | 0.71mi | 3/1.0 (+1) | 936 (-7%) | 2mo | $102,500 | $110 | 44 |
| 1125 W 29th St | 0.74mi | 3/1.0 (+1) | 864 (-14%) | 4mo | $73,000 | $84 | 29 |
Match score weights: distance 35% · size 25% · config 20% · recency 20%. Top-matched comps best support the ARV.
Projected returns pro-forma
-3.0% appreciation · 0.94% rent growth · sell at horizon
- IRR
- -10.5%
- Equity multiple
- 0.63×
- Total profit
- $-12,572
- Equity at exit
- $17,892
- IRR
- -4.2%
- Equity multiple
- 0.75×
- Total profit
- $-8,501
- Equity at exit
- $10,375
Cash invested: $33,600 (down + closing). Projections, not guarantees.
Landlord ↔ Tenant lean methodology
- Overall (STATE)
- 87 Strongly Landlord-Friendly
- State Florida
- 87 Strongly Landlord-Friendly · R+3
- County
- — inherits STATE
- City
- — inherits STATE
ZIP-level market 32206
- Home prices YoY
- -23.7%
- Rents YoY
- 0.9%
- Active inventory
- 194
- Price-to-rent
- 8.4×
Monthly cashflow live
- Estimated rent
- $1,187 high interval (Pro) →
- Mortgage (P&I)
- −$629
- Tax from tax record
- −$113 /mo · $1,354/yr
- Insurance
- −$50
- HOA
- −$0
- Vacancy / Maint / Mgmt
- −$249
- Net cashflow
- $146
Break-even live
UW: 25.0% down · 7.5% · 30yr · 1.5% tax · 5.0% vac · 8.0% maint · 8.0% mgmt
Financing live
Cash to close
- Down payment
- $30,000
- Closing costs
- $3,600
- Reserves months
- —
- Total cash needed
- —
Loan-product check · same deal, 3 products live
Conventional
25% down · 7.5% · 30yr
- Down + closing
- —
- Monthly P&I
- —
- Monthly cashflow
- —
- DSCR
- —
- Eligible?
- —
Personal DTI + credit; lowest rate.
DSCR
20% down · 8.5% · 30yr
- Down + closing
- —
- Monthly P&I
- —
- Monthly cashflow
- —
- DSCR
- —
- Eligible?
- —
No personal income docs; deal must DSCR.
Hard money
10% down · 12.0% · 12mo
- Down + closing
- —
- Monthly P&I
- —
- Monthly cashflow
- —
- DSCR
- —
- Eligible?
- —
Short-term bridge; refi at stabilization.
Rent comps 40 comps
| Address | Beds | Baths | Sqft | Rent | $/sqft | DOM | Units | Dist |
|---|---|---|---|---|---|---|---|---|
| 643 Linwood Ave Jacksonville, FL | 3.0 | 2.0 | 1232 | $1,325 | $1.08 | 2d | 1 | 0.11mi |
| 666 Basswood St Jacksonville, FL | 3.0 | 1.0 | 1002 | $1,400 | $1.40 | 23d | 1 | 0.14mi |
| 451 Long Branch Blvd Unit 451 Jacksonville, FL | 2.0 | 1.0 | 1000 | $1,350 | $1.35 | 23d | 1 | 0.16mi |
| 511 Ivy St Jacksonville, FL | 2.0 | 1.0 | 900 | $995 | $1.11 | 23d | 1 | 0.19mi |
| 4721 E Castlewood Dr Jacksonville, FL | 3.0 | 1.0 | 1008 | $1,250 | $1.24 | 23d | 1 | 0.19mi |
| 3914 Springfield Blvd Jacksonville, FL | 2.0 | 1.0 | 858 | $1,050 | $1.22 | 23d | 1 | 0.22mi |
| 3914 Springfield Blvd Jacksonville, FL | 2.0 | 1.0 | 858 | $1,050 | $1.22 | 4d | 1 | 0.22mi |
| 3927 Notter Ave Jacksonville, FL | 2.0 | 1.0 | 738 | $850 | $1.15 | 21d | 1 | 0.23mi |
| 3927 Notter Ave Jacksonville, FL | 2.0 | 1.0 | 738 | $850 | $1.15 | 13d | 1 | 0.23mi |
| 326 Basswood St Jacksonville, FL | 3.0 | 2.0 | 1317 | $1,550 | $1.18 | 23d | 1 | 0.28mi |
| 4918 N Pearl St Jacksonville, FL | 2.0 | 1.0 | 850 | $895 | $1.05 | 23d | 1 | 0.29mi |
| 3732 Lehigh St Jacksonville, FL | 2.0 | 1.0 | 850 | $900 | $1.06 | 14d | 1 | 0.38mi |
| 3730 Lehigh St Unit 3730 Jacksonville, FL | 2.0 | 1.0 | 850 | $900 | $1.06 | 14d | 1 | 0.38mi |
| 154 W 28th St Jacksonville, FL | 2.0 | 2.0 | 818 | $1,138 | $1.39 | 17d | 1 | 0.43mi |
| 849 W 30th St Apt 3 Jacksonville, FL | 2.0 | 1.0 | 750 | $965 | $1.29 | 23d | 1 | 0.43mi |
| 22 W 38th St Jacksonville, FL | 2.0 | 1.0 | 800 | $1,100 | $1.38 | 23d | 1 | 0.47mi |
| 118 W 28th St Jacksonville, FL | 3.0 | 2.0 | 1332 | $1,250 | $0.94 | 23d | 1 | 0.47mi |
| 3728 Silver St Jacksonville, FL | 2.0 | 1.0 | 916 | $1,100 | $1.20 | 23d | 1 | 0.48mi |
| 5514 Long St Jacksonville, FL | 2.0 | 1.0 | 941 | $1,250 | $1.33 | 1d | 1 | 0.48mi |
| 528 W 25th St Jacksonville, FL | 2.0 | 1.0 | 944 | $1,100 | $1.17 | 23d | 1 | 0.51mi |
| 141 W 43rd St Jacksonville, FL | 3.0 | 2.0 | 1022 | $1,231 | $1.20 | 2d | 1 | 0.53mi |
| 5616 Calvin Ave Jacksonville, FL | 3.0 | 1.0 | 1008 | $1,195 | $1.19 | 7d | 1 | 0.54mi |
| 562 W 49th St Jacksonville, FL | 3.0 | 1.0 | 1091 | $1,195 | $1.10 | 23d | 1 | 0.57mi |
| 539 W 23rd St #3 Jacksonville, FL | 1.0 | 1.0 | 795 | $775 | $0.97 | 23d | 1 | 0.58mi |
| 347 W 23rd St Jacksonville, FL | 3.0 | 1.5 | 1176 | $1,112 | $0.95 | 7d | 1 | 0.59mi |
| 425 W 47th St Jacksonville, FL | 3.0 | 1.5 | 1083 | $1,193 | $1.10 | 7d | 1 | 0.62mi |
| 18 W 43rd St Jacksonville, FL | 2.0 | 1.0 | 750 | $795 | $1.06 | 4d | 1 | 0.62mi |
| 5035 N Main St Jacksonville, FL | 3.0 | 1.0–2.0 | 816 | $1,181 | $1.45 | 23d | 69 | 0.64mi |
| 204 W 23rd St Jacksonville, FL | 3.0 | 1.0 | 960 | $1,225 | $1.28 | 1d | 1 | 0.65mi |
| 916 W 25th St Jacksonville, FL | 2.0 | 1.0 | 816 | $1,025 | $1.26 | 17d | 1 | 0.66mi |
| 134 W 23rd St Jacksonville, FL | 2.0 | 1.0 | 768 | $1,050 | $1.37 | 23d | 1 | 0.66mi |
| 3902 Stuart St Jacksonville, FL | 2.0 | 2.0 | 1114 | $1,050 | $0.94 | 23d | 1 | 0.67mi |
| 664 Escambia St Jacksonville, FL | 3.0 | 2.0 | 1352 | $1,500 | $1.11 | 17d | 1 | 0.68mi |
| 646 Escambia St Jacksonville, FL | 3.0 | 2.0 | 1200 | $1,395 | $1.16 | 21d | 1 | 0.68mi |
| 319 W 49th St Jacksonville, FL | 2.0 | 1.0 | 977 | $1,200 | $1.23 | 23d | 1 | 0.69mi |
| 1031 W 26th St Jacksonville, FL | 3.0 | 2.0 | 1261 | $1,445 | $1.15 | 23d | 1 | 0.70mi |
| 34 W 23rd St Jacksonville, FL | 3.0 | 1.5 | 962 | $1,400 | $1.46 | 23d | 1 | 0.70mi |
| 522 W 21st St Jacksonville, FL | 3.0 | 2.0 | 1045 | $1,350 | $1.29 | 23d | 1 | 0.70mi |
| 851 Broxton St Unit 851 Jacksonville, FL | 1.0 | 1.0 | 700 | $875 | $1.25 | 17d | 1 | 0.76mi |
| 3020 N Laura St Jacksonville, FL | 3.0 | 1.0 | 1162 | $1,300 | $1.12 | 23d | 1 | 0.77mi |
Listing history 36 events
-
2026-06-15statusdays on market $120,000 Pending 141 DOM
-
2026-06-10days on market $120,000 Active Under Contract 140 DOM
-
2026-06-08days on market $120,000 Active Under Contract 139 DOM
-
2026-06-08days on market $120,000 Active Under Contract 138 DOM
-
2026-06-03days on market $120,000 Active Under Contract 134 DOM
-
2026-06-02days on market $120,000 Active Under Contract 133 DOM
-
2026-06-01days on market $120,000 Active Under Contract 132 DOM
-
2026-05-31days on market $120,000 Active Under Contract 131 DOM
-
2026-05-21historical Active Under Contract
-
2026-05-14status Active
-
2026-05-14price $120,000
-
2026-02-16status Active
-
2026-02-12status Pending
-
2026-02-12historical
-
2026-02-03price $82,000
-
2026-01-27price $83,000
-
2026-01-14price $84,000
-
2026-01-06price $85,000
-
2025-12-09price $86,000
-
2025-12-04price $87,500
-
2025-11-18price $89,000
-
2025-11-13price $90,000
-
2025-11-04price $95,000
-
2025-10-21$100,000 Active
-
2025-08-26soldstatus $1,750,000
-
2025-04-29soldstatus $432,040
-
2016-12-01historical 94-char remark
Show marketing remark (94 chars)
BEAUTIFUL INVESTMENT HOME. CLOSE TO TRANSPORTATION, SHOPPING AND MORE. A DIAMOND IN THE ROUGH.
-
2016-11-14status Active 94-char remark
Show marketing remark (94 chars)
BEAUTIFUL INVESTMENT HOME. CLOSE TO TRANSPORTATION, SHOPPING AND MORE. A DIAMOND IN THE ROUGH.
-
2016-06-15status Pending 94-char remark
Show marketing remark (94 chars)
BEAUTIFUL INVESTMENT HOME. CLOSE TO TRANSPORTATION, SHOPPING AND MORE. A DIAMOND IN THE ROUGH.
-
2016-04-25historical Active - Contingent 94-char remark
Show marketing remark (94 chars)
BEAUTIFUL INVESTMENT HOME. CLOSE TO TRANSPORTATION, SHOPPING AND MORE. A DIAMOND IN THE ROUGH.
-
2015-07-17$10,000 Active 94-char remark
Show marketing remark (94 chars)
BEAUTIFUL INVESTMENT HOME. CLOSE TO TRANSPORTATION, SHOPPING AND MORE. A DIAMOND IN THE ROUGH.
-
2013-06-14$14,000 119-char remark
Show marketing remark (119 chars)
MARVELOUS INVESTMENT OPPORTUNITY. CHECK OUT THIS 3/2. ENCLOSED FRONT PORCH. CLOSE TO TRANSPORTATION, SHOPPING AND MORE!
-
2011-09-02historical
-
2011-03-03$20,000
-
1985-04-01soldstatus $30,000
-
1980-05-13soldstatus $24,000
ⓘ Source: listings_history table (triggers on properties + properties_extension) + one-shot
backfill from property_details.listing_events for pre-trigger history.
Tax reassessment forecast FL · Resets to sale price
- Current annual tax
- $1,354 · $113/mo
- Projected year-2 tax
- $1,354 · $113/mo
- Expected delta
- $0/yr ($0/mo · 0.0%)
ⓘ Screening estimate from a state-policy table — verify with the county assessor before closing.
Climate risk First Street
- Flood 1/10 Low FEMA zone X (unshaded) · 0% chance over 30 yrs
- Wildfire 1/10 Low
- Heat 9/10 Extreme 7 d/yr ≥107°F today · 20 d/yr by 30 yrs out
- Wind 9/10 Extreme 99% chance of damaging wind over 30 yrs
- Air quality 4/10 Moderate 6 unhealthy d/yr today · 6 by 30 yrs out
Nearby sold comps map
Loading sold comps map…
Walkable amenities ~0.75 mi
Loading nearby amenities…
Taxation est. · year 1
- Rental income
- $14,248
- − Mortgage interest
- −$6,722
- − Property taxes
- −$1,354
- − Insurance
- −$600
- − Repairs & maintenance
- −$1,140
- − Management
- −$1,140
- − Depreciation
- −$3,491
- Taxable loss
- −$199
- Est. tax savings @ 24.0%
- +$48
- After-tax cash flow
- $1,798/yr
For passive investors: Depreciation is non-cash, so a rental often shows a tax loss while cash-flowing — sheltering income. Rental losses are passive: they offset passive income freely, and up to $25,000/yr can offset ordinary (W-2) income if you actively participate and your MAGI is under $100k (phasing out to $0 by $150k); unused losses carry forward. On sale, claimed depreciation is recaptured at up to 25%, and gains may owe capital-gains tax (a 1031 exchange can defer both). Figures are a year-1 estimate at your 24.0% rate — not tax advice; consult a CPA.
Schools (NCES district)
- District
- Duval
- NCES district ID
- 1200480
- Math proficiency
- 46% ▼ -11.00%
- Reading proficiency
- 45% ▼ -4.00%
- Median HH income
- $48,987
- Composite
- 38.97/100
- National rank
- #4076
- State rank
- #48 of 73 in FL
Livability — Jacksonville
- Score
- 83/100
- State rank
- #50
- US rank
- #911
Category grades
Schools grade is shown separately in the Schools card above.
Census & demographics
- Census place
- Jacksonville, FL
- County
- Duval County · 1,015,274 people
- City population
- 979,034
- Metro
- Jacksonville, FL
- Population (ZIP)
- 17,105
- Household income
- $39,242
- Rent vs Own
- Severe rent burden
- 1057.0
Population outlook (Duval County) Hauer SSP2
- Today (2025)
- 1,013,010 people
- By 2030
- 1,059,228 · +4.6%
- By 2040
- 1,141,439 · +12.7%
- By 2050
- 1,205,258 · +19.0%
- By 2075
- 1,324,282 · +30.7%
- By 2100
- 1,319,620 · +30.3%
Race, ethnicity, and origin ACS 2023
- Neighborhood character
- Predominantly Black (65%)
- Race & ethnicity
- Black 65% White 22% Two or more races 8% Hispanic / Latino 6%
- Hispanic origin (detail)
- Mexican 1% Puerto Rican 2%
- Common ancestry
- Italian 2% Romanian 1% Slovak 1%
- Foreign-born
- 5% · Canada
- Languages at home
- 93% English-only · Spanish 3% Arabic 1% German/W. Germanic 1%
Political lean MEDSL · Duval
- 2024 margin
- Toss-up / Even · D 48.7% · R 50.1% · Other 1.2%
- 2008→2024 swing
- +0.4pp no change · 2008: -1.9pp · 2024: -1.5pp
- All cycles
- 2024: R+1.5 2020: D+3.8 2016: R+1.5 2012: R+3.6 2008: R+1.9
Not yet ingested
- Civics
- —
Market trends
- HPI YoY
- ▼ -64.55%
- Current HPI
- 208.1852
- Rent YoY
- ▲ 0.94%
- Metro
- Jacksonville, FL
- State GDP YoY
- ▲ 3.28%
- F500 in state
- 36
Industry mix (Fortune 500 HQ in FL)
| Industry | F500 HQs | Revenue |
|---|---|---|
| Industrial Technology | 2 | $29B |
|
||
| Insurance | 2 | $17B |
|
||
| Retail | 1 | $60B |
|
||
| Technology Distribution | 1 | $58B |
|
||
| Homebuilding | 1 | $35B |
|
||
| Technology Manufacturing | 1 | $35B |
|
||
Price history
+400.0% since first listed28 events — show timeline
- 2026-05-21 Contingent — realMLS
- 2026-05-14 Relisted — realMLS
- 2026-05-14 Price Changed $120,000 realMLS
- 2026-02-16 Relisted — realMLS
- 2026-02-12 Pending — realMLS
- 2026-02-12 Listing Removed — realMLS
- 2026-02-03 Price Changed $82,000 realMLS
- 2026-01-27 Price Changed $83,000 realMLS
- 2026-01-14 Price Changed $84,000 realMLS
- 2026-01-06 Price Changed $85,000 realMLS
- 2025-12-09 Price Changed $86,000 realMLS
- 2025-12-04 Price Changed $87,500 realMLS
- 2025-11-18 Price Changed $89,000 realMLS
- 2025-11-13 Price Changed $90,000 realMLS
- 2025-11-04 Price Changed $95,000 realMLS
- 2025-10-21 Listed $100,000 realMLS
- 2025-08-26 Sold (Public Records) $1,750,000 Public Records
- 2025-04-29 Sold (Public Records) $432,040 Public Records
- 2016-12-01 Listing Removed — realMLS
- 2016-11-14 Relisted — realMLS
- 2016-06-15 Pending — realMLS
- 2016-04-25 Contingent — realMLS
- 2015-07-17 Listed $10,000 realMLS
- 2013-06-14 Listed $14,000 realMLS
- 2011-09-02 Listing Removed — realMLS
- 2011-03-03 Listed $20,000 realMLS
- 1985-04-01 Sold (Public Records) $30,000 Public Records
- 1980-05-13 Sold (Public Records) $24,000 Public Records
Property tax history
+6.2%/yrLatest (2025): $1,354 · +23.9% YoY. Source: county tax records.
Cash-flow waterfall
monthlySold comps — $/sqft
last 12 mo · ≤1 miLoading sold comps…