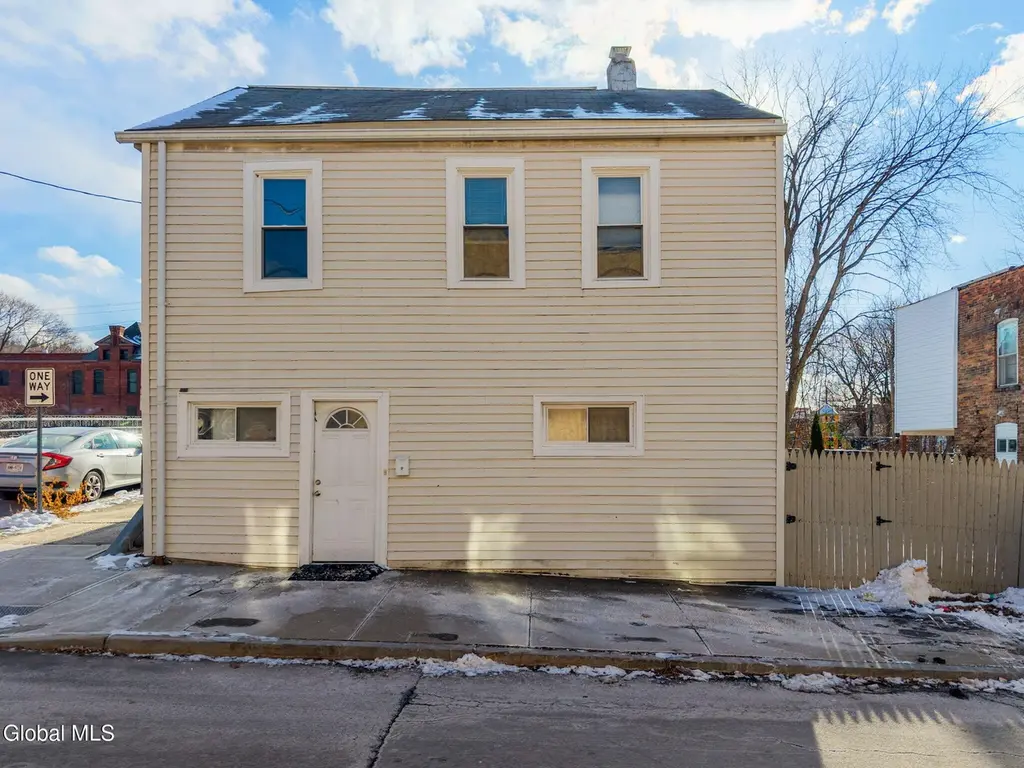
52 Ida St · Troy, NY
Flood risk 9/10 · Severe
- FEMA flood zone
- AE
- Chance of flooding over 30 yrs
- 0.99%
- Est. flood insurance / yr
- $2,026 – $9,024
Fire risk 1/10 · Minimal
- Est. fire insurance / yr
- $691 – $1,283
Heat risk 4/10 · Minor
- Hot days now (above 96°F)
- 7 days/yr
- Hot days in 30 yrs
- 16 days/yr
Wind risk 3/10 · Minor
- Chance of severe wind over 30 yrs
- 6.0%
Air-quality risk 2/10 · Minimal
- Unhealthy air days now
- 0 days/yr
- Unhealthy air days in 30 yrs
- 1 days/yr
Risk factors via First Street. Map © Google.
Why this score? — see what drove the B- grade
The composite is a weighted blend of 9 inputs, each scored 0–100. Each bar is that input's sub-score; the figure is the points it added to the 100-point composite (weight × sub-score).
- Cash flow +21.8/30.0
- ARV discount +15.0/15.0
- 1% rule +7.3/10.0
- DSCR +7.0/10.0
- Livability +4.0/5.0
- Schools +3.8/10.0
- Rent growth +3.7/5.0
- Condition / age +2.5/5.0
- Appreciation +0.0/10.0
$142,500
🖨 Deal sheet (PDF) 📄 Offer letter ✓ Due diligence
Listing remarks MLS
An exciting opportunity in South Troy--this 2-bedroom, 1-bath single-family home on a double lot (50 & 52 Ida St. conveyed together!) offers exceptional outdoor space and flexibility. Both lots are fully fenced as one, creating a private, oversized yard perfect for entertaining, expansion, or just enjoying the outdoors. Relax in your backyard while overlooking the Poesten Kill Creek, a peaceful setting perfect for hosting gatherings! Conveniently located near local amenities. Property is being sold as-is.
Key facts
- Fully fenced
- Double lot
- Near local amenities
Tags
Neighborhood map
What this means for you Summary
Snapshot
- This is a 2-bed/1.0-bath single-family listed at $142k.
Deal economics
- At list price, monthly cash flow is $-238 ($-3k/yr) — negative.
- To cash-flow at today's rent, offer at most $101k (29.4% below list).
- Meets the 1% rule at list price ($2k rent vs $142k).
- Recommended offer: $101k (29.4% below list) — sets the bar for cash-flow.
- Cap rate 8.2% vs local median 5.3% in Troy — top-decile yield for the area; either an underpriced asset or a hidden risk that comps aren't pricing in. Stress-test before assuming the spread holds.
Location & tenants
- Location reads 81/100 on livability (#88 in NY, #1,350 nationally) — a professional / high-income tenant draw. Strengths: amenities A+, commute A+, housing A+; Watch: employment C-, crime F.
- Troy City School District (urban): math 44% / reading 46% proficiency, ranked #467 of 590 in NY (top 79%) — families likely to look elsewhere, expect single-tenant / working-renter base with shorter leases; 62% free/reduced lunch — lower-income household profile, screen leases tightly.
- Zoned schools: Ps 14 (math 47% / reading 42%, grade F, #1,277 of 2,108 statewide, top 64%, 425 students, 76% FRL); Troy Middle School (math 22% / reading 43%, grade F, #504 of 729 statewide, top 70%, 786 students, 72% FRL); Troy High School (math 95% / reading 77%, grade A, #347 of 1,100 statewide, top 32%, 1,153 students, 64% FRL).
- Market conditions: Rents rising fast (+4.9%/yr); 220 active listings in the ZIP; 40 comparable units currently listed for rent nearby; rentals at typical pace (median 21d on market — plan ~3-4 weeks tenant-placement turnaround); solid renter incomes; 405 units permitted in Rensselaer County in 2024 (224 in 5+ unit buildings).
Forward outlook
- Local home prices are declining (-3.0%/yr); year-one equity from $985 of loan paydown is wiped out by about $4k of value loss. Plan a longer hold.
- Rensselaer County population projected to shrink 6% by 2050 — rents likely to lag national; underwrite the cash flow, not the appreciation.
Negotiation context
- It's been on market 109 days — a 9% lower offer ($130k) is reasonable based on typical stale-listing flexibility.
- 4 sale attempts since 24y ago with the ask held roughly flat each time — persistent listings suggest the price (not the market) is what's stuck; bring a comps-based counter.
- Current owner paid $30k; list at $142k implies a 375% gain — meaningful room to come down on a strong offer.
Risks & watch-outs
- Watch-outs: property tax is 3.0% of price; flood insurance adds $460/mo; built in 1890 — expect roof / HVAC / electrical / plumbing capex.
- Climate carrying-cost: in FEMA flood zone AE (mandatory federal flood insurance) — expect insurance premiums to compound above CPI over the hold.
Questions for the listing agent
- What do current leases actually rent for vs. the listed asking? Can we see a recent rent roll and the last 12 months of T-12 income?
- It's been on market 109 days. Have you received any prior offers? Is the seller open to a 29% concession, seller financing, or rate buy-down credit?
- Built in 1890 — when were the roof, HVAC, electrical panel, plumbing, and water heater last replaced?
- Property tax is high relative to price — has the assessment been appealed recently, and will the sale trigger a re-assessment?
- What's the actual annual flood-insurance premium (NFIP or private), and is the property in a SFHA with mandatory coverage?
- Why hasn't it sold? Are there any deal-killer items the seller is aware of (foundation, flood, title, zoning, code violations)?
- Is there a deadline driving the sale (1031 exchange, divorce, estate, relocation)? That informs how much negotiation room exists.
- Crime grade is F in this area — have there been break-ins, vandalism, or insurance claims at this property in the last 3 years? What carrier currently insures it and at what premium?
- What's the average days-on-market for RENTAL listings here right now (not sales)? A rising rental-DOM trend means longer vacancies and softer asking-rent achievability than the comps imply.
- What's the recent tenant-quality profile in this submarket — average credit score on applications, eviction rate, late-payment / NSF rate, and stable-employment percentage? A property-management company in the area should have these aggregated.
- How much new for-sale + rental construction is in the pipeline within 1–3 miles? Heavy new supply typically softens prices + rents 12–24 months out; constrained supply supports both.
Investment metrics
- 1% rule
- 1.23% ✓
- Cap rate
- 8.17%
- Cash-on-cash
- 6.70%
- DSCR
- 1.30
- GRM
- 6.8
CMA / ARV
- ARV (median comp)
- $172,952
- List price
- $142,500
- Delta
- -17.61%
- Verdict
- UNDERPRICED
- Comps
- 20 within 1.0 mi
Show comp detail 12 sales within ~0.75 mi
| Address | Dist | Beds/Ba | Sqft | Sold | Price | $/sf | Match |
|---|---|---|---|---|---|---|---|
| 37 Francis St | 0.51mi | 2/1.0 | 1,298 (-4%) | 12mo | $190,000 | $146 | 60 |
| 66 Jefferson St | 0.07mi | 2/1.5 | 1,152 (-15%) | 12mo | $125,000 | $109 | 60 |
| 35 Lincoln Ave | 0.54mi | 3/1.0 (+1) | 1,346 (-0%) | 17mo | $162,800 | $121 | 55 |
| 10 Clearview Dr | 0.57mi | 3/3.0 (+1) | 1,383 (+2%) | 7mo | $325,000 | $235 | 51 |
| 1318 3rd Ave | 0.64mi | 3/1.5 (+1) | 1,350 (-0%) | 15mo | $245,000 | $181 | 51 |
| 1 Birch St | 0.59mi | 3/1.0 (+1) | 1,496 (+11%) | 4mo | $57,000 | $38 | 46 |
| 504 Washington St | 0.34mi | 3/2.5 (+1) | 1,250 (-8%) | 17mo | $135,000 | $108 | 46 |
| 1503 4th Ave | 0.74mi | 2/1.0 | 1,262 (-7%) | 13mo | $155,000 | $123 | 43 |
| 14 State Street St | 0.68mi | 2/2.0 | 1,239 (-8%) | 11mo | $240,000 | $194 | 41 |
| 359 Congress St | 0.68mi | 2/1.5 | 1,496 (+11%) | 9mo | $187,500 | $125 | 41 |
| 26 Lincoln Ave | 0.51mi | 3/2.0 (+1) | 1,210 (-10%) | 16mo | $159,500 | $132 | 36 |
| 4 O'neil St | 0.72mi | 3/1.5 (+1) | 1,152 (-15%) | 3mo | $250,000 | $217 | 32 |
Match score weights: distance 35% · size 25% · config 20% · recency 20%. Top-matched comps best support the ARV.
Projected returns pro-forma
-3.0% appreciation · 4.88% rent growth · sell at horizon
- IRR
- -24.6%
- Equity multiple
- 0.14×
- Total profit
- $-34,413
- Equity at exit
- $21,247
- IRR
- -12.3%
- Equity multiple
- 0.17×
- Total profit
- $-33,294
- Equity at exit
- $12,321
Cash invested: $39,900 (down + closing). Projections, not guarantees.
Landlord ↔ Tenant lean methodology
- Overall (STATE)
- 15 Strongly Tenant-Friendly
- State New York
- 15 Strongly Tenant-Friendly · D+10
- County
- — inherits STATE
- City
- — inherits STATE
ZIP-level market 12180
- Home prices YoY
- -33.3%
- Rents YoY
- 4.9%
- Active inventory
- 220
- Price-to-rent
- 6.8×
Monthly cashflow live
- Estimated rent
- $1,758 high interval (Pro) →
- Mortgage (P&I)
- −$747
- Tax from tax record
- −$359 /mo · $4,310/yr
- Insurance
- −$59
- Flood insurance flood zone
- −$460 /mo · $5,525/yr
- HOA
- −$0
- Vacancy / Maint / Mgmt
- −$369
- Net cashflow
- $-238
Break-even live
Sensitivity live
| Price | -10% $-157 | -5% $-197 | +0% $-238 | +5% $-278 | +10% $-318 |
|---|---|---|---|---|---|
| Rent | -10% $-376 | -5% $-307 | +0% $-238 | +5% $-168 | +10% $-99 |
| Rate | -1.0pp $-166 | -0.5pp $-201 | base $-238 | +0.5pp $-274 | +1.0pp $-312 |
UW: 25.0% down · 7.5% · 30yr · 1.5% tax · 5.0% vac · 8.0% maint · 8.0% mgmt
Financing live
Cash to close
- Down payment
- $35,625
- Closing costs
- $4,275
- Reserves months
- —
- Total cash needed
- —
Loan-product check · same deal, 3 products live
Conventional
25% down · 7.5% · 30yr
- Down + closing
- —
- Monthly P&I
- —
- Monthly cashflow
- —
- DSCR
- —
- Eligible?
- —
Personal DTI + credit; lowest rate.
DSCR
20% down · 8.5% · 30yr
- Down + closing
- —
- Monthly P&I
- —
- Monthly cashflow
- —
- DSCR
- —
- Eligible?
- —
No personal income docs; deal must DSCR.
Hard money
10% down · 12.0% · 12mo
- Down + closing
- —
- Monthly P&I
- —
- Monthly cashflow
- —
- DSCR
- —
- Eligible?
- —
Short-term bridge; refi at stabilization.
Rent comps 40 comps
| Address | Beds | Baths | Sqft | Rent | $/sqft | DOM | Units | Dist |
|---|---|---|---|---|---|---|---|---|
| 306 3rd St Troy, NY | 3.0 | 1.0 | 1100 | $1,700 | $1.55 | 25d | 1 | 0.05mi |
| 355 4th St Troy, NY | 3.0 | 2.0 | 1203 | $1,750 | $1.45 | 25d | 1 | 0.07mi |
| 323 2nd St #1 Troy, NY | 2.0 | 1.0 | 1150 | $1,950 | $1.70 | 25d | 1 | 0.10mi |
| 334 4th St Troy, NY | 2.0 | 1.0 | 1200 | $1,550 | $1.29 | 25d | 1 | 0.10mi |
| 356 3rd St Unit 2 Troy, NY | 3.0 | 1.0 | 1000 | $1,950 | $1.95 | 16d | 1 | 0.13mi |
| 114 Ida St Unit 1 Troy, NY | 3.0 | 1.0 | 1100 | $1,395 | $1.27 | 25d | 1 | 0.19mi |
| 363 1st St Troy, NY | 3.0 | 2.5 | 1408 | $2,100 | $1.49 | 16d | 1 | 0.28mi |
| 363 1st St Troy, NY | 3.0 | 2.5 | 1408 | $2,100 | $1.49 | 23d | 1 | 0.28mi |
| 2 River St Troy, NY | 2.0 | 1.0–2.5 | 945 | $2,650 | $2.80 | 16d | 6 | 0.30mi |
| 189 Hill St Troy, NY | 3.0 | 1.0 | 995 | $1,900 | $1.91 | 25d | 1 | 0.32mi |
| 22 13th St Watervliet, NY | 2.0 | 1.5 | 900 | $1,600 | $1.78 | 45d | 1 | 0.49mi |
| 11 Spring Ave Troy, NY | 3.0 | 2.0 | 1788 | $2,500 | $1.40 | 25d | 1 | 0.55mi |
| 124 Ferry St Troy, NY | 1.0–3.0 | 1.0–2.0 | 814 | $1,914 | $2.35 | 16d | 10 | 0.55mi |
| 1520 6th Ave Troy, NY | 2.0–4.0 | 2.0–4.0 | 1209 | $1,100 | $0.91 | 25d | 8 | 0.62mi |
| 53-55 Congress St Troy, NY | 2.0 | 1.0 | 1500 | $1,700 | $1.13 | 25d | 1 | 0.63mi |
| 65 3rd St Troy, NY | 2.0 | 2.0 | 1185 | $2,995 | $2.53 | 25d | 1 | 0.63mi |
| 809 Broadway #2 Watervliet, NY | 3.0 | 1.0 | 1100 | $1,625 | $1.48 | 45d | 1 | 0.64mi |
| 155 River St Unit 3C Troy, NY | 2.0 | 1.0 | 1100 | $2,000 | $1.82 | 16d | 1 | 0.65mi |
| 155 River St Unit 5D Troy, NY | 2.0 | 1.0 | 900 | $2,000 | $2.22 | 45d | 1 | 0.65mi |
| 1611 6th Ave Troy, NY | 1.0–2.0 | 1.0–2.0 | 976 | $3,000 | $3.07 | 16d | 28 | 0.67mi |
| 104 4th St Unit 2 Troy, NY | 3.0 | 1.0 | 950 | $1,800 | $1.89 | 16d | 1 | 0.69mi |
| 182 Delaware Ave Troy, NY | 1.0–2.0 | 1.0–2.0 | 739 | $1,695 | $2.29 | 16d | 17 | 0.69mi |
| 17 State St Troy, NY | 4.0 | 1.0–1.5 | 1810 | $2,358 | $1.30 | 16d | 7 | 0.72mi |
| 53 3rd St Troy, NY | 1.0 | 1.0 | 1000 | $1,700 | $1.70 | 21d | 1 | 0.73mi |
| 51 14th St Unit 1 Troy, NY | 2.0 | 1.0 | 1000 | $850 | $0.85 | 16d | 1 | 0.76mi |
| 649 4th St Unit 2 Troy, NY | 3.0 | 1.0 | 1200 | $1,345 | $1.12 | 25d | 1 | 0.77mi |
| 1513 5th Ave Unit 2 Watervliet, NY | 3.0 | 1.0 | 1200 | $1,550 | $1.29 | 16d | 1 | 0.78mi |
| 1534 5th Ave #1 Watervliet, NY | 3.0 | 1.0 | 1200 | $1,595 | $1.33 | 45d | 1 | 0.79mi |
| 79 14th St Unit 1 Troy, NY | 3.0 | 1.0 | 1500 | $650 | $0.43 | 21d | 1 | 0.80mi |
| 88 14th St Unit 1 Troy, NY | 2.0 | 1.0 | 1000 | $795 | $0.80 | 21d | 1 | 0.83mi |
| 1417 7th Ave Unit 2 Watervliet, NY | 2.0 | 1.0 | 1000 | $2,200 | $2.20 | 16d | 1 | 0.90mi |
| 1708 Highland Ave Unit 3 Troy, NY | 3.0 | 1.0 | 1485 | $595 | $0.40 | 21d | 1 | 0.91mi |
| 509 5th Ave Unit 9 Watervliet, NY | 3.0 | 1.0 | 1100 | $1,800 | $1.64 | 16d | 1 | 1.00mi |
| 2001 5th Ave Troy, NY | 2.0 | 1.0–2.0 | 865 | $2,650 | $3.06 | 16d | 10 | 1.00mi |
| 110 Project Rd Unit 1 Troy, NY | 2.0 | 1.0 | 1000 | $1,300 | $1.30 | 25d | 1 | 1.01mi |
| 2002 Federal St Troy, NY | 2.0 | 1.0–2.0 | 830 | $3,450 | $4.16 | 16d | 51 | 1.03mi |
| 1820 Highland Ave Unit 1 Troy, NY | 2.0 | 1.0 | 1000 | $850 | $0.85 | 21d | 1 | 1.03mi |
| 2413 6th Ave Unit 1 Watervliet, NY | 2.0 | 1.0 | 900 | $1,550 | $1.72 | 45d | 1 | 1.20mi |
| 238 8th St Troy, NY | 3.0 | 2.0 | 1200 | $2,200 | $1.83 | 25d | 1 | 1.24mi |
| 196 10th St Troy, NY | 3.0 | 1.0 | 1200 | $695 | $0.58 | 21d | 1 | 1.25mi |
Listing history 27 events
-
2026-06-21days on market $142,500 Active 109 DOM
-
2026-06-18days on market $142,500 Active 106 DOM
-
2026-06-17days on market $142,500 Active 105 DOM
-
2026-06-16days on market $142,500 Active 104 DOM
-
2026-06-15days on market $142,500 Active 103 DOM
-
2026-06-14days on market $142,500 Active 101 DOM
-
2026-06-13days on market $142,500 Active 100 DOM
-
2026-06-10days on market $142,500 Active 98 DOM
-
2026-06-09days on market $142,500 Active 97 DOM
-
2026-06-08days on market $142,500 Active 96 DOM
-
2026-06-07days on market $142,500 Active 95 DOM
-
2026-06-03days on market $142,500 Active 91 DOM
-
2026-06-02days on market $142,500 Active 90 DOM
-
2026-06-01days on market $142,500 Active 89 DOM
-
2026-05-31days on market $142,500 Active 88 DOM
-
2026-05-31days on market $142,500 Active 87 DOM
-
2026-04-01price $142,500 514-char remark
Show marketing remark (514 chars)
An exciting opportunity in South Troy--this 2-bedroom, 1-bath single-family home on a double lot (50 & 52 Ida St. conveyed together!) offers exceptional outdoor space and flexibility. Both lots are fully fenced as one, creating a private, oversized yard perfect for entertaining, expansion, or just enjoying the outdoors. Relax in your backyard while overlooking the Poesten Kill Creek, a peaceful setting perfect for hosting gatherings! Conveniently located near local amenities. Property is being sold as-is.
-
2026-03-04$145,000 Active 514-char remark
Show marketing remark (514 chars)
An exciting opportunity in South Troy--this 2-bedroom, 1-bath single-family home on a double lot (50 & 52 Ida St. conveyed together!) offers exceptional outdoor space and flexibility. Both lots are fully fenced as one, creating a private, oversized yard perfect for entertaining, expansion, or just enjoying the outdoors. Relax in your backyard while overlooking the Poesten Kill Creek, a peaceful setting perfect for hosting gatherings! Conveniently located near local amenities. Property is being sold as-is.
-
2015-05-19soldstatus $30,000
-
2011-10-20historical
-
2011-04-19$49,900
-
2011-02-01historical
-
2010-07-21$54,900
-
2003-10-21soldstatus $44,900
-
2003-08-22soldstatus $44,900
-
2003-06-05historical
-
2002-07-09$44,900
ⓘ Source: listings_history table (triggers on properties + properties_extension) + one-shot
backfill from property_details.listing_events for pre-trigger history.
Tax reassessment forecast NY · Partial reset (capped growth)
- Current annual tax
- $4,310 · $359/mo
- Projected year-2 tax
- $4,310 · $359/mo
- Expected delta
- $0/yr ($0/mo · 0.0%)
ⓘ Screening estimate from a state-policy table — verify with the county assessor before closing.
Climate risk First Street
- Flood 9/10 Extreme FEMA zone AE · 99% chance over 30 yrs
- Wildfire 1/10 Low
- Heat 4/10 Moderate 7 d/yr ≥96°F today · 16 d/yr by 30 yrs out
- Wind 3/10 Moderate 6% chance of damaging wind over 30 yrs
- Air quality 2/10 Low 0 unhealthy d/yr today · 1 by 30 yrs out
Nearby sold comps map
Loading sold comps map…
Walkable amenities ~0.75 mi
Loading nearby amenities…
Taxation est. · year 1
- Rental income
- $21,094
- − Mortgage interest
- −$7,982
- − Property taxes
- −$4,310
- − Insurance
- −$6,238
- − Repairs & maintenance
- −$1,688
- − Management
- −$1,688
- − Depreciation
- −$4,145
- Taxable loss
- −$4,956
- Est. tax savings @ 24.0%
- +$1,189
- After-tax cash flow
- $-1,661/yr
For passive investors: Depreciation is non-cash, so a rental often shows a tax loss while cash-flowing — sheltering income. Rental losses are passive: they offset passive income freely, and up to $25,000/yr can offset ordinary (W-2) income if you actively participate and your MAGI is under $100k (phasing out to $0 by $150k); unused losses carry forward. On sale, claimed depreciation is recaptured at up to 25%, and gains may owe capital-gains tax (a 1031 exchange can defer both). Figures are a year-1 estimate at your 24.0% rate — not tax advice; consult a CPA.
Schools (NCES district)
- District
- Troy City School District
- NCES district ID
- 3628950
- Math proficiency
- 44% ▲ 6.00%
- Reading proficiency
- 46% ▲ 6.00%
- Median HH income
- $42,143
- Composite
- 37.89/100
- National rank
- #4318
- State rank
- #467 of 590 in NY
Livability — Troy
- Score
- 81/100
- State rank
- #88
- US rank
- #1350
Category grades
Schools grade is shown separately in the Schools card above.
Census & demographics
- Census place
- Troy, NY
- County
- Rensselaer County · 75,590 people
- City population
- 53,479
- Metro
- Albany-Schenectady-Troy, NY
- Population (ZIP)
- 53,479
- Household income
- $75,851
- Rent vs Own
- Severe rent burden
- 2698.0
Population outlook (Rensselaer County) Hauer SSP2
- Today (2025)
- 162,400 people
- By 2030
- 161,746 · -0.4%
- By 2040
- 158,095 · -2.7%
- By 2050
- 152,966 · -5.8%
- By 2075
- 140,767 · -13.3%
- By 2100
- 124,727 · -23.2%
Race, ethnicity, and origin ACS 2023
- Neighborhood character
- Predominantly White (70%)
- Race & ethnicity
- White 70% Black 12% Hispanic / Latino 8% Two or more races 8% Asian 5%
- Hispanic origin (detail)
- Mexican 1% Puerto Rican 4%
- Common ancestry
- Romanian 5% Lithuanian 5% Slovak 1%
- Foreign-born
- 10% · Canada, China
- Languages at home
- 88% English-only · Spanish 4% Other Indo-European 2% Arabic 2%
Political lean MEDSL · Rensselaer
- 2024 margin
- Toss-up / Even · D 50.7% · R 49.3%
- 2008→2024 swing
- -8.0pp toward R · 2008: 9.3pp · 2024: 1.4pp
- All cycles
- 2024: D+1.4 2020: D+5.6 2016: R+2.9 2012: D+11.8 2008: D+9.3
Not yet ingested
- Civics
- —
Market trends
- HPI YoY
- ▼ -142.53%
- Current HPI
- 285.0762
- Rent YoY
- ▲ 4.88%
- Metro
- Albany-Schenectady-Troy, NY
- State GDP YoY
- ▲ 2.60%
- F500 in state
- 92
Industry mix (Fortune 500 HQ in NY)
| Industry | F500 HQs | Revenue |
|---|---|---|
| Financial Services | 10 | $950B |
|
||
| Consumer Goods | 9 | $162B |
|
||
| Insurance | 4 | $225B |
|
||
| Telecommunications | 2 | $144B |
|
||
| Pharmaceuticals | 2 | $112B |
|
||
| Media / Entertainment | 2 | $69B |
|
||
Price history
+217.4% since first listed11 events — show timeline
- 2026-04-01 Price Changed $142,500 Global MLS
- 2026-03-04 Listed $145,000 Global MLS
- 2015-05-19 Sold (Public Records) $30,000 Public Records
- 2011-10-20 Listing Removed — Global MLS
- 2011-04-19 Listed $49,900 Global MLS
- 2011-02-01 Listing Removed — Global MLS
- 2010-07-21 Listed $54,900 Global MLS
- 2003-10-21 Sold (Public Records) $44,900 Public Records
- 2003-08-22 Sold (MLS) $44,900 Global MLS
- 2003-06-05 Listing Removed — Global MLS
- 2002-07-09 Listed $44,900 Global MLS
Property tax history
+17.5%/yrLatest (2025): $4,310 · -20.2% YoY. Source: county tax records.
Cash-flow waterfall
monthlySold comps — $/sqft
last 12 mo · ≤1 miLoading sold comps…