1341 Bethaven Rd · Riverdale, GA
Flood risk 1/10 · Minimal
- FEMA flood zone
- X (unshaded)
- Chance of flooding over 30 yrs
- 0.0%
- Est. flood insurance / yr
- $507 – $1,088
Fire risk 3/10 · Minor
- Est. fire insurance / yr
- $963 – $1,789
Heat risk 5/10 · Moderate
- Hot days now (above 105°F)
- 7 days/yr
- Hot days in 30 yrs
- 17 days/yr
Wind risk 6/10 · Moderate
- Chance of severe wind over 30 yrs
- 27.0%
Air-quality risk 4/10 · Minor
- Unhealthy air days now
- 4 days/yr
- Unhealthy air days in 30 yrs
- 7 days/yr
Risk factors via First Street. Map © Google.
Why this score? — see what drove the B+ grade
The composite is a weighted blend of 9 inputs, each scored 0–100. Each bar is that input's sub-score; the figure is the points it added to the 100-point composite (weight × sub-score).
- Cash flow +30.0/30.0
- ARV discount +15.0/15.0
- 1% rule +10.0/10.0
- DSCR +10.0/10.0
- Livability +3.5/5.0
- Rent growth +3.4/5.0
- Condition / age +2.5/5.0
- Schools +1.3/10.0
- Appreciation +0.0/10.0
$125,000
🖨 Deal sheet (PDF) 📄 Offer letter ✓ Due diligence
Listing remarks
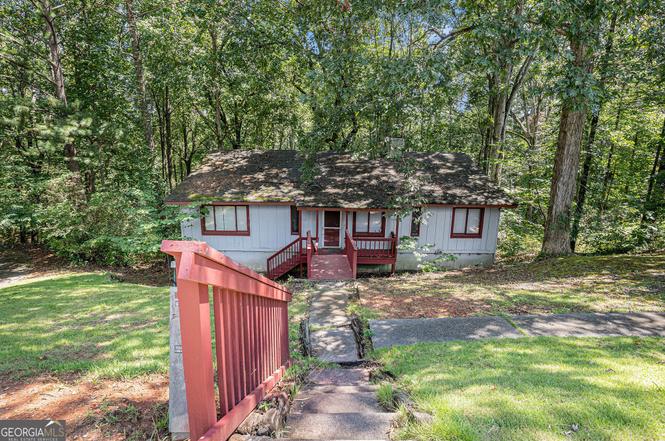
This 3-bedroom, 2-bath home on over half an acre in an established Riverdale neighborhood offers a spacious layout with vaulted ceilings, exposed beams, and a stone fireplace in the living area, plus French doors leading to a private rear deck. With an open living and dining space, a galley kitchen, and well-sized bedrooms, the home has great bones and just needs the right updates to truly shine. Whether you're an investor, a first-time buyer using renovation financing, or someone looking to create long-term rental income, there's strong potential here to build equity and value in a convenient location near schools, shopping, and commuter routes.
Key facts
- Galley kitchen
- Stone fireplace
- Private rear deck
Tags
Property features AI
Finance
- Other: Lot about 0.68 acre
- HOA & community: No HOA
Exterior
- Parking: Off-street parking; Parking pad; Open parking available
- Utilities: Public water; Public sewer; Other utilities
- Home design: Single family residence; House; Resale property
- Construction: Built in 1983; Wood siding construction; Composition roof
- Exterior features: Cul-de-sac lot; Steep slope
Interior
- Bedrooms: 3 bedrooms on the main level
- Flooring: Vinyl flooring
- Bathrooms: 2 full bathrooms
- Heating & cooling: Forced air heating; Central air conditioning
- Interior features: Separate shower; Vaulted ceilings; One-level living; Family room; Fireplace (1)
- Laundry & utility: Laundry area (other configuration)
Neighborhood map
What this means for you Summary
Snapshot
- This is a 3-bed/2.0-bath single-family listed at $125k.
Deal economics
- At list price, monthly cash flow is $546 ($7k/yr) — positive.
- The deal already cash-flows at list — no discount required.
- Meets the 1% rule at list price ($2k rent vs $125k).
- Recommended offer: $110k (12.0% below list) — sets the bar for market timing.
- Cap rate 11.5% vs local median 5.5% in Riverdale — top-decile yield for the area; either an underpriced asset or a hidden risk that comps aren't pricing in. Stress-test before assuming the spread holds.
Location & tenants
- Location reads 70/100 on livability (#100 in GA) — a middle-class / working-renter tenant base. Strengths: cost of living A+, housing A+; Watch: crime D, amenities F, commute F.
- Clayton County (suburban): math 11% / reading 20% proficiency, ranked #155 of 174 in GA (top 89%) — low school quality limits family demand, transient renter base, plan for 1-2y turnover; 78% free/reduced lunch — lower-income household profile, screen leases tightly.
- Zoned schools: Oliver Elementary School (math 12% / reading 27%, grade F, #878 of 1,228 statewide, top 75%, 539 students, 90% FRL); Riverdale Middle School (math 12% / reading 27%, grade F, #356 of 470 statewide, top 78%, 660 students, 90% FRL); North Clayton High School (math 2% / reading 22%, grade F, #336 of 424 statewide, top 80%, 1,206 students, 90% FRL).
- Market conditions: Rents rising (+3.5%/yr); 142 active listings in the ZIP; 37 comparable units currently listed for rent nearby; rentals at typical pace (median 17d on market — plan ~3-4 weeks tenant-placement turnaround); 865 units permitted in Clayton County in 2024 (448 in 5+ unit buildings).
- This rent runs 36% of the median local income ($63k/yr) — at the standard rent-burdened threshold; future hikes will face affordability resistance.
Forward outlook
- Local home prices are declining (-3.0%/yr); year-one equity from $864 of loan paydown is wiped out by about $4k of value loss. Plan a longer hold.
- Clayton County population projected at +29% by 2050 — long-run rental-demand tailwind backs the buy-and-hold thesis.
- At projected returns (-3.0% appreciation + 3.5% rent growth), your $35k cash investment doubles in ~7 years — after that, you're playing with house money.
Negotiation context
- It's been on market 174 days — a 12% lower offer ($110k) is reasonable based on typical stale-listing flexibility.
- 6 sale attempts since 10y ago; this cycle's ask has dropped $40k (24%) from the opening price — seller is motivated, your offer sets the floor, not the list.
- Current owner paid $30k; list at $125k implies a 317% gain — meaningful room to come down on a strong offer.
Risks & watch-outs
- Climate carrying-cost: major wind risk, 27% chance of damaging wind over 30y; extreme-heat days projected 7→17/yr by 2055 (HVAC capex compounding) — expect insurance premiums to compound above CPI over the hold.
Questions for the listing agent
- It's been on market 174 days. Have you received any prior offers? Is the seller open to a 12% concession, seller financing, or rate buy-down credit?
- Why hasn't it sold? Are there any deal-killer items the seller is aware of (foundation, flood, title, zoning, code violations)?
- Is there a deadline driving the sale (1031 exchange, divorce, estate, relocation)? That informs how much negotiation room exists.
- Schools are D-rated, which usually means shorter tenancies and higher turnover. Who's the typical renter profile here, and what's been the actual vacancy rate?
- Crime grade is D in this area — have there been break-ins, vandalism, or insurance claims at this property in the last 3 years? What carrier currently insures it and at what premium?
- What's the average days-on-market for RENTAL listings here right now (not sales)? A rising rental-DOM trend means longer vacancies and softer asking-rent achievability than the comps imply.
- What's the recent tenant-quality profile in this submarket — average credit score on applications, eviction rate, late-payment / NSF rate, and stable-employment percentage? A property-management company in the area should have these aggregated.
- How much new for-sale + rental construction is in the pipeline within 1–3 miles? Heavy new supply typically softens prices + rents 12–24 months out; constrained supply supports both.
Investment metrics
- 1% rule
- 1.50% ✓
- Cap rate
- 11.53%
- Cash-on-cash
- 18.71%
- DSCR
- 1.83
- GRM
- 5.6
CMA / ARV
- ARV (on-the-fly)
- $237,360
- Comps found
- 12
Show comp detail 12 sales within ~0.75 mi
| Address | Dist | Beds/Ba | Sqft | Sold | Price | $/sf | Match |
|---|---|---|---|---|---|---|---|
| 1490 Diplomat Dr | 0.28mi | 3/2.0 | 1,204 (-7%) | 11mo | $250,000 | $208 | 67 |
| 7316 Caribou Trl | 0.43mi | 3/3.0 | 1,304 (+1%) | 13mo | $279,000 | $214 | 64 |
| 1435 Winchester Trl | 0.21mi | 4/3.0 (+1) | 1,324 (+3%) | 16mo | $233,450 | $176 | 63 |
| 7417 Fernwood Dr | 0.58mi | 3/2.0 | 1,226 (-5%) | 4mo | $262,000 | $214 | 61 |
| 1079 Salisbury Trl | 0.51mi | 3/2.0 | 1,400 (+8%) | 12mo | $195,000 | $139 | 52 |
| 1070 Salisbury Trl | 0.52mi | 3/2.0 | 1,422 (+10%) | 8mo | $172,500 | $121 | 52 |
| 6832 Shangrila Way | 0.74mi | 3/2.0 | 1,323 (+3%) | 12mo | $280,000 | $212 | 52 |
| 7281 Fernwood Dr | 0.45mi | 4/2.0 (+1) | 1,448 (+12%) | 3mo | $266,500 | $184 | 51 |
| 7337 Czar Pl | 0.62mi | 3/2.0 | 1,461 (+13%) | 1mo | $211,000 | $144 | 48 |
| 7339 Indian Hill Trl | 0.65mi | 3/2.5 | 1,176 (-9%) | 6mo | $156,000 | $133 | 48 |
| 7356 Merlin Way | 0.74mi | 4/1.5 (+1) | 1,201 (-7%) | 18mo | $235,000 | $196 | 32 |
| 7268 Merlin Way | 0.69mi | 4/2.5 (+1) | 1,441 (+12%) | 18mo | $255,000 | $177 | 26 |
Match score weights: distance 35% · size 25% · config 20% · recency 20%. Top-matched comps best support the ARV.
Projected returns pro-forma
-3.0% appreciation · 3.55% rent growth · sell at horizon
- IRR
- 11.2%
- Equity multiple
- 1.45×
- Total profit
- $15,611
- Equity at exit
- $18,638
- IRR
- 20.7%
- Equity multiple
- 2.80×
- Total profit
- $62,962
- Equity at exit
- $10,808
Cash invested: $35,000 (down + closing). Projections, not guarantees.
Landlord ↔ Tenant lean methodology
- Overall (STATE)
- 90 Strongly Landlord-Friendly
- State Georgia
- 90 Strongly Landlord-Friendly · R+3
- County
- — inherits STATE
- City
- — inherits STATE
ZIP-level market 30296
- Rents YoY
- 3.5%
- Active inventory
- 142
- Price-to-rent
- 5.6×
Monthly cashflow live
- Estimated rent
- $1,874 high interval (Pro) →
- Mortgage (P&I)
- −$656
- Tax from tax record
- −$227 /mo · $2,728/yr
- Insurance
- −$52
- HOA
- −$0
- Vacancy / Maint / Mgmt
- −$394
- Net cashflow
- $546
Break-even live
Sensitivity live
| Price | -10% $616 | -5% $581 | +0% $546 | +5% $510 | +10% $475 |
|---|---|---|---|---|---|
| Rent | -10% $398 | -5% $472 | +0% $546 | +5% $620 | +10% $694 |
| Rate | -1.0pp $609 | -0.5pp $577 | base $546 | +0.5pp $513 | +1.0pp $480 |
UW: 25.0% down · 7.5% · 30yr · 1.5% tax · 5.0% vac · 8.0% maint · 8.0% mgmt
Financing live
Cash to close
- Down payment
- $31,250
- Closing costs
- $3,750
- Reserves months
- —
- Total cash needed
- —
Loan-product check · same deal, 3 products live
Conventional
25% down · 7.5% · 30yr
- Down + closing
- —
- Monthly P&I
- —
- Monthly cashflow
- —
- DSCR
- —
- Eligible?
- —
Personal DTI + credit; lowest rate.
DSCR
20% down · 8.5% · 30yr
- Down + closing
- —
- Monthly P&I
- —
- Monthly cashflow
- —
- DSCR
- —
- Eligible?
- —
No personal income docs; deal must DSCR.
Hard money
10% down · 12.0% · 12mo
- Down + closing
- —
- Monthly P&I
- —
- Monthly cashflow
- —
- DSCR
- —
- Eligible?
- —
Short-term bridge; refi at stabilization.
Rent comps 37 comps
| Address | Beds | Baths | Sqft | Rent | $/sqft | DOM | Units | Dist |
|---|---|---|---|---|---|---|---|---|
| 7413 Penland Dr Riverdale, GA | 3.0 | 2.0 | 1422 | $2,100 | $1.48 | 45d | 1 | 0.33mi |
| 1161 Salisbury Trl Riverdale, GA | 3.0 | 2.0 | 1530 | $1,800 | $1.18 | 0d | 1 | 0.37mi |
| 7324 Caribou Trl Riverdale, GA | 3.0 | 2.0 | 1312 | $1,631 | $1.24 | 45d | 1 | 0.44mi |
| 7254 Fernwood Dr Riverdale, GA | 3.0 | 2.0 | 1272 | $1,765 | $1.39 | 26d | 1 | 0.47mi |
| 7037 Dalmatia Dr Riverdale, GA | 4.0 | 3.0 | 1674 | $1,976 | $1.18 | 45d | 1 | 0.50mi |
| 1070 Salisbury Trl Riverdale, GA | 3.0 | 2.0 | 1422 | $1,735 | $1.22 | 0d | 1 | 0.54mi |
| 1471 Riverrock Trl Riverdale, GA | 3.0 | 2.5 | 1526 | $1,675 | $1.10 | 45d | 1 | 0.57mi |
| 7620 Creekside Ln Riverdale, GA | 4.0 | 2.5 | 1520 | $1,695 | $1.12 | 26d | 1 | 0.61mi |
| 7620 Creekside Ln Riverdale, GA | 4.0 | 2.5 | 1520 | $1,795 | $1.18 | 45d | 1 | 0.61mi |
| 7299 Indian Hill Trl Riverdale, GA | 4.0 | 2.5 | 1201 | $1,900 | $1.58 | 45d | 1 | 0.62mi |
| 1462 Riverrock Ct Riverdale, GA | 3.0 | 2.5 | 1620 | $1,715 | $1.06 | 0d | 1 | 0.64mi |
| 7272 Indian Hill Trl Riverdale, GA | 3.0 | 2.0 | 1416 | $1,787 | $1.26 | 6d | 1 | 0.65mi |
| 7545 Broadhurst Dr Riverdale, GA | 3.0 | 2.0 | 1561 | $1,945 | $1.25 | 26d | 1 | 0.69mi |
| 1051 Scott Rd Riverdale, GA | 3.0 | 2.0 | 1852 | $1,674 | $0.90 | 3d | 1 | 0.70mi |
| 1645 Hebron Ln Unit Top Floor Riverdale, GA | 3.0 | 2.0 | 1539 | $2,400 | $1.56 | 45d | 1 | 0.77mi |
| 3040 Highway 138 SW Fayetteville, GA | 3.0 | 1.0 | 991 | $1,515 | $1.53 | 0d | 1 | 0.78mi |
| 7567 Sugarcreek Dr Riverdale, GA | 2.0 | 1.0 | 1517 | $1,700 | $1.12 | 45d | 1 | 0.83mi |
| 7605 Briar Crest Ct Riverdale, GA | 3.0 | 2.5 | 1478 | $2,010 | $1.36 | 45d | 1 | 0.84mi |
| 1103 Briar Cove Ct Riverdale, GA | 4.0 | 2.5 | 1523 | $2,080 | $1.37 | 6d | 1 | 0.87mi |
| 6989 Cedar Dr Riverdale, GA | 3.0 | 2.0 | 1536 | $1,680 | $1.09 | 3d | 1 | 0.91mi |
| 7345 Chaucer Ct Riverdale, GA | 3.0 | 2.0 | 1524 | $1,745 | $1.15 | 0d | 1 | 0.96mi |
| 7345 Chaucer Ct Riverdale, GA | 3.0 | 2.0 | 1524 | $1,745 | $1.15 | 17d | 1 | 0.96mi |
| 1327 Hollenbeck Ln Riverdale, GA | 2.0 | 1.5 | 1360 | $1,750 | $1.29 | 0d | 1 | 0.98mi |
| 6704 Amesbury Ln Riverdale, GA | 3.0 | 2.0 | 1654 | $1,985 | $1.20 | 45d | 1 | 1.00mi |
| 7319 Exeter Ct Riverdale, GA | 3.0 | 2.0 | 1592 | $1,774 | $1.11 | 22d | 1 | 1.00mi |
| 6635 Autumn West Dr Riverdale, GA | 3.0 | 2.0 | 1728 | $1,840 | $1.06 | 26d | 1 | 1.07mi |
| 839 River Glen Pl Riverdale, GA | 3.0 | 2.0 | 1414 | $1,870 | $1.32 | 7d | 1 | 1.18mi |
| 1000 Lake Ridge Pkwy Unit 0501 Riverdale, GA | 2.0 | 2.0 | 1036 | $1,414 | $1.36 | 5d | 1 | 1.26mi |
| 2003 Echota Way Riverdale, GA | 3.0 | 2.0 | 1449 | $1,750 | $1.21 | 45d | 1 | 1.27mi |
| 1973 Bethsaida Rd Riverdale, GA | 2.0 | 2.0 | 1000 | $2,650 | $2.65 | 0d | 1 | 1.27mi |
| 1973 Bethsaida Rd Riverdale, GA | 2.0 | 2.0 | 1000 | $2,650 | $2.65 | 3d | 1 | 1.27mi |
| 1000 Lake Ridge Pkwy Riverdale, GA | 1.0–3.0 | 1.0–2.0 | 1016 | $1,764 | $1.74 | 45d | 25 | 1.28mi |
| 1000 Lake Ridge Pkwy Riverdale, GA | 2.0 | 2.0 | 1036 | $1,610 | $1.55 | 26d | 1 | 1.28mi |
| 7301 Fern Ct Riverdale, GA | 3.0 | 3.0 | 1325 | $1,909 | $1.44 | 6d | 1 | 1.36mi |
| 6554 River Glen Dr Riverdale, GA | 3.0 | 2.5 | 1634 | $1,861 | $1.14 | 7d | 1 | 1.40mi |
| 950 Lake Ridge Pkwy Riverdale, GA | 1.0–2.0 | 1.0–2.0 | 966 | $1,457 | $1.51 | 0d | 30 | 1.41mi |
| 1019 River Stone Ct Riverdale, GA | 3.0 | 2.0 | 1228 | $1,715 | $1.40 | 17d | 1 | 1.41mi |
Listing history 32 events
-
2026-04-22status Under Contract
-
2026-04-06price $125,000
-
2026-02-17price $130,000
-
2026-01-06price $140,000
-
2025-11-13price $150,000
-
2025-10-29historical
-
2025-10-09price $155,000
-
2025-08-04$155,000 New
-
2025-08-04$165,000 New
-
2025-03-28historical
-
2025-03-12price $169,000
-
2025-02-25price $179,900
-
2025-01-14price $189,900
-
2025-01-01price $199,000
-
2024-11-29$207,000 New
-
2019-08-01historical
-
2019-04-08$107,000 New
-
2016-12-15soldstatus $30,000 Sold
-
2016-12-15soldstatus $30,000 Sold
-
2016-12-06historical Pending
-
2016-12-04status Under Contract
-
2016-10-28price $39,900
-
2016-10-28price $39,900
-
2016-10-11price $47,500
-
2016-10-10price $47,500
-
2016-09-08price $54,000
-
2016-09-08price $54,000
-
2016-08-08$61,000 Active
-
2016-08-08$61,000 New
-
1992-10-01soldstatus $65,033
-
1992-09-01soldstatus $59,000
-
1988-09-19soldstatus $59,000
ⓘ Source: listings_history table (triggers on properties + properties_extension) + one-shot
backfill from property_details.listing_events for pre-trigger history.
Tax reassessment forecast GA · Resets to sale price
- Current annual tax
- $2,728 · $227/mo
- Projected year-2 tax
- $2,728 · $227/mo
- Expected delta
- $0/yr ($0/mo · 0.0%)
ⓘ Screening estimate from a state-policy table — verify with the county assessor before closing.
Climate risk First Street
- Flood 1/10 Low FEMA zone X (unshaded) · 0% chance over 30 yrs
- Wildfire 3/10 Moderate
- Heat 5/10 Major 7 d/yr ≥105°F today · 17 d/yr by 30 yrs out
- Wind 6/10 Major 27% chance of damaging wind over 30 yrs
- Air quality 4/10 Moderate 4 unhealthy d/yr today · 7 by 30 yrs out
Nearby sold comps map
Loading sold comps map…
Walkable amenities ~0.75 mi
Loading nearby amenities…
Taxation est. · year 1
- Rental income
- $22,490
- − Mortgage interest
- −$7,002
- − Property taxes
- −$2,728
- − Insurance
- −$625
- − Repairs & maintenance
- −$1,799
- − Management
- −$1,799
- − Depreciation
- −$3,636
- Taxable income
- $4,900
- Est. tax owed @ 24.0%
- −$1,176
- After-tax cash flow
- $5,372/yr
For passive investors: Depreciation is non-cash, so a rental often shows a tax loss while cash-flowing — sheltering income. Rental losses are passive: they offset passive income freely, and up to $25,000/yr can offset ordinary (W-2) income if you actively participate and your MAGI is under $100k (phasing out to $0 by $150k); unused losses carry forward. On sale, claimed depreciation is recaptured at up to 25%, and gains may owe capital-gains tax (a 1031 exchange can defer both). Figures are a year-1 estimate at your 24.0% rate — not tax advice; consult a CPA.
Schools (NCES district)
- District
- Clayton County
- NCES district ID
- 1301230
- Math proficiency
- 11% ▼ -13.00%
- Reading proficiency
- 20% ▼ -9.00%
- Median HH income
- $42,266
- Composite
- 13.41/100
- National rank
- #9527
- State rank
- #155 of 174 in GA
Livability — Riverdale
- Score
- 70/100
- State rank
- #100
- US rank
- #7907
Category grades
Schools grade is shown separately in the Schools card above.
Census & demographics
- County
- Clayton County · 230,153 people
- City population
- 61,126
- Metro
- Atlanta-Sandy Springs-Alpharetta, GA
- Population (ZIP)
- 27,045
- Household income
- $63,292
- Rent vs Own
- Severe rent burden
- 1400.0
Population outlook (Clayton County) Hauer SSP2
- Today (2025)
- 310,777 people
- By 2030
- 329,762 · +6.1%
- By 2040
- 368,052 · +18.4%
- By 2050
- 401,196 · +29.1%
- By 2075
- 472,488 · +52.0%
- By 2100
- 500,446 · +61.0%
Race, ethnicity, and origin ACS 2023
- Neighborhood character
- Predominantly Black (81%)
- Race & ethnicity
- Black 81% Hispanic / Latino 10% White 4% Asian 4% Two or more races 4%
- Hispanic origin (detail)
- Mexican 7%
- Common ancestry
- Hispanic 2%
- Foreign-born
- 14% · Canada, China, Vietnam
- Languages at home
- 80% English-only · Spanish 9% Chinese 3% French/Haitian/Cajun 2%
Political lean MEDSL · Clayton
- 2024 margin
- Solid D (+69.2) · D 84.3% · R 15.1%
- 2008→2024 swing
- +2.8pp toward D · 2008: 66.4pp · 2024: 69.2pp
- All cycles
- 2024: D+69.2 2020: D+70.9 2016: D+71.9 2012: D+70.1 2008: D+66.4
Not yet ingested
- Civics
- —
Market trends
- HPI YoY
- ▼ -137.25%
- Current HPI
- 209.7527
- Rent YoY
- ▲ 3.55%
- Metro
- Atlanta-Sandy Springs-Alpharetta, GA
- State GDP YoY
- ▲ 2.66%
- F500 in state
- 28
Industry mix (Fortune 500 HQ in GA)
| Industry | F500 HQs | Revenue |
|---|---|---|
| Paper / Packaging | 2 | $29B |
|
||
| Retail | 1 | $160B |
|
||
| Transportation / Logistics | 1 | $91B |
|
||
| Airlines | 1 | $62B |
|
||
| Consumer Goods | 1 | $47B |
|
||
| Utilities | 1 | $25B |
|
||
Price history
+111.9% since first listed32 events — show timeline
- 2026-04-22 Pending — GAMLS
- 2026-04-06 Price Changed $125,000 GAMLS
- 2026-02-17 Price Changed $130,000 GAMLS
- 2026-01-06 Price Changed $140,000 GAMLS
- 2025-11-13 Price Changed $150,000 GAMLS
- 2025-10-29 Listing Removed — GAMLS
- 2025-10-09 Price Changed $155,000 GAMLS
- 2025-08-04 Listed $165,000 GAMLS
- 2025-08-04 Listed $155,000 GAMLS
- 2025-03-28 Listing Removed — GAMLS
- 2025-03-12 Price Changed $169,000 GAMLS
- 2025-02-25 Price Changed $179,900 GAMLS
- 2025-01-14 Price Changed $189,900 GAMLS
- 2025-01-01 Price Changed $199,000 GAMLS
- 2024-11-29 Listed $207,000 GAMLS
- 2019-08-01 Listing Removed — GAMLS
- 2019-04-08 Listed $107,000 GAMLS
- 2016-12-15 Sold (MLS) $30,000 GAMLS
- 2016-12-15 Sold (MLS) $30,000 FMLS
- 2016-12-06 Contingent — FMLS
- 2016-12-04 Pending — GAMLS
- 2016-10-28 Price Changed $39,900 GAMLS
- 2016-10-28 Price Changed $39,900 FMLS
- 2016-10-11 Price Changed $47,500 GAMLS
- 2016-10-10 Price Changed $47,500 FMLS
- 2016-09-08 Price Changed $54,000 GAMLS
- 2016-09-08 Price Changed $54,000 FMLS
- 2016-08-08 Listed $61,000 FMLS
- 2016-08-08 Listed $61,000 GAMLS
- 1992-10-01 Sold (Public Records) $65,033 Public Records
- 1992-09-01 Sold (Public Records) $59,000 Public Records
- 1988-09-19 Sold (Public Records) $59,000 Public Records
Property tax history
+4.2%/yrLatest (2025): $2,728 · -4.3% YoY. Source: county tax records.
Cash-flow waterfall
monthlySold comps — $/sqft
last 12 mo · ≤1 miLoading sold comps…