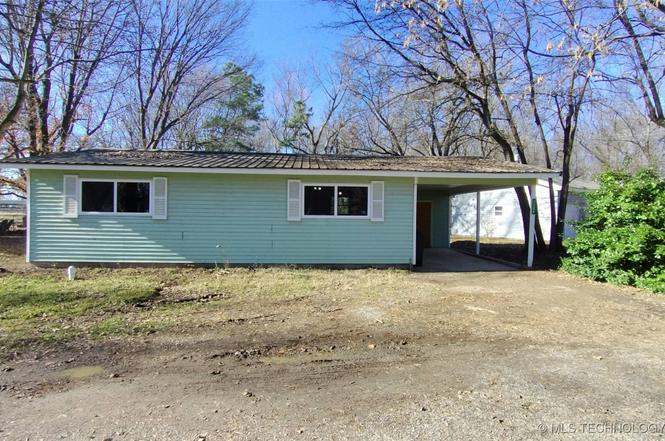
1358 Shady Ln · Westville, OK
Flood risk 1/10 · Minimal
- FEMA flood zone
- X (unshaded)
- Chance of flooding over 30 yrs
- 0.0%
- Est. flood insurance / yr
- $507 – $1,088
Fire risk 7/10 · Major
- Est. fire insurance / yr
- $2,463 – $4,575
Heat risk 5/10 · Moderate
- Hot days now (above 106°F)
- 7 days/yr
- Hot days in 30 yrs
- 19 days/yr
Wind risk 2/10 · Minimal
- Chance of severe wind over 30 yrs
- 3.0%
Air-quality risk 2/10 · Minimal
- Unhealthy air days now
- 1 days/yr
- Unhealthy air days in 30 yrs
- 1 days/yr
Risk factors via First Street. Map © Google.
Why this score? — see what drove the C grade
The composite is a weighted blend of 9 inputs, each scored 0–100. Each bar is that input's sub-score; the figure is the points it added to the 100-point composite (weight × sub-score).
- Cash flow +18.0/30.0
- ARV discount +15.0/15.0
- Appreciation +6.2/10.0
- DSCR +5.7/10.0
- 1% rule +4.8/10.0
- Livability +2.8/5.0
- Rent growth +2.5/5.0
- Condition / age +2.5/5.0
- Schools +1.1/10.0
$89,995
🖨 Deal sheet (PDF) 📄 Offer letter ✓ Due diligence
Listing remarks
Charming 2 Bed, 1 Bath Home with a in a Prime In-Town Location! Recently updated and move-in ready, this cozy home is perfect for first-time buyers, those looking to downsize, or investors seeking a great rental opportunity. Enjoy the convenience of an attached carport with a storage room, offering extra space for tools, outdoor gear, or seasonal items. The large backyard provides plenty of room for kids to play or pets to roam, and is a great canvas for your outdoor entertaining ideas. Located within walking distance to the city park, splash pad, and a revitalizing downtown area where exciting new upgrades are underway. Just 20 minutes from Siloam Springs, providing quick access to shopp
Key facts
- Storage room
- Attached carport
- Large backyard
Tags
Neighborhood map
What this means for you Summary
Snapshot
- This is a 2-bed/1.0-bath single-family listed at $90k.
Deal economics
- At list price, monthly cash flow is $78 ($937/yr) — positive.
- The deal already cash-flows at list — no discount required.
- To meet the 1% rule (rent ≥ 1% of price), the offer needs to be $89k (1.5% below list).
- Recommended offer: $89k (1.5% below list) — sets the bar for 1% rule.
Location & tenants
- Location reads 56/100 on livability (#500 in OK) — a working-class tenant base; expect higher turnover. Strengths: cost of living A+, housing A+; Watch: schools F, crime F, amenities F.
- Westville (rural): math 10% / reading 16% proficiency, ranked #244 of 270 in OK (top 90%) — low school quality limits family demand, transient renter base, plan for 1-2y turnover; 69% free/reduced lunch — lower-income household profile, screen leases tightly.
- Market conditions: 60 active listings in the ZIP; 30 units permitted in Adair County in 2024 (0 in 5+ unit buildings).
Forward outlook
- In year one you build about $3k of equity ($622 loan paydown + $2k appreciation (2.4% local appreciation)).
- Adair County population projected at -18% by 2050 — secular population decline; favor cash flow + early exit over multi-decade hold.
- At projected returns (2.4% appreciation + 3.0% rent growth), your $25k cash investment doubles in ~6 years — after that, you're playing with house money.
Negotiation context
- Only 6 days on market — expect competitive offers; lowballing is unlikely to land.
Risks & watch-outs
- Watch-outs: built in 1955 — expect roof / HVAC / electrical / plumbing capex.
- Climate carrying-cost: major wildfire risk; extreme-heat days projected 7→19/yr by 2055 (HVAC capex compounding) — expect insurance premiums to compound above CPI over the hold.
Questions for the listing agent
- Built in 1955 — when were the roof, HVAC, electrical panel, plumbing, and water heater last replaced?
- Is there a deadline driving the sale (1031 exchange, divorce, estate, relocation)? That informs how much negotiation room exists.
- Schools are F-rated, which usually means shorter tenancies and higher turnover. Who's the typical renter profile here, and what's been the actual vacancy rate?
- Crime grade is F in this area — have there been break-ins, vandalism, or insurance claims at this property in the last 3 years? What carrier currently insures it and at what premium?
- What's the average days-on-market for RENTAL listings here right now (not sales)? A rising rental-DOM trend means longer vacancies and softer asking-rent achievability than the comps imply.
- What's the recent tenant-quality profile in this submarket — average credit score on applications, eviction rate, late-payment / NSF rate, and stable-employment percentage? A property-management company in the area should have these aggregated.
- How much new for-sale + rental construction is in the pipeline within 1–3 miles? Heavy new supply typically softens prices + rents 12–24 months out; constrained supply supports both.
Investment metrics
- 1% rule
- 0.98% ✗
- Cap rate
- 7.33%
- Cash-on-cash
- 3.72%
- DSCR
- 1.17
- GRM
- 8.5
CMA / ARV
- ARV (on-the-fly)
- $164,996
- Comps found
- 12
Show comp detail 12 sales within ~0.75 mi
| Address | Dist | Beds/Ba | Sqft | Sold | Price | $/sf | Match |
|---|---|---|---|---|---|---|---|
| 115 Shady Ln | 0.02mi | 3/1.0 (+1) | 1,028 (+4%) | 0mo | $132,000 | $128 | 87 |
| 1118 N Locust Ave | 0.25mi | 2/1.0 | 952 (-4%) | 4mo | $175,000 | $184 | 79 |
| 1791 Buffington Rd | 0.46mi | 3/2.0 (+1) | 1,040 (+5%) | 1mo | $174,000 | $167 | 60 |
| 1789 Buffington Rd | 0.46mi | 3/2.0 (+1) | 1,040 (+5%) | 6mo | $179,900 | $173 | 56 |
| 1256 W Pine St | 0.49mi | 3/1.5 (+1) | 1,008 (+2%) | 20mo | $116,000 | $115 | 51 |
| 1512 S Locust St | 0.52mi | 3/1.5 (+1) | 1,040 (+5%) | 13mo | $179,900 | $173 | 49 |
| 1677 S 1st St | 0.74mi | 3/2.0 (+1) | 1,040 (+5%) | 3mo | $180,370 | $173 | 46 |
| 1685 S 1st St | 0.75mi | 3/2.0 (+1) | 1,040 (+5%) | 10mo | $183,000 | $176 | 40 |
| 1202 E Pine St | 0.48mi | 3/1.0 (+1) | 1,092 (+10%) | 19mo | $113,500 | $104 | 40 |
| 1543 Maple Ave | 0.65mi | 3/1.0 (+1) | 863 (-13%) | 9mo | $21,000 | $24 | 36 |
| 839 Clara St | 0.66mi | 3/1.0 (+1) | 1,118 (+13%) | 10mo | $142,500 | $127 | 34 |
| 1712 S Locust Ave | 0.75mi | 1/2.0 (-1) | 896 (-9%) | 12mo | $117,500 | $131 | 31 |
Match score weights: distance 35% · size 25% · config 20% · recency 20%. Top-matched comps best support the ARV.
Projected returns pro-forma
2.44% appreciation · 3.0% rent growth · sell at horizon
- IRR
- 9.4%
- Equity multiple
- 1.52×
- Total profit
- $13,170
- Equity at exit
- $37,638
- IRR
- 12.2%
- Equity multiple
- 2.72×
- Total profit
- $43,329
- Equity at exit
- $55,895
Cash invested: $25,199 (down + closing). Projections, not guarantees.
Landlord ↔ Tenant lean methodology
- Overall (STATE)
- 83 Strongly Landlord-Friendly
- State Oklahoma
- 83 Strongly Landlord-Friendly · R+20
- County
- — inherits STATE
- City
- — inherits STATE
ZIP-level market 74965
- Home prices YoY
- 0.8%
- Active inventory
- 60
- Price-to-rent
- 8.5×
Monthly cashflow live
- Estimated rent
- $886 medium interval (Pro) →
- Mortgage (P&I)
- −$472
- Tax est. 1.5%
- −$112 /mo · $1,350/yr
- Insurance
- −$37
- HOA
- −$0
- Vacancy / Maint / Mgmt
- −$186
- Net cashflow
- $78
Break-even live
Sensitivity live
| Price | -10% $140 | -5% $109 | +0% $78 | +5% $47 | +10% $16 |
|---|---|---|---|---|---|
| Rent | -10% $8 | -5% $43 | +0% $78 | +5% $113 | +10% $148 |
| Rate | -1.0pp $123 | -0.5pp $101 | base $78 | +0.5pp $55 | +1.0pp $31 |
UW: 25.0% down · 7.5% · 30yr · 1.5% tax · 5.0% vac · 8.0% maint · 8.0% mgmt
Financing live
Cash to close
- Down payment
- $22,499
- Closing costs
- $2,700
- Reserves months
- —
- Total cash needed
- —
Loan-product check · same deal, 3 products live
Conventional
25% down · 7.5% · 30yr
- Down + closing
- —
- Monthly P&I
- —
- Monthly cashflow
- —
- DSCR
- —
- Eligible?
- —
Personal DTI + credit; lowest rate.
DSCR
20% down · 8.5% · 30yr
- Down + closing
- —
- Monthly P&I
- —
- Monthly cashflow
- —
- DSCR
- —
- Eligible?
- —
No personal income docs; deal must DSCR.
Hard money
10% down · 12.0% · 12mo
- Down + closing
- —
- Monthly P&I
- —
- Monthly cashflow
- —
- DSCR
- —
- Eligible?
- —
Short-term bridge; refi at stabilization.
Listing history 2 events
-
2025-12-11status Pending
-
2025-12-05$89,995 Active
ⓘ Source: listings_history table (triggers on properties + properties_extension) + one-shot
backfill from property_details.listing_events for pre-trigger history.
Climate risk First Street
- Flood 1/10 Low FEMA zone X (unshaded) · 0% chance over 30 yrs
- Wildfire 7/10 Severe
- Heat 5/10 Major 7 d/yr ≥106°F today · 19 d/yr by 30 yrs out
- Wind 2/10 Low 3% chance of damaging wind over 30 yrs
- Air quality 2/10 Low 1 unhealthy d/yr today · 1 by 30 yrs out
Nearby sold comps map
Loading sold comps map…
Walkable amenities ~0.75 mi
Loading nearby amenities…
Taxation est. · year 1
- Rental income
- $10,633
- − Mortgage interest
- −$5,041
- − Property taxes
- −$1,350
- − Insurance
- −$450
- − Repairs & maintenance
- −$851
- − Management
- −$851
- − Depreciation
- −$2,618
- Taxable loss
- −$527
- Est. tax savings @ 24.0%
- +$127
- After-tax cash flow
- $1,064/yr
For passive investors: Depreciation is non-cash, so a rental often shows a tax loss while cash-flowing — sheltering income. Rental losses are passive: they offset passive income freely, and up to $25,000/yr can offset ordinary (W-2) income if you actively participate and your MAGI is under $100k (phasing out to $0 by $150k); unused losses carry forward. On sale, claimed depreciation is recaptured at up to 25%, and gains may owe capital-gains tax (a 1031 exchange can defer both). Figures are a year-1 estimate at your 24.0% rate — not tax advice; consult a CPA.
Schools (NCES district)
- District
- Westville
- NCES district ID
- 4032400
- Math proficiency
- 10% ▼ -17.00%
- Reading proficiency
- 16% ▼ -11.00%
- Median HH income
- $35,223
- Composite
- 10.68/100
- National rank
- #9771
- State rank
- #244 of 270 in OK
Livability — Westville
- Score
- 56/100
- State rank
- #500
- US rank
- #22420
Category grades
Schools grade is shown separately in the Schools card above.
Census & demographics
- Census place
- Westville, OK
- Population (ZIP)
- 4,964
Population outlook (Adair County) Hauer SSP2
- Today (2025)
- 20,805 people
- By 2030
- 20,073 · -3.5%
- By 2040
- 18,496 · -11.1%
- By 2050
- 16,970 · -18.4%
- By 2075
- 14,011 · -32.7%
- By 2100
- 12,211 · -41.3%
Race, ethnicity, and origin ACS 2023
- Neighborhood character
- Highly diverse neighborhood (Simpson 0.71)
- Race & ethnicity
- White 53% Native American 27% Two or more races 10% Hispanic / Latino 8% Asian 2%
- Hispanic origin (detail)
- Mexican 8%
- Common ancestry
- Portuguese 1% European 1% Lithuanian 1%
- Foreign-born
- 2% · Canada
- Languages at home
- 96% English-only · Spanish 2% Other Asian/Pacific 1%
Political lean MEDSL · Adair
- 2024 margin
- Solid R (+63.0) · D 17.8% · R 80.8% · Other 1.5%
- 2008→2024 swing
- -24.3pp toward R · 2008: -38.7pp · 2024: -63.0pp
- All cycles
- 2024: R+63.0 2020: R+59.1 2016: R+52.2 2012: R+34.8 2008: R+38.7
Not yet ingested
- Civics
- —
Market trends
- HPI YoY
- ▲ 2.44%
- Current HPI
- 317.0133
- Rent YoY
- —
- Metro
- —
- State GDP YoY
- ▲ 1.55%
- F500 in state
- 6
Industry mix (Fortune 500 HQ in OK)
| Industry | F500 HQs | Revenue |
|---|---|---|
| Energy | 3 | $48B |
|
||
Price history
2 events — show timeline
- 2025-12-11 Pending — MLS Technology, Inc.
- 2025-12-05 Listed $89,995 MLS Technology, Inc.
Cash-flow waterfall
monthlySold comps — $/sqft
last 12 mo · ≤1 miLoading sold comps…