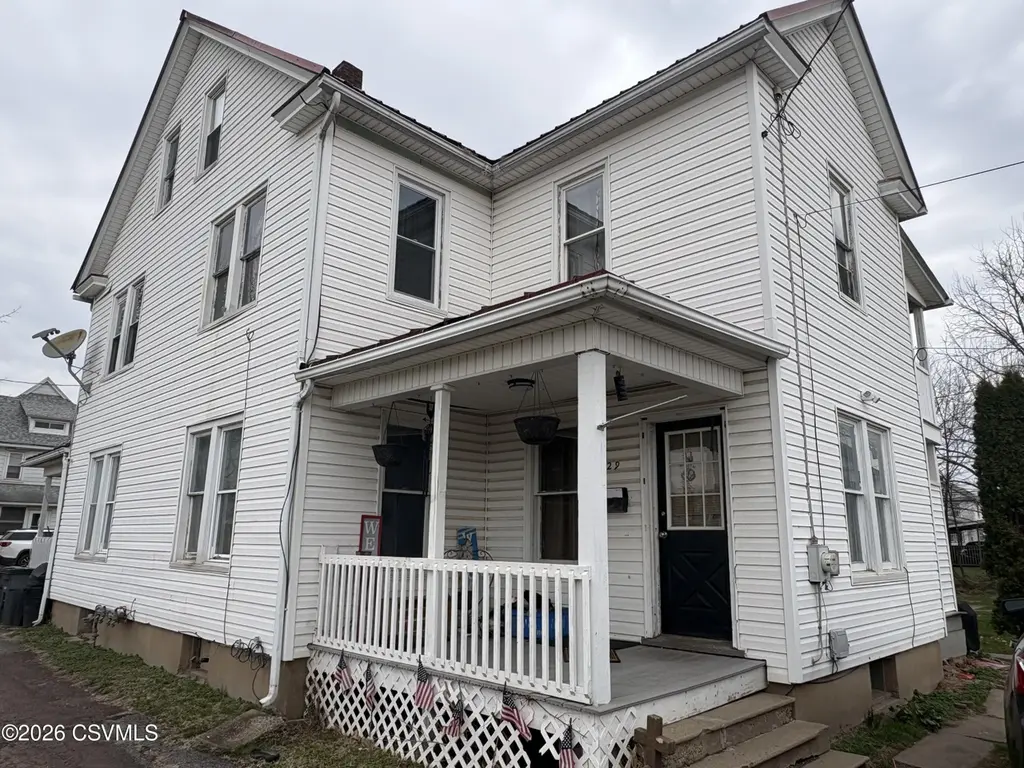
227-229 Mary Ave · Bloomsburg, PA
Flood risk 9/10 · Severe
- FEMA flood zone
- AE
- Chance of flooding over 30 yrs
- 0.99%
- Est. flood insurance / yr
- $2,026 – $9,024
Fire risk 1/10 · Minimal
- Est. fire insurance / yr
- $511 – $949
Heat risk 4/10 · Minor
- Hot days now (above 98°F)
- 7 days/yr
- Hot days in 30 yrs
- 16 days/yr
Wind risk 2/10 · Minimal
- Chance of severe wind over 30 yrs
- 3.0%
Air-quality risk 2/10 · Minimal
- Unhealthy air days now
- 1 days/yr
- Unhealthy air days in 30 yrs
- 2 days/yr
Risk factors via First Street. Map © Google.
Why this score? — see what drove the C+ grade
The composite is a weighted blend of 9 inputs, each scored 0–100. Each bar is that input's sub-score; the figure is the points it added to the 100-point composite (weight × sub-score).
- Cash flow +19.6/30.0
- ARV discount +15.0/15.0
- DSCR +6.2/10.0
- 1% rule +5.7/10.0
- Rent growth +4.2/5.0
- Livability +4.1/5.0
- Schools +3.7/10.0
- Condition / age +2.5/5.0
- Appreciation +0.0/10.0
$165,000
🖨 Deal sheet 📄 Offer letter ✓ Due diligence
Listing remarks MLS
Investors check out this duplex with long-term tenants in place and a consistent rental income, offering solid potential for the right buyer. Ideal for investors looking for a project with immediate income and room for improvement. The detached garage also provides additional income.
Key facts
- Detached garage
- 4,791 sq ft lot
- Garage
Tags
Neighborhood map
What this means for you Summary
Snapshot
- This is a 6-bed/2.0-bath other listed at $165k.
Deal economics
- At list price, monthly cash flow is $-269 ($-3k/yr) — negative.
- To cash-flow at today's rent, offer at most $117k (28.8% below list).
- Meets the 1% rule at list price ($2k rent vs $165k).
- Recommended offer: $117k (28.8% below list) — sets the bar for cash-flow.
- Cap rate 7.7% vs local median 3.8% in Bloomsburg — top-decile yield for the area; either an underpriced asset or a hidden risk that comps aren't pricing in. Stress-test before assuming the spread holds.
Location & tenants
- Location reads 82/100 on livability (#147 in PA, #1,183 nationally) — a professional / high-income tenant draw. Strengths: amenities A+, cost of living A+, housing A+; Watch: employment D, commute F.
- Bloomsburg Area SD (urban): math 33% / reading 57% proficiency, ranked #289 of 539 in PA (top 54%) — families likely to look elsewhere, expect single-tenant / working-renter base with shorter leases.
- Market conditions: Rents rising fast (+6.8%/yr); 121 active listings in the ZIP; 82 units permitted in Columbia County in 2024 (0 in 5+ unit buildings).
- This rent runs 31% of the median local income ($68k/yr) — at the standard rent-burdened threshold; future hikes will face affordability resistance.
Forward outlook
- Local home prices are declining (-3.0%/yr); year-one equity from $1k of loan paydown is wiped out by about $5k of value loss. Plan a longer hold.
- Columbia County population projected at -12% by 2050 — secular population decline; favor cash flow + early exit over multi-decade hold.
Negotiation context
- It's been on market 90 days — a 6% lower offer ($155k) is reasonable based on typical stale-listing flexibility.
Risks & watch-outs
- Watch-outs: flood insurance adds $460/mo; built in 1900 — expect roof / HVAC / electrical / plumbing capex.
- Climate carrying-cost: in FEMA flood zone AE (mandatory federal flood insurance) — expect insurance premiums to compound above CPI over the hold.
Questions for the listing agent
- What do current leases actually rent for vs. the listed asking? Can we see a recent rent roll and the last 12 months of T-12 income?
- It's been on market 90 days. Have you received any prior offers? Is the seller open to a 29% concession, seller financing, or rate buy-down credit?
- Built in 1900 — when were the roof, HVAC, electrical panel, plumbing, and water heater last replaced?
- What's the actual annual flood-insurance premium (NFIP or private), and is the property in a SFHA with mandatory coverage?
- Why hasn't it sold? Are there any deal-killer items the seller is aware of (foundation, flood, title, zoning, code violations)?
- Is there a deadline driving the sale (1031 exchange, divorce, estate, relocation)? That informs how much negotiation room exists.
- Schools are B-rated — typically a magnet for longer-tenancy family renters. What's the average tenant stay here, and is there a school-zone premium baked into asking?
- What's the average days-on-market for RENTAL listings here right now (not sales)? A rising rental-DOM trend means longer vacancies and softer asking-rent achievability than the comps imply.
- What's the recent tenant-quality profile in this submarket — average credit score on applications, eviction rate, late-payment / NSF rate, and stable-employment percentage? A property-management company in the area should have these aggregated.
- How much new for-sale + rental construction is in the pipeline within 1–3 miles? Heavy new supply typically softens prices + rents 12–24 months out; constrained supply supports both.
Investment metrics
- 1% rule
- 1.07% ✓
- Cap rate
- 7.68%
- Cash-on-cash
- 4.97%
- DSCR
- 1.22
- GRM
- 7.8
CMA / ARV
- ARV (median comp)
- $220,113
- List price
- $165,000
- Delta
- -25.04%
- Verdict
- UNDERPRICED
- Comps
- 20 within 1.0 mi
Projected returns pro-forma
-3.0% appreciation · 6.8% rent growth · sell at horizon
- IRR
- -21.8%
- Equity multiple
- 0.21×
- Total profit
- $-36,537
- Equity at exit
- $24,602
- IRR
- -5.8%
- Equity multiple
- 0.54×
- Total profit
- $-21,449
- Equity at exit
- $14,266
Cash invested: $46,200 (down + closing). Projections, not guarantees.
Landlord ↔ Tenant lean methodology
- Overall (STATE)
- 62 Landlord-Friendly
- State Pennsylvania
- 62 Landlord-Friendly · EVEN
- County
- — inherits STATE
- City
- — inherits STATE
ZIP-level market 17815
- Home prices YoY
- -33.0%
- Rents YoY
- 6.8%
- Active inventory
- 121
- Price-to-rent
- 7.8×
Monthly cashflow live
- Estimated rent
- $1,761 medium interval (Pro) →
- Mortgage (P&I)
- −$865
- Tax from tax record
- −$266 /mo · $3,194/yr
- Insurance
- −$69
- Flood insurance flood zone
- −$460 /mo · $5,525/yr
- HOA
- −$0
- Vacancy / Maint / Mgmt
- −$370
- Net cashflow
- $-269
Break-even live
UW: 25.0% down · 7.5% · 30yr · 1.5% tax · 5.0% vac · 8.0% maint · 8.0% mgmt
Financing live
Cash to close
- Down payment
- $41,250
- Closing costs
- $4,950
- Reserves months
- —
- Total cash needed
- —
Loan-product check · same deal, 3 products live
Conventional
25% down · 7.5% · 30yr
- Down + closing
- —
- Monthly P&I
- —
- Monthly cashflow
- —
- DSCR
- —
- Eligible?
- —
Personal DTI + credit; lowest rate.
DSCR
20% down · 8.5% · 30yr
- Down + closing
- —
- Monthly P&I
- —
- Monthly cashflow
- —
- DSCR
- —
- Eligible?
- —
No personal income docs; deal must DSCR.
Hard money
10% down · 12.0% · 12mo
- Down + closing
- —
- Monthly P&I
- —
- Monthly cashflow
- —
- DSCR
- —
- Eligible?
- —
Short-term bridge; refi at stabilization.
Listing history 20 events
-
2026-06-19days on market $165,000 Active 90 DOM
-
2026-06-18days on market $165,000 Active 89 DOM
-
2026-06-17days on market $165,000 Active 88 DOM
-
2026-06-16days on market $165,000 Active 87 DOM
-
2026-06-15days on market $165,000 Active 86 DOM
-
2026-06-14days on market $165,000 Active 84 DOM
-
2026-06-12days on market $165,000 Active 83 DOM
-
2026-06-09days on market $165,000 Active 80 DOM
-
2026-06-08days on market $165,000 Active 79 DOM
-
2026-06-07days on market $165,000 Active 78 DOM
-
2026-06-05days on market $165,000 Active 75 DOM
-
2026-06-02days on market $165,000 Active 73 DOM
-
2026-06-01days on market $165,000 Active 72 DOM
-
2026-05-31days on market $165,000 Active 71 DOM
-
2026-05-30days on market $165,000 Active 70 DOM
-
2026-03-20$172,500 Active 284-char remark
Show marketing remark (284 chars)
Investors check out this duplex with long-term tenants in place and a consistent rental income, offering solid potential for the right buyer. Ideal for investors looking for a project with immediate income and room for improvement. The detached garage also provides additional income.
-
2022-02-08soldstatus $700,000
-
2014-07-24soldstatus $423,738
-
2012-07-02soldstatus $103,000
-
2009-08-27soldstatus $68,000
ⓘ Source: listings_history table (triggers on properties + properties_extension) + one-shot
backfill from property_details.listing_events for pre-trigger history.
Tax reassessment forecast PA · Partial reset (capped growth)
- Current annual tax
- $3,194 · $266/mo
- Projected year-2 tax
- $3,194 · $266/mo
- Expected delta
- $0/yr ($0/mo · 0.0%)
ⓘ Screening estimate from a state-policy table — verify with the county assessor before closing.
Climate risk First Street
- Flood 9/10 Extreme FEMA zone AE · 99% chance over 30 yrs
- Wildfire 1/10 Low
- Heat 4/10 Moderate 7 d/yr ≥98°F today · 16 d/yr by 30 yrs out
- Wind 2/10 Low 3% chance of damaging wind over 30 yrs
- Air quality 2/10 Low 1 unhealthy d/yr today · 2 by 30 yrs out
Nearby sold comps map
Loading sold comps map…
Walkable amenities ~0.75 mi
Loading nearby amenities…
Taxation est. · year 1
- Rental income
- $21,137
- − Mortgage interest
- −$9,243
- − Property taxes
- −$3,194
- − Insurance
- −$6,350
- − Repairs & maintenance
- −$1,691
- − Management
- −$1,691
- − Depreciation
- −$4,800
- Taxable loss
- −$5,831
- Est. tax savings @ 24.0%
- +$1,400
- After-tax cash flow
- $-1,829/yr
For passive investors: Depreciation is non-cash, so a rental often shows a tax loss while cash-flowing — sheltering income. Rental losses are passive: they offset passive income freely, and up to $25,000/yr can offset ordinary (W-2) income if you actively participate and your MAGI is under $100k (phasing out to $0 by $150k); unused losses carry forward. On sale, claimed depreciation is recaptured at up to 25%, and gains may owe capital-gains tax (a 1031 exchange can defer both). Figures are a year-1 estimate at your 24.0% rate — not tax advice; consult a CPA.
Schools (NCES district)
- District
- Bloomsburg Area SD
- NCES district ID
- 4203840
- Math proficiency
- 33% ▼ -11.00%
- Reading proficiency
- 57% ▼ -8.00%
- Median HH income
- $37,973
- Composite
- 37.39/100
- National rank
- #4428
- State rank
- #289 of 539 in PA
Livability — Bloomsburg
- Score
- 82/100
- State rank
- #147
- US rank
- #1183
Category grades
Schools grade is shown separately in the Schools card above.
Census & demographics
- Census place
- Bloomsburg, PA
- County
- Columbia County · 29,790 people
- City population
- 29,790
- Metro
- Bloomsburg-Berwick, PA
- Population (ZIP)
- 29,790
- Household income
- $67,510
- Rent vs Own
- Severe rent burden
- 801.0
Population outlook (Columbia County) Hauer SSP2
- Today (2025)
- 65,170 people
- By 2030
- 64,054 · -1.7%
- By 2040
- 61,131 · -6.2%
- By 2050
- 57,526 · -11.7%
- By 2075
- 50,259 · -22.9%
- By 2100
- 44,756 · -31.3%
Race, ethnicity, and origin ACS 2023
- Neighborhood character
- Predominantly White (89%)
- Race & ethnicity
- White 89% Hispanic / Latino 5% Two or more races 4% Black 2% Asian 2%
- Common ancestry
- Romanian 5% Iranian 2% Polish 2%
- Foreign-born
- 3% · Canada, China
- Languages at home
- 97% English-only · Spanish 1% Other Indo-European 1% German/W. Germanic 1%
Political lean MEDSL · Columbia
- 2024 margin
- Solid R (+31.0) · D 34.0% · R 65.0%
- 2008→2024 swing
- -26.6pp toward R · 2008: -4.5pp · 2024: -31.0pp
- All cycles
- 2024: R+31.0 2020: R+30.7 2016: R+32.8 2012: R+12.4 2008: R+4.5
Not yet ingested
- Civics
- —
Market trends
- HPI YoY
- ▼ -108.98%
- Current HPI
- 220.8076
- Rent YoY
- ▲ 6.80%
- Metro
- Bloomsburg-Berwick, PA
- State GDP YoY
- ▲ 1.68%
- F500 in state
- 34
Industry mix (Fortune 500 HQ in PA)
| Industry | F500 HQs | Revenue |
|---|---|---|
| Healthcare | 2 | $309B |
|
||
| Insurance | 2 | $27B |
|
||
| Telecommunications / Media | 1 | $124B |
|
||
| Industrial Distribution | 1 | $22B |
|
||
| Financial Services | 1 | $20B |
|
||
| Chemicals / Materials | 1 | $18B |
|
||
Price history
+153.7% since first listed5 events — show timeline
- 2026-03-20 Listed $172,500 CSVBR
- 2022-02-08 Sold (Public Records) $700,000 Public Records
- 2014-07-24 Sold (Public Records) $423,738 Public Records
- 2012-07-02 Sold (Public Records) $103,000 Public Records
- 2009-08-27 Sold (Public Records) $68,000 Public Records
Property tax history
+4.2%/yrLatest (2026): $3,194 · +6.1% YoY. Source: county tax records.
Cash-flow waterfall
monthlySold comps — $/sqft
last 12 mo · ≤1 miLoading sold comps…