 Multi-family
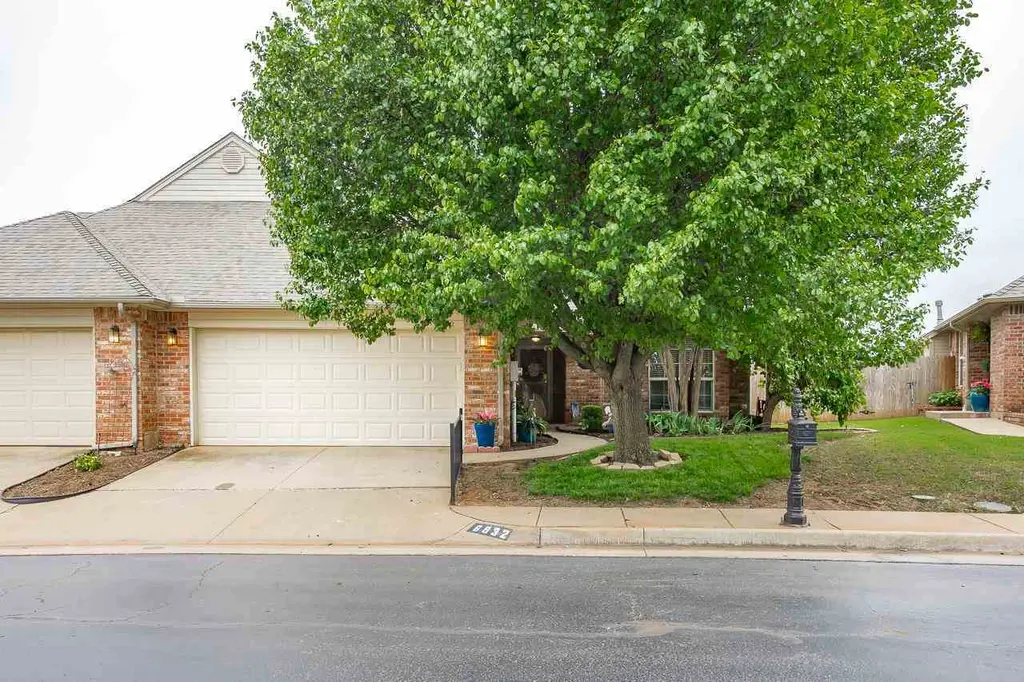
6932 NW 133rd Ter · Oklahoma City, OK
Flood risk 1/10 · Minimal
- FEMA flood zone
- X (unshaded)
- Chance of flooding over 30 yrs
- 0.0%
- Est. flood insurance / yr
- $507 – $1,088
Fire risk 4/10 · Minor
- Est. fire insurance / yr
- $2,463 – $4,575
Heat risk 6/10 · Moderate
- Hot days now (above 107°F)
- 7 days/yr
- Hot days in 30 yrs
- 19 days/yr
Wind risk 2/10 · Minimal
- Chance of severe wind over 30 yrs
- 2.0%
Air-quality risk 2/10 · Minimal
- Unhealthy air days now
- 1 days/yr
- Unhealthy air days in 30 yrs
- 1 days/yr
Risk factors via First Street. Map © Google.
Why this score? — see what drove the B- grade
The composite is a weighted blend of 9 inputs, each scored 0–100. Each bar is that input's sub-score; the figure is the points it added to the 100-point composite (weight × sub-score).
- Cash flow +27.7/30.0
- DSCR +9.7/10.0
- ARV discount +7.5/15.0
- 1% rule +7.2/10.0
- Schools +4.1/10.0
- Livability +4.0/5.0
- Rent growth +3.1/5.0
- Condition / age +2.5/5.0
- Appreciation +0.0/10.0
$230,000
🖨 Deal sheet (PDF) 📄 Offer letter ✓ Due diligence
Multi-family units
County records classify this as Multi-Family (2-4 Unit). Listing-text estimate: 1 unit. estimate disagrees with records
Listing remarks MLS
Welcome home to Crystal Gardens where lawn service is included! This 2-bed, 2-bath half-duplex is perfect for the first-time buyer or for those looking to down-size. Enjoy the gated community atmosphere with a community pool and short driving distances to all the new restaurants and Sprouts Market on MacArthur! Schedule your private showing today!
Key facts
- Gated community
- Updated paint
- Pass through window
Tags
Property features AI
Exterior
- Parking: Attached garage with 2 garage spaces; Garage door opener
- Security: Security system
- Utilities: Public water; Public sewer; Natural gas available
- Home design: Single family residence; Residential property
- Construction: Brick veneer exterior; Composition roof
- Exterior features: Patio; Wood fencing
Interior
- Kitchen: Dishwasher; Disposal; Microwave; Range
- Bathrooms: 2 full bathrooms
- Heating & cooling: Central air conditioning; Forced air heating; Natural gas heating
- Interior features: Gas log fireplace; Dishwasher; Disposal; Microwave; Range
Neighborhood map
What this means for you Summary
Snapshot
- This is a 3-bed/2.0-bath multifamily listed at $230k.
Deal economics
- At list price, monthly cash flow is $692 ($8k/yr) — positive.
- The deal already cash-flows at list — no discount required.
- Meets the 1% rule at list price ($3k rent vs $230k).
- Cap rate 9.9% vs local median 3.7% in Oklahoma City — top-decile yield for the area; either an underpriced asset or a hidden risk that comps aren't pricing in. Stress-test before assuming the spread holds.
Location & tenants
- Location reads 80/100 on livability (#3 in OK, #1,635 nationally) — a professional / high-income tenant draw. Strengths: amenities A+, commute A+, cost of living A+; Watch: crime F.
- Deer Creek (rural): math 41% / reading 44% proficiency, ranked #4 of 270 in OK (top 2%) — families likely to look elsewhere, expect single-tenant / working-renter base with shorter leases; only 7% free/reduced lunch — higher-income household profile.
- Zoned schools: Spring Creek Es (math 67% / reading 52%, grade B-, #10 of 845 statewide, top 2%, 491 students, 0% FRL); Deer Creek Ms (math 35% / reading 43%, grade F, #10 of 345 statewide, top 3%, 1,179 students, 0% FRL); Deer Creek Hs (math 39% / reading 51%, grade D-, #13 of 447 statewide, top 3%, 2,036 students, 0% FRL).
- Market conditions: Rents rising (+2.4%/yr); 193 active listings in the ZIP; 27 comparable units currently listed for rent nearby; rentals leasing fast (median 6d on market — plan ~1-2 weeks tenant-placement turnaround); solid renter incomes; 5,365 units permitted in Oklahoma County in 2024 (569 in 5+ unit buildings).
- This rent runs 41% of the median local income ($82k/yr) — at the standard rent-burdened threshold; future hikes will face affordability resistance.
Forward outlook
- Local home prices are declining (-3.0%/yr); year-one equity from $2k of loan paydown is wiped out by about $7k of value loss. Plan a longer hold.
- Oklahoma County population projected at +41% by 2050 — long-run rental-demand tailwind backs the buy-and-hold thesis.
- At projected returns (-3.0% appreciation + 2.4% rent growth), your $64k cash investment doubles in ~10 years — after that, you're playing with house money.
Negotiation context
- Only 3 days on market — expect competitive offers; lowballing is unlikely to land.
- 4 sale attempts since 25y ago with the ask held roughly flat each time — persistent listings suggest the price (not the market) is what's stuck; bring a comps-based counter.
- Current owner paid $165k; 39% above their basis — modest negotiation headroom, anchor on the comps not their cost.
Risks & watch-outs
- Climate carrying-cost: extreme-heat days projected 7→19/yr by 2055 (HVAC capex compounding) — expect insurance premiums to compound above CPI over the hold.
Questions for the listing agent
- Is there a deadline driving the sale (1031 exchange, divorce, estate, relocation)? That informs how much negotiation room exists.
- Schools are F-rated, which usually means shorter tenancies and higher turnover. Who's the typical renter profile here, and what's been the actual vacancy rate?
- Crime grade is F in this area — have there been break-ins, vandalism, or insurance claims at this property in the last 3 years? What carrier currently insures it and at what premium?
- What's the average days-on-market for RENTAL listings here right now (not sales)? A rising rental-DOM trend means longer vacancies and softer asking-rent achievability than the comps imply.
- What's the recent tenant-quality profile in this submarket — average credit score on applications, eviction rate, late-payment / NSF rate, and stable-employment percentage? A property-management company in the area should have these aggregated.
- How much new apartment / multifamily construction is in the pipeline within 1–3 miles? Heavy new supply (>2% of stock underway) typically softens rents 12–24 months out; light construction supports rent growth.
Investment metrics
- 1% rule
- 1.22% ✓
- Cap rate
- 9.90%
- Cash-on-cash
- 12.90%
- DSCR
- 1.57
- GRM
- 6.8
CMA / ARV
No comps found within radius.
Projected returns pro-forma
-3.0% appreciation · 2.36% rent growth · sell at horizon
- IRR
- 2.0%
- Equity multiple
- 1.08×
- Total profit
- $5,019
- Equity at exit
- $34,294
- IRR
- 11.0%
- Equity multiple
- 1.84×
- Total profit
- $53,871
- Equity at exit
- $19,886
Cash invested: $64,400 (down + closing). Projections, not guarantees.
Landlord ↔ Tenant lean methodology
- Overall (STATE)
- 83 Strongly Landlord-Friendly
- State Oklahoma
- 83 Strongly Landlord-Friendly · R+20
- County
- — inherits STATE
- City
- — inherits STATE
ZIP-level market 73142
- Home prices YoY
- -16.9%
- Rents YoY
- 2.4%
- Active inventory
- 193
- Price-to-rent
- 13.7×
Monthly cashflow live
- Estimated rent
- $2,800 high interval (Pro) →
- Mortgage (P&I)
- −$1,206
- Tax from tax record
- −$218 /mo · $2,615/yr
- Insurance
- −$96
- HOA
- −$0
- Vacancy / Maint / Mgmt
- −$588
- Net cashflow
- $692
Break-even live
Sensitivity live
| Price | -10% $822 | -5% $757 | +0% $692 | +5% $627 | +10% $562 |
|---|---|---|---|---|---|
| Rent | -10% $471 | -5% $582 | +0% $692 | +5% $803 | +10% $913 |
| Rate | -1.0pp $808 | -0.5pp $751 | base $692 | +0.5pp $633 | +1.0pp $572 |
2-unit breakdown (identical units grouped — click to expand)
| Units | Beds | Baths | Est. rent |
|---|---|---|---|
| 2× units | 2 | 2 | $2,800 |
| #1 | 2 | 2 | $1,400 |
| #2 | 2 | 2 | $1,400 |
| Total (2 units) | $2,800 | ||
UW: 25.0% down · 7.5% · 30yr · 1.5% tax · 5.0% vac · 8.0% maint · 8.0% mgmt
Financing live
Cash to close
- Down payment
- $57,500
- Closing costs
- $6,900
- Reserves months
- —
- Total cash needed
- —
Loan-product check · same deal, 3 products live
Conventional
25% down · 7.5% · 30yr
- Down + closing
- —
- Monthly P&I
- —
- Monthly cashflow
- —
- DSCR
- —
- Eligible?
- —
Personal DTI + credit; lowest rate.
DSCR
20% down · 8.5% · 30yr
- Down + closing
- —
- Monthly P&I
- —
- Monthly cashflow
- —
- DSCR
- —
- Eligible?
- —
No personal income docs; deal must DSCR.
Hard money
10% down · 12.0% · 12mo
- Down + closing
- —
- Monthly P&I
- —
- Monthly cashflow
- —
- DSCR
- —
- Eligible?
- —
Short-term bridge; refi at stabilization.
Rent comps 27 comps
| Address | Beds | Baths | Sqft | Rent | $/sqft | DOM | Units | Dist |
|---|---|---|---|---|---|---|---|---|
| 6820 NW 135th Cir Oklahoma City, OK | 3.0 | 2.0 | 1625 | $1,600 | $0.98 | 25d | 1 | 0.16mi |
| 6805 NW 136th Pl Oklahoma City, OK | 3.0 | 2.0 | 1866 | $1,595 | $0.85 | 21d | 1 | 0.23mi |
| 6805 NW 136th Pl Oklahoma City, OK | 3.0 | 2.0 | 1866 | $1,595 | $0.85 | 25d | 1 | 0.23mi |
| 6701 NW 124th Ter Oklahoma City, OK | 4.0 | 2.0 | 1384 | $1,650 | $1.19 | 3d | 1 | 0.55mi |
| 6801 NW 122nd St Oklahoma City, OK | 1.0–3.0 | 1.0–2.0 | 952 | $1,350 | $1.42 | 3d | 7 | 0.59mi |
| 6300 W Memorial Rd Oklahoma City, OK | 1.0–3.0 | 1.0–3.0 | 1056 | $2,560 | $2.42 | 3d | 12 | 0.60mi |
| 7420 NW 126th St Oklahoma City, OK | 3.0 | 2.0 | 1580 | $1,600 | $1.01 | 25d | 1 | 0.67mi |
| 12405 Bannockburn Pl Oklahoma City, OK | 3.0 | 2.0 | 1642 | $1,450 | $0.88 | 25d | 1 | 0.83mi |
| 12901 N MacArthur Blvd Oklahoma City, OK | 1.0–2.0 | 1.0–2.0 | 825 | $1,099 | $1.33 | 18d | 1 | 0.84mi |
| 14117 N Rockwell Ave Oklahoma City, OK | 1.0–3.0 | 1.0–2.0 | 968 | $1,826 | $1.89 | 3d | 26 | 0.86mi |
| 12425 Acadia Ct Oklahoma City, OK | 3.0 | 2.0 | 1746 | $1,700 | $0.97 | 25d | 1 | 0.89mi |
| 14600 N Rockwell Ave Oklahoma City, OK | 1.0–2.0 | 1.0–2.0 | 818 | $1,220 | $1.49 | 3d | 1 | 0.98mi |
| 12401 N MacArthur Blvd Oklahoma City, OK | 2.0 | 1.0–2.0 | 740 | $1,167 | $1.58 | 4d | 36 | 0.99mi |
| 13512 Vinita Dr Oklahoma City, OK | 3.0 | 2.5 | 1573 | $1,695 | $1.08 | 3d | 1 | 1.06mi |
| 12600 N MacArthur Blvd Oklahoma City, OK | 2.0 | 2.0 | 1000 | $1,289 | $1.29 | 23d | 1 | 1.07mi |
| 12600 N MacArthur Blvd Oklahoma City, OK | 2.0 | 2.0 | 978 | $1,089 | $1.11 | 6d | 1 | 1.07mi |
| 7901 NW 135th Ter Oklahoma City, OK | 3.0 | 2.5 | 1573 | $1,695 | $1.08 | 6d | 1 | 1.08mi |
| 7901 NW 135th Ter Oklahoma City, OK | 3.0 | 2.5 | 1573 | $1,695 | $1.08 | 25d | 1 | 1.08mi |
| 7137 NW 116th St Unit 7137 Oklahoma City, OK | 3.0 | 2.0 | 1465 | $1,350 | $0.92 | 25d | 1 | 1.08mi |
| 7907 NW 135th Ter Oklahoma City, OK | 3.0 | 2.5 | 1573 | $1,745 | $1.11 | 3d | 1 | 1.10mi |
| 7136 NW 115th St Unit 7138 Oklahoma City, OK | 3.0 | 2.0 | 1489 | $1,325 | $0.89 | 25d | 1 | 1.17mi |
| 7501 NW 115th St Oklahoma City, OK | 3.0 | 2.0 | 1387 | $1,560 | $1.12 | 3d | 1 | 1.18mi |
| 14816 Slippery Falls Cir Oklahoma City, OK | 4.0 | 2.0 | 1590 | $1,895 | $1.19 | 25d | 1 | 1.24mi |
| 14808 Gravity Falls Ln Oklahoma City, OK | 3.0 | 2.0 | 1676 | $1,845 | $1.10 | 25d | 1 | 1.24mi |
| 6901 NW 149th St Oklahoma City, OK | 3.0 | 2.0 | 1704 | $2,150 | $1.26 | 6d | 1 | 1.27mi |
| 24 Redstone Blvd Oklahoma City, OK | 2.0 | 1.0–2.0 | 857 | $1,950 | $2.27 | 3d | 11 | 1.29mi |
| 5300 W Memorial Rd Oklahoma City, OK | 1.0–2.0 | 1.0–2.5 | 1008 | $1,435 | $1.42 | 3d | 24 | 1.33mi |
Listing history 13 events
-
2026-05-04status Pending
-
2026-04-30$230,000 Active
-
2022-03-02soldstatus $164,999 Sold 352-char remark
Show marketing remark (352 chars)
Welcome home to Crystal Gardens where lawn service is included! This 2-bed, 2-bath half-duplex is perfect for the first-time buyer or for those looking to down-size. Enjoy the gated community atmosphere with a community pool and short driving distances to all the new restaurants and Sprouts Market on MacArthur! Schedule your private showing today!
-
2022-02-04status Pending 352-char remark
Show marketing remark (352 chars)
Welcome home to Crystal Gardens where lawn service is included! This 2-bed, 2-bath half-duplex is perfect for the first-time buyer or for those looking to down-size. Enjoy the gated community atmosphere with a community pool and short driving distances to all the new restaurants and Sprouts Market on MacArthur! Schedule your private showing today!
-
2022-02-03$169,999 Active 352-char remark
Show marketing remark (352 chars)
Welcome home to Crystal Gardens where lawn service is included! This 2-bed, 2-bath half-duplex is perfect for the first-time buyer or for those looking to down-size. Enjoy the gated community atmosphere with a community pool and short driving distances to all the new restaurants and Sprouts Market on MacArthur! Schedule your private showing today!
-
2013-08-06soldstatus $137,000
-
2007-12-19historical
-
2006-01-05soldstatus $119,500
-
2003-01-08historical
-
2002-01-17$125,000
-
2001-07-06$129,900
-
1998-10-06soldstatus $110,500
-
1998-04-21soldstatus $20,000
ⓘ Source: listings_history table (triggers on properties + properties_extension) + one-shot
backfill from property_details.listing_events for pre-trigger history.
Tax reassessment forecast OK · Resets to sale price
- Current annual tax
- $2,615 · $218/mo
- Projected year-2 tax
- $2,615 · $218/mo
- Expected delta
- $0/yr ($0/mo · 0.0%)
ⓘ Screening estimate from a state-policy table — verify with the county assessor before closing.
Climate risk First Street
- Flood 1/10 Low FEMA zone X (unshaded) · 0% chance over 30 yrs
- Wildfire 4/10 Moderate
- Heat 6/10 Major 7 d/yr ≥107°F today · 19 d/yr by 30 yrs out
- Wind 2/10 Low 2% chance of damaging wind over 30 yrs
- Air quality 2/10 Low 1 unhealthy d/yr today · 1 by 30 yrs out
Nearby sold comps map
Loading sold comps map…
Walkable amenities ~0.75 mi
Loading nearby amenities…
Taxation est. · year 1
- Rental income
- $33,600
- − Mortgage interest
- −$12,884
- − Property taxes
- −$2,615
- − Insurance
- −$1,150
- − Repairs & maintenance
- −$2,688
- − Management
- −$2,688
- − Depreciation
- −$6,691
- Taxable income
- $4,885
- Est. tax owed @ 24.0%
- −$1,172
- After-tax cash flow
- $7,133/yr
For passive investors: Depreciation is non-cash, so a rental often shows a tax loss while cash-flowing — sheltering income. Rental losses are passive: they offset passive income freely, and up to $25,000/yr can offset ordinary (W-2) income if you actively participate and your MAGI is under $100k (phasing out to $0 by $150k); unused losses carry forward. On sale, claimed depreciation is recaptured at up to 25%, and gains may owe capital-gains tax (a 1031 exchange can defer both). Figures are a year-1 estimate at your 24.0% rate — not tax advice; consult a CPA.
Schools (NCES district)
- District
- Deer Creek
- NCES district ID
- 4009570
- Math proficiency
- 41% ▼ -16.00%
- Reading proficiency
- 44% ▼ -14.00%
- Median HH income
- $101,218
- Composite
- 41.46/100
- National rank
- #3465
- State rank
- #4 of 270 in OK
Livability — Oklahoma City
- Score
- 80/100
- State rank
- #3
- US rank
- #1635
Category grades
Schools grade is shown separately in the Schools card above.
Census & demographics
- Census place
- Oklahoma City, OK
- County
- Oklahoma County · 771,644 people
- City population
- 498,656
- Metro
- Oklahoma City, OK
- Population (ZIP)
- 17,548
- Household income
- $81,818
- Rent vs Own
- Severe rent burden
- 425.0
Population outlook (Oklahoma County) Hauer SSP2
- Today (2025)
- 911,875 people
- By 2030
- 982,413 · +7.7%
- By 2040
- 1,130,468 · +24.0%
- By 2050
- 1,288,422 · +41.3%
- By 2075
- 1,711,482 · +87.7%
- By 2100
- 2,088,448 · +129.0%
Race, ethnicity, and origin ACS 2023
- Neighborhood character
- Diverse neighborhood (Simpson 0.64)
- Race & ethnicity
- White 57% Black 14% Two or more races 14% Asian 9% Hispanic / Latino 8% Native American 2%
- Hispanic origin (detail)
- Mexican 6%
- Common ancestry
- Slovak 3% Italian 2% Lithuanian 2%
- Foreign-born
- 9% · Canada, China, Vietnam
- Languages at home
- 90% English-only · Spanish 3% Other Asian/Pacific 3% Chinese 1%
Political lean MEDSL · Oklahoma
- 2024 margin
- Toss-up / Even · D 48.0% · R 49.7% · Other 2.3%
- 2008→2024 swing
- +15.1pp toward D · 2008: -16.8pp · 2024: -1.7pp
- All cycles
- 2024: R+1.7 2020: R+1.1 2016: R+10.5 2012: R+16.7 2008: R+16.8
Not yet ingested
- Civics
- —
Market trends
- HPI YoY
- ▼ -38.67%
- Current HPI
- 190.7821
- Rent YoY
- ▲ 2.36%
- Metro
- Oklahoma City, OK
- State GDP YoY
- ▲ 1.55%
- F500 in state
- 6
Industry mix (Fortune 500 HQ in OK)
| Industry | F500 HQs | Revenue |
|---|---|---|
| Energy | 3 | $48B |
|
||
Price history
+1050.0% since first listed13 events — show timeline
- 2026-05-04 Pending — SBOR
- 2026-04-30 Listed $230,000 SBOR
- 2022-03-02 Sold (MLS) $164,999 MLSOK
- 2022-02-04 Pending — MLSOK
- 2022-02-03 Listed $169,999 MLSOK
- 2013-08-06 Sold (Public Records) $137,000 Public Records
- 2007-12-19 Listing Removed — MLSOK
- 2006-01-05 Sold (Public Records) $119,500 Public Records
- 2003-01-08 Listing Removed — MLSOK
- 2002-01-17 Listed $125,000 MLSOK
- 2001-07-06 Listed $129,900 MLSOK
- 1998-10-06 Sold (Public Records) $110,500 Public Records
- 1998-04-21 Sold (Public Records) $20,000 Public Records
Property tax history
+2.6%/yrLatest (2025): $2,615 · +3.7% YoY. Source: county tax records.
Cash-flow waterfall
monthlySold comps — $/sqft
last 12 mo · ≤1 miLoading sold comps…