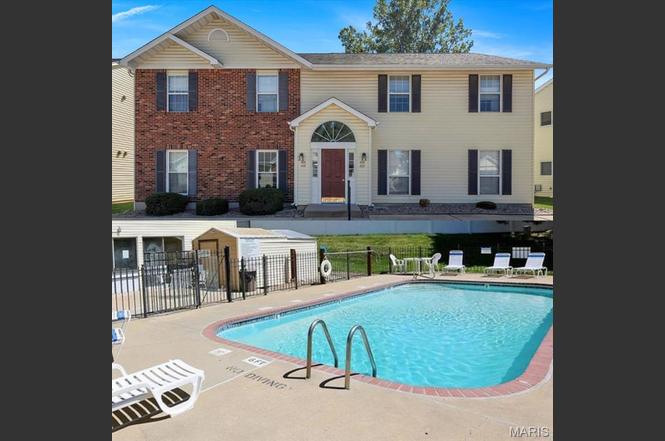
420 Cambridge Pl #2 · St. Peters, MO
Flood risk 1/10 · Minimal
- FEMA flood zone
- X (unshaded)
- Chance of flooding over 30 yrs
- 0.0%
- Est. flood insurance / yr
- $507 – $1,088
Fire risk 1/10 · Minimal
- Est. fire insurance / yr
- $1,054 – $1,958
Heat risk 5/10 · Moderate
- Hot days now (above 108°F)
- 7 days/yr
- Hot days in 30 yrs
- 20 days/yr
Wind risk 2/10 · Minimal
- Chance of severe wind over 30 yrs
- 1.0%
Air-quality risk 2/10 · Minimal
- Unhealthy air days now
- 2 days/yr
- Unhealthy air days in 30 yrs
- 2 days/yr
Risk factors via First Street. Map © Google.
Why this score? — see what drove the C- grade
The composite is a weighted blend of 9 inputs, each scored 0–100. Each bar is that input's sub-score; the figure is the points it added to the 100-point composite (weight × sub-score).
- Cash flow +17.6/30.0
- ARV discount +7.5/15.0
- 1% rule +6.9/10.0
- DSCR +5.5/10.0
- Schools +5.1/10.0
- Rent growth +3.2/5.0
- Livability +2.5/5.0
- Condition / age +2.5/5.0
- Appreciation +0.0/10.0
$147,500
🖨 Deal sheet 📄 Offer letter ✓ Due diligence
Listing remarks
Garden Villa in Convenient St Peters! Seller says MAKE AN OFFER! Welcome to 420 Cambridge Place—a spacious ground-level condo designed for comfort and convenience. Featuring wall-to-wall luxury vinyl plank flooring and an open floor plan, the living, dining, and kitchen areas flow seamlessly to create an inviting space for everyday living and entertaining. Step outside from the living room to your private patio overlooking green space—perfect for unwinding with a book or catching sunsets. Inside, you’ll find two generously sized bedrooms with ample closet space, plus a large dual-entry bath and in-unit laundry tucked away behind closed doors for ease and efficiency. Plus,
Key facts
- $289 HOA
- Community pool
- Built 1987
Property features AI
Finance
- Other: Accessible features including accessible bedroom, central living area, closets, common area, and doors
- HOA & community: Villas At Crown Colony HOA; Monthly HOA fee of $289; HOA covers insurance, grounds maintenance, parking/road maintenance, repairs, common area maintenance, exterior maintenance, sewer, snow removal, trash, and water; Community clubhouse, pool, sidewalks, and street lights; Suburban setting
Exterior
- Parking: Assigned parking
- Utilities: Public water; Public sewer; 220V electric service; Cable available
- Home design: Residential condominium; One level
- Construction: Brick and vinyl siding exterior; Concrete perimeter foundation
- Exterior features: Patio; Lighting; No-step entry; Private entrance; Storage; Back yard; Adjoins common/open ground; City lot; Close to clubhouse; Few trees; Asphalt road; City street frontage; Pool available in community
Interior
- Kitchen: Dishwasher; Microwave; Gas range; Refrigerator
- Bedrooms: 2 bedrooms (both on the main level)
- Flooring: Laminate
- Bathrooms: 1 full bathroom (on the main level)
- Heating & cooling: Forced air heating; Central air conditioning
- Interior features: Eat-in kitchen; Kitchen/dining room combo; Master bedroom on main level; Blinds; Lighting; Lobby; Storage
- Laundry & utility: Washer/dryer included; Washer hookup; Electric dryer hookup; Laundry located in hall on main level
Neighborhood map
What this means for you Summary
Snapshot
- This is a 2-bed/1.0-bath condo listed at $148k.
Deal economics
- At list price, monthly cash flow is $117 ($1k/yr) — positive.
- The deal already cash-flows at list — no discount required.
- Meets the 1% rule at list price ($2k rent vs $148k).
- Recommended offer: $139k (6.0% below list) — sets the bar for market timing.
- Cap rate 7.2% vs local median 4.2% in St. Peters — top-decile yield for the area; either an underpriced asset or a hidden risk that comps aren't pricing in. Stress-test before assuming the spread holds.
Location & tenants
- Location reads: area grade C — affects rentability + tenant quality, not the cash-flow math above.
- Ft. Zumwalt R-II (suburban): math 54% / reading 60% proficiency, ranked #14 of 324 in MO (top 4%) — acceptable for families but not a draw, mixed tenant base, ~2y average lease; only 18% free/reduced lunch — higher-income household profile.
- Zoned schools: Ft. Zumwalt East High (math 50% / reading 64%, grade C, #51 of 521 statewide, top 11%, 1,226 students, 25% FRL).
- Market conditions: Rents rising (+2.7%/yr); 290 active listings in the ZIP; 4 comparable units currently listed for rent nearby; rentals leasing fast (median 4d on market — plan ~1-2 weeks tenant-placement turnaround); solid renter incomes; 2,021 units permitted in St. Charles County in 2024 (568 in 5+ unit buildings).
Forward outlook
- Local home prices are declining (-3.0%/yr); year-one equity from $1k of loan paydown is wiped out by about $4k of value loss. Plan a longer hold.
- St. Charles County population projected at +22% by 2050 — long-run rental-demand tailwind backs the buy-and-hold thesis.
Negotiation context
- It's been on market 72 days — a 6% lower offer ($139k) is reasonable based on typical stale-listing flexibility.
- 4 sale attempts with the ask held roughly flat each time — persistent listings suggest the price (not the market) is what's stuck; bring a comps-based counter.
Risks & watch-outs
- Climate carrying-cost: extreme-heat days projected 7→20/yr by 2055 (HVAC capex compounding) — expect insurance premiums to compound above CPI over the hold.
Questions for the listing agent
- It's been on market 72 days. Have you received any prior offers? Is the seller open to a 6% concession, seller financing, or rate buy-down credit?
- What does the HOA fee cover, when was the last increase, and are there any pending special assessments or reserve-fund shortfalls?
- Any open or pending special assessments — roof, HVAC, plumbing, elevator, façade? What's the per-unit balance and payoff schedule, and is the seller paying it off at close or rolling it to the buyer?
- Why hasn't it sold? Are there any deal-killer items the seller is aware of (foundation, flood, title, zoning, code violations)?
- Is there a deadline driving the sale (1031 exchange, divorce, estate, relocation)? That informs how much negotiation room exists.
- What's the average days-on-market for RENTAL listings here right now (not sales)? A rising rental-DOM trend means longer vacancies and softer asking-rent achievability than the comps imply.
- What's the recent tenant-quality profile in this submarket — average credit score on applications, eviction rate, late-payment / NSF rate, and stable-employment percentage? A property-management company in the area should have these aggregated.
- How much new apartment / multifamily construction is in the pipeline within 1–3 miles? Heavy new supply (>2% of stock underway) typically softens rents 12–24 months out; light construction supports rent growth.
Investment metrics
- 1% rule
- 1.19% ✓
- Cap rate
- 7.25%
- Cash-on-cash
- 3.41%
- DSCR
- 1.15
- GRM
- 7.0
CMA / ARV
No comps found within radius.
Projected returns pro-forma
-3.0% appreciation · 2.69% rent growth · sell at horizon
- IRR
- -11.2%
- Equity multiple
- 0.59×
- Total profit
- $-16,792
- Equity at exit
- $21,993
- IRR
- -2.4%
- Equity multiple
- 0.84×
- Total profit
- $-6,493
- Equity at exit
- $12,753
Cash invested: $41,300 (down + closing). Projections, not guarantees.
Landlord ↔ Tenant lean methodology
- Overall (STATE)
- 81 Strongly Landlord-Friendly
- State Missouri
- 81 Strongly Landlord-Friendly · R+10
- County
- — inherits STATE
- City
- — inherits STATE
ZIP-level market 63376
- Rents YoY
- 2.7%
- Active inventory
- 290
- Price-to-rent
- 7.0×
Monthly cashflow live
- Estimated rent
- $1,752 medium interval (Pro) →
- Mortgage (P&I)
- −$774
- Tax from tax record
- −$143 /mo · $1,712/yr
- Insurance
- −$61
- HOA
- −$289
- Vacancy / Maint / Mgmt
- −$368
- Net cashflow
- $117
Break-even live
UW: 25.0% down · 7.5% · 30yr · 1.5% tax · 5.0% vac · 8.0% maint · 8.0% mgmt
Financing live
Cash to close
- Down payment
- $36,875
- Closing costs
- $4,425
- Reserves months
- —
- Total cash needed
- —
Loan-product check · same deal, 3 products live
Conventional
25% down · 7.5% · 30yr
- Down + closing
- —
- Monthly P&I
- —
- Monthly cashflow
- —
- DSCR
- —
- Eligible?
- —
Personal DTI + credit; lowest rate.
DSCR
20% down · 8.5% · 30yr
- Down + closing
- —
- Monthly P&I
- —
- Monthly cashflow
- —
- DSCR
- —
- Eligible?
- —
No personal income docs; deal must DSCR.
Hard money
10% down · 12.0% · 12mo
- Down + closing
- —
- Monthly P&I
- —
- Monthly cashflow
- —
- DSCR
- —
- Eligible?
- —
Short-term bridge; refi at stabilization.
Rent comps 4 comps
| Address | Beds | Baths | Sqft | Rent | $/sqft | DOM | Units | Dist |
|---|---|---|---|---|---|---|---|---|
| 23 Steeplechase Dr Saint Peters, MO | 3.0 | 1.0 | 1073 | $1,776 | $1.66 | 12d | 1 | 0.24mi |
| 28 Jamestown Dr Saint Peters, MO | 3.0 | 1.0 | 1073 | $1,825 | $1.70 | 4d | 1 | 0.27mi |
| 2000 Enson LN St Peters, MO | 1.0–2.0 | 1.0–2.0 | 930 | $1,815 | $1.95 | 1d | 16 | 0.41mi |
| 100 Ridgegate Ln Saint Peters, MO | 1.0–2.0 | 1.0–2.0 | 847 | $1,695 | $2.00 | 1d | 9 | 0.67mi |
HOA detail condo
- Monthly dues
- $289 · $3,468/yr
- Assessments
- None detected in remarks — confirm with the listing agent.
Listing history 29 events
-
2026-06-18days on market $147,500 Active 72 DOM
-
2026-06-17days on market $147,500 Active 71 DOM
-
2026-06-16days on market $147,500 Active 70 DOM
-
2026-06-15days on market $147,500 Active 69 DOM
-
2026-06-13days on market $147,500 Active 67 DOM
-
2026-06-09days on market $147,500 Active 63 DOM
-
2026-06-08days on market $147,500 Active 62 DOM
-
2026-06-07pricedays on market $147,500 Active 61 DOM
-
2026-06-03days on market $149,600 Active 57 DOM
-
2026-06-02days on market $149,600 Active 56 DOM
-
2026-06-01days on market $149,600 Active 55 DOM
-
2026-05-31days on market $149,600 Active 54 DOM
-
2026-05-04price $149,600
-
2026-04-29price $149,500
-
2026-04-09status Active
-
2026-04-04status Pending
-
2026-04-02$149,900 Active
-
2026-03-11historical $149,900
-
2025-12-08status Active
-
2025-11-28status Pending
-
2025-11-22price $164,000
-
2025-11-06price $165,000
-
2025-10-21$169,900 Active
-
2025-09-30historical
-
2022-06-22soldstatus $151,900
-
2015-08-18soldstatus $77,651
-
2006-02-21soldstatus $93,500
-
2005-04-05soldstatus $93,500
-
1987-11-01soldstatus $50,640
ⓘ Source: listings_history table (triggers on properties + properties_extension) + one-shot
backfill from property_details.listing_events for pre-trigger history.
Tax reassessment forecast MO · Resets to sale price
- Current annual tax
- $1,712 · $143/mo
- Projected year-2 tax
- $1,712 · $143/mo
- Expected delta
- $0/yr ($0/mo · 0.0%)
ⓘ Screening estimate from a state-policy table — verify with the county assessor before closing.
Climate risk First Street
- Flood 1/10 Low FEMA zone X (unshaded) · 0% chance over 30 yrs
- Wildfire 1/10 Low
- Heat 5/10 Major 7 d/yr ≥108°F today · 20 d/yr by 30 yrs out
- Wind 2/10 Low 100% chance of damaging wind over 30 yrs
- Air quality 2/10 Low 2 unhealthy d/yr today · 2 by 30 yrs out
Nearby sold comps map
Loading sold comps map…
Walkable amenities ~0.75 mi
Loading nearby amenities…
Taxation est. · year 1
- Rental income
- $21,023
- − Mortgage interest
- −$8,262
- − Property taxes
- −$1,712
- − Insurance
- −$738
- − Repairs & maintenance
- −$1,682
- − Management
- −$1,682
- − HOA
- −$3,468
- − Depreciation
- −$4,291
- Taxable loss
- −$811
- Est. tax savings @ 24.0%
- +$195
- After-tax cash flow
- $1,603/yr
For passive investors: Depreciation is non-cash, so a rental often shows a tax loss while cash-flowing — sheltering income. Rental losses are passive: they offset passive income freely, and up to $25,000/yr can offset ordinary (W-2) income if you actively participate and your MAGI is under $100k (phasing out to $0 by $150k); unused losses carry forward. On sale, claimed depreciation is recaptured at up to 25%, and gains may owe capital-gains tax (a 1031 exchange can defer both). Figures are a year-1 estimate at your 24.0% rate — not tax advice; consult a CPA.
Schools (NCES district)
- District
- Ft. Zumwalt R-II
- NCES district ID
- 2908370
- Math proficiency
- 54% ▼ -7.00%
- Reading proficiency
- 60% ▼ -4.00%
- Median HH income
- $75,817
- Composite
- 51.04/100
- National rank
- #1772
- State rank
- #14 of 324 in MO
Livability — St. Peters
No livability data for this city. (Only ~50 U.S. cities are tracked.)
Census & demographics
- Census place
- St. Peters, MO
- County
- Saint Charles County · 399,703 people
- City population
- 74,876
- Metro
- St. Louis, MO-IL
- Population (ZIP)
- 74,962
- Household income
- $96,393
- Rent vs Own
- Severe rent burden
- 964.0
Population outlook (St. Charles County) Hauer SSP2
- Today (2025)
- 437,857 people
- By 2030
- 461,707 · +5.4%
- By 2040
- 503,222 · +14.9%
- By 2050
- 534,684 · +22.1%
- By 2075
- 597,047 · +36.4%
- By 2100
- 609,682 · +39.2%
Race, ethnicity, and origin ACS 2023
- Neighborhood character
- Predominantly White (86%)
- Race & ethnicity
- White 86% Two or more races 6% Black 5% Hispanic / Latino 2% Asian 2%
- Common ancestry
- Lithuanian 3% Romanian 3% Italian 2%
- Foreign-born
- 3% · China, Canada
- Languages at home
- 96% English-only · Spanish 1% Chinese 1% Other Asian/Pacific 1%
Political lean MEDSL · St. Charles
- 2024 margin
- R (+17.0) · D 40.8% · R 57.8% · Other 1.4%
- 2008→2024 swing
- -7.2pp toward R · 2008: -9.7pp · 2024: -17.0pp
- All cycles
- 2024: R+17.0 2020: R+17.5 2016: R+26.4 2012: R+21.0 2008: R+9.7
Not yet ingested
- Civics
- —
Market trends
- HPI YoY
- ▼ -315.50%
- Current HPI
- 230.3362
- Rent YoY
- ▲ 2.69%
- Metro
- St. Louis, MO-IL
- State GDP YoY
- ▲ 1.84%
- F500 in state
- 20
Industry mix (Fortune 500 HQ in MO)
| Industry | F500 HQs | Revenue |
|---|---|---|
| Healthcare | 1 | $163B |
|
||
| Insurance | 1 | $21B |
|
||
| Industrial Technology | 1 | $17B |
|
||
| Retail | 1 | $16B |
|
||
| Industrial Distribution | 1 | $10B |
|
||
| Utilities | 1 | $9B |
|
||
Price history
+195.4% since first listed17 events — show timeline
- 2026-05-04 Price Changed $149,600 MARIS as Distributed by MLS Grid
- 2026-04-29 Price Changed $149,500 MARIS as Distributed by MLS Grid
- 2026-04-09 Relisted — MARIS as Distributed by MLS Grid
- 2026-04-04 Pending — MARIS as Distributed by MLS Grid
- 2026-04-02 Listed $149,900 MARIS as Distributed by MLS Grid
- 2026-03-11 Coming Soon $149,900 MARIS as Distributed by MLS Grid
- 2025-12-08 Relisted — MARIS as Distributed by MLS Grid
- 2025-11-28 Pending — MARIS as Distributed by MLS Grid
- 2025-11-22 Price Changed $164,000 MARIS as Distributed by MLS Grid
- 2025-11-06 Price Changed $165,000 MARIS as Distributed by MLS Grid
- 2025-10-21 Listed $169,900 MARIS as Distributed by MLS Grid
- 2025-09-30 Coming Soon — MARIS as Distributed by MLS Grid
- 2022-06-22 Sold (Public Records) $151,900 Public Records
- 2015-08-18 Sold (Public Records) $77,651 Public Records
- 2006-02-21 Sold (Public Records) $93,500 Public Records
- 2005-04-05 Sold (Public Records) $93,500 Public Records
- 1987-11-01 Sold (Public Records) $50,640 Public Records
Property tax history
+3.5%/yrLatest (2025): $1,712 · +2.3% YoY. Source: county tax records.
Cash-flow waterfall
monthlySold comps — $/sqft
last 12 mo · ≤1 miLoading sold comps…