 🌊 Lakefront
110 Kimberling Shores Ln #6 · Kimberling City, MO
Flood risk 1/10 · Minimal
- FEMA flood zone
- X (unshaded)
- Chance of flooding over 30 yrs
- 0.0%
- Est. flood insurance / yr
- $507 – $1,088
Fire risk 1/10 · Minimal
- Est. fire insurance / yr
- $1,054 – $1,958
Heat risk 5/10 · Moderate
- Hot days now (above 105°F)
- 7 days/yr
- Hot days in 30 yrs
- 21 days/yr
Wind risk 2/10 · Minimal
- Chance of severe wind over 30 yrs
- 1.0%
Air-quality risk 2/10 · Minimal
- Unhealthy air days now
- 0 days/yr
- Unhealthy air days in 30 yrs
- 1 days/yr
Risk factors via First Street. Map © Google.
Why this score? — see what drove the D grade
The composite is a weighted blend of 9 inputs, each scored 0–100. Each bar is that input's sub-score; the figure is the points it added to the 100-point composite (weight × sub-score).
- ARV discount +15.0/15.0
- Cash flow +7.6/30.0
- 1% rule +3.7/10.0
- Schools +3.7/10.0
- Livability +3.5/5.0
- Rent growth +2.5/5.0
- Condition / age +2.5/5.0
- DSCR +1.7/10.0
- Appreciation +0.0/10.0
$177,000
🖨 Deal sheet 📄 Offer letter ✓ Due diligence
Listing remarks MLS
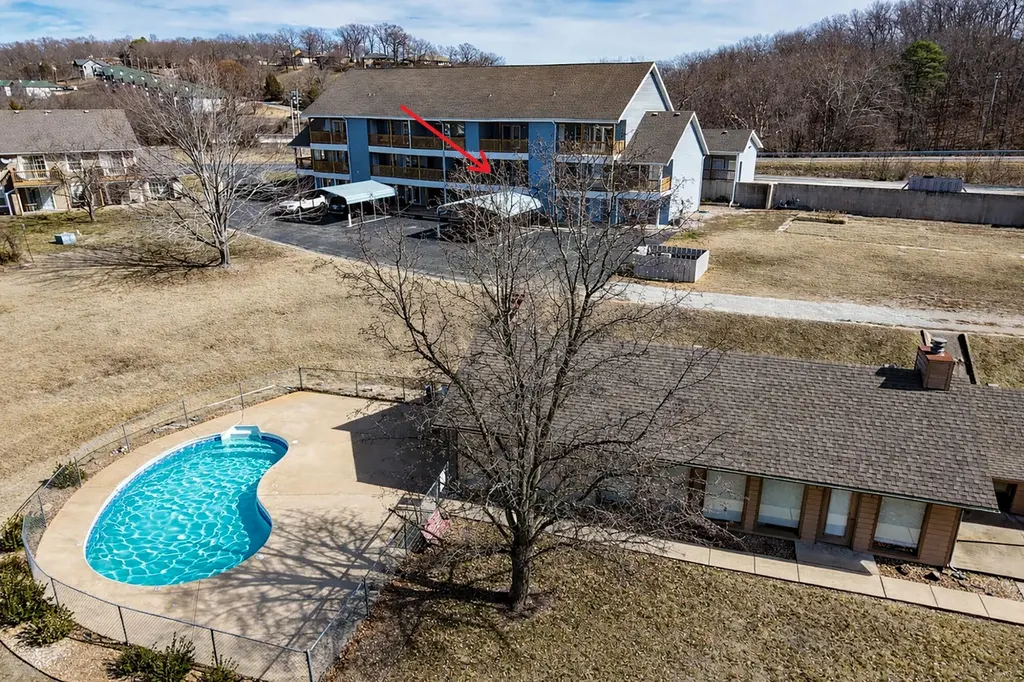
Discover the perfect lake getaway with this Walk-In Winter Lakeview Condo located in a, highly convenient lakefront community just across the Kimberling City Bridge on Table Rock Lake, minutes from shopping, restaurants, grocery store conveniences. This beautifully updated 2-bedroom, 2-bathroom condo was completely renovated top-to-bottom in 2024, offering modern finishes and move-in-ready comfort. Enjoy the spacious covered deck that spans the full width of the unit, with direct access from both the living room and the primary bedroom, ideal for relaxing and taking in peaceful views year-round. The 3 little steps to walk-in entry makes access easy, and the unit also includes a 1-CAR ATTACHED GARAGE for added convenience and storage. The community amenities elevate the lifestyle with a clubhouse, swimming pool, and a community dock featuring a swim deck and fish cleaning station. A 10 x 24 BOATSLIP with a new tritoon lift is available for an additional $60,000, perfect for making the most of your time on the water. Don't miss this opportunity to own a fully updated, low-maintenance lake retreat in one of the area's most desirable condo communities!
Key facts
- Covered deck
- Lakeview condo
- Clubhouse
Tags
Neighborhood map
What this means for you Summary
Snapshot
- This is a 2-bed/2.0-bath other listed at $177k.
Deal economics
- At list price, monthly cash flow is $-209 ($-3k/yr) — negative.
- To cash-flow at today's rent, offer at most $140k (20.9% below list).
- To meet the 1% rule (rent ≥ 1% of price), the offer needs to be $154k (12.9% below list).
- Recommended offer: $140k (20.9% below list) — sets the bar for cash-flow.
- Cap rate 4.9% vs local median 1.7% in Kimberling City — top-decile yield for the area; either an underpriced asset or a hidden risk that comps aren't pricing in. Stress-test before assuming the spread holds.
Location & tenants
- Location reads 69/100 on livability (#162 in MO) — a middle-class / working-renter tenant base. Strengths: crime A+, cost of living A+, housing A+; Watch: health & safety C-, schools D, employment D.
- Blue Eye R-V (rural): math 41% / reading 47% proficiency, ranked #107 of 324 in MO (top 33%) — families likely to look elsewhere, expect single-tenant / working-renter base with shorter leases.
- Market conditions: 288 active listings in the ZIP; 10 comparable units currently listed for rent nearby; rentals lingering (median 44d on market — plan ~5-8 weeks vacancy on turnover, expect pricing pressure); 100% of comp listings sitting > 30 days — soft ceiling on asking rent; 191 units permitted in Stone County in 2024 (0 in 5+ unit buildings).
Forward outlook
- Local home prices are declining (-3.0%/yr); year-one equity from $1k of loan paydown is wiped out by about $5k of value loss. Plan a longer hold.
- Stone County population projected at -30% by 2050 — secular population decline; favor cash flow + early exit over multi-decade hold.
Negotiation context
- It's been on market 127 days — a 12% lower offer ($156k) is reasonable based on typical stale-listing flexibility.
- 6 sale attempts since 11y ago; this cycle's ask has dropped $48k (21%) from the opening price — seller is motivated, your offer sets the floor, not the list.
Risks & watch-outs
- Watch-outs: HOA is 25% of rent.
- Climate carrying-cost: extreme-heat days projected 7→21/yr by 2055 (HVAC capex compounding) — expect insurance premiums to compound above CPI over the hold.
Questions for the listing agent
- What do current leases actually rent for vs. the listed asking? Can we see a recent rent roll and the last 12 months of T-12 income?
- It's been on market 127 days. Have you received any prior offers? Is the seller open to a 21% concession, seller financing, or rate buy-down credit?
- What does the HOA fee cover, when was the last increase, and are there any pending special assessments or reserve-fund shortfalls?
- Why hasn't it sold? Are there any deal-killer items the seller is aware of (foundation, flood, title, zoning, code violations)?
- Is there a deadline driving the sale (1031 exchange, divorce, estate, relocation)? That informs how much negotiation room exists.
- Schools are D-rated, which usually means shorter tenancies and higher turnover. Who's the typical renter profile here, and what's been the actual vacancy rate?
- The area grade is low — what's the realistic commute time and amenity access for the typical tenant pool here? Any planned neighborhood developments (good or bad) we should know about?
- This sits on a lake — are riparian / water-frontage rights deeded with the parcel? Any dock permits, shoreline easements, or HOA water-use restrictions?
- What's the documented flood / surge / shoreline-erosion history here (FEMA AND non-FEMA — e.g., storm surge, creek backup, septic-field saturation)?
- Any water-quality or seasonal algae-bloom issues that affect tenant satisfaction or short-term-rental demand?
- What's the average days-on-market for RENTAL listings here right now (not sales)? A rising rental-DOM trend means longer vacancies and softer asking-rent achievability than the comps imply.
- What's the recent tenant-quality profile in this submarket — average credit score on applications, eviction rate, late-payment / NSF rate, and stable-employment percentage? A property-management company in the area should have these aggregated.
- How much new for-sale + rental construction is in the pipeline within 1–3 miles? Heavy new supply typically softens prices + rents 12–24 months out; constrained supply supports both.
Investment metrics
- 1% rule
- 0.87% ✗
- Cap rate
- 4.87%
- Cash-on-cash
- -5.07%
- DSCR
- 0.77
- GRM
- 9.6
CMA / ARV
- ARV (median comp)
- $258,670
- List price
- $177,000
- Delta
- -31.57%
- Verdict
- UNDERPRICED
- Comps
- 20 within 1.0 mi
Projected returns pro-forma
-3.0% appreciation · 3.0% rent growth · sell at horizon
- IRR
- -24.8%
- Equity multiple
- 0.16×
- Total profit
- $-41,865
- Equity at exit
- $26,391
- IRR
- -20.2%
- Equity multiple
- -0.07×
- Total profit
- $-53,020
- Equity at exit
- $15,304
Cash invested: $49,560 (down + closing). Projections, not guarantees.
Landlord ↔ Tenant lean methodology
- Overall (STATE)
- 81 Strongly Landlord-Friendly
- State Missouri
- 81 Strongly Landlord-Friendly · R+10
- County
- — inherits STATE
- City
- — inherits STATE
ZIP-level market 65686
- Home prices YoY
- -31.2%
- Active inventory
- 288
- Price-to-rent
- 9.6×
Monthly cashflow live
- Estimated rent
- $1,541 high interval (Pro) →
- Mortgage (P&I)
- −$928
- Tax from tax record
- −$38 /mo · $452/yr
- Insurance
- −$74
- HOA
- −$387
- Vacancy / Maint / Mgmt
- −$324
- Net cashflow
- $-209
Break-even live
UW: 25.0% down · 7.5% · 30yr · 1.5% tax · 5.0% vac · 8.0% maint · 8.0% mgmt
Financing live
Cash to close
- Down payment
- $44,250
- Closing costs
- $5,310
- Reserves months
- —
- Total cash needed
- —
Loan-product check · same deal, 3 products live
Conventional
25% down · 7.5% · 30yr
- Down + closing
- —
- Monthly P&I
- —
- Monthly cashflow
- —
- DSCR
- —
- Eligible?
- —
Personal DTI + credit; lowest rate.
DSCR
20% down · 8.5% · 30yr
- Down + closing
- —
- Monthly P&I
- —
- Monthly cashflow
- —
- DSCR
- —
- Eligible?
- —
No personal income docs; deal must DSCR.
Hard money
10% down · 12.0% · 12mo
- Down + closing
- —
- Monthly P&I
- —
- Monthly cashflow
- —
- DSCR
- —
- Eligible?
- —
Short-term bridge; refi at stabilization.
Rent comps 10 comps
| Address | Beds | Baths | Sqft | Rent | $/sqft | DOM | Units | Dist |
|---|---|---|---|---|---|---|---|---|
| 275 Ozark Mountain Resort Dr Unit 51 Kimberling City, MO | 2.0 | 2.0 | 790 | $1,450 | $1.84 | 43d | 1 | 0.41mi |
| 225 Ozark Mountain Resort Dr #44 Kimberling City, MO | 2.0 | 2.0 | 750 | $1,100 | $1.47 | 43d | 1 | 0.42mi |
| 395 Ozark Mountain Resort Dr #60 Kimberling City, MO | 2.0 | 2.0 | 726 | $1,400 | $1.93 | 43d | 1 | 0.50mi |
| 11 Kimberling Blvd Unit A Kimberling City, MO | 2.0 | 2.0 | 1140 | $1,750 | $1.54 | 43d | 1 | 1.21mi |
| 3 Kimberling Blvd Unit A Kimberling City, MO | 2.0 | 2.0 | 1140 | $1,750 | $1.54 | 43d | 1 | 1.44mi |
| 2 C St Unit B Kimberling City, MO | 2.0 | 2.0 | 1140 | $1,750 | $1.54 | 43d | 1 | 1.47mi |
| 4 C St Unit B Kimberling City, MO | 2.0 | 2.0 | 1140 | $1,750 | $1.54 | 43d | 1 | 1.47mi |
| 6 C St Unit A Kimberling City, MO | 2.0 | 2.0 | 1140 | $1,750 | $1.54 | 43d | 1 | 1.47mi |
| 8 C St Unit B Kimberling City, MO | 2.0 | 2.0 | 1140 | $1,750 | $1.54 | 43d | 1 | 1.47mi |
| 10 C St Unit A Kimberling City, MO | 2.0 | 2.0 | 1140 | $1,750 | $1.54 | 43d | 1 | 1.47mi |
HOA detail
- Monthly dues
- $387 · $4,644/yr
- Likely covers
- waterpool
Listing history 34 events
-
2026-06-19days on market $177,000 Active 127 DOM
-
2026-06-18days on market $177,000 Active 126 DOM
-
2026-06-17days on market $177,000 Active 125 DOM
-
2026-06-16days on market $177,000 Active 124 DOM
-
2026-06-15days on market $177,000 Active 123 DOM
-
2026-06-14days on market $177,000 Active 121 DOM
-
2026-06-12days on market $177,000 Active 120 DOM
-
2026-06-09days on market $177,000 Active 117 DOM
-
2026-06-08days on market $177,000 Active 116 DOM
-
2026-06-07days on market $177,000 Active 115 DOM
-
2026-06-05days on market $177,000 Active 112 DOM
-
2026-06-03days on market $177,000 Active 111 DOM
-
2026-06-02days on market $177,000 Active 110 DOM
-
2026-06-01days on market $177,000 Active 109 DOM
-
2026-05-31days on market $177,000 Active 108 DOM
-
2026-05-30days on market $177,000 Active 107 DOM
-
2026-05-14price $177,000 1166-char remark
Show marketing remark (1166 chars)
Discover the perfect lake getaway with this Walk-In Winter Lakeview Condo located in a, highly convenient lakefront community just across the Kimberling City Bridge on Table Rock Lake, minutes from shopping, restaurants, grocery store conveniences. This beautifully updated 2-bedroom, 2-bathroom condo was completely renovated top-to-bottom in 2024, offering modern finishes and move-in-ready comfort. Enjoy the spacious covered deck that spans the full width of the unit, with direct access from both the living room and the primary bedroom, ideal for relaxing and taking in peaceful views year-round. The 3 little steps to walk-in entry makes access easy, and the unit also includes a 1-CAR ATTACHED GARAGE for added convenience and storage. The community amenities elevate the lifestyle with a clubhouse, swimming pool, and a community dock featuring a swim deck and fish cleaning station. A 10 x 24 BOATSLIP with a new tritoon lift is available for an additional $60,000, perfect for making the most of your time on the water. Don't miss this opportunity to own a fully updated, low-maintenance lake retreat in one of the area's most desirable condo communities!
-
2026-04-04price $192,000 1166-char remark
Show marketing remark (1166 chars)
Discover the perfect lake getaway with this Walk-In Winter Lakeview Condo located in a, highly convenient lakefront community just across the Kimberling City Bridge on Table Rock Lake, minutes from shopping, restaurants, grocery store conveniences. This beautifully updated 2-bedroom, 2-bathroom condo was completely renovated top-to-bottom in 2024, offering modern finishes and move-in-ready comfort. Enjoy the spacious covered deck that spans the full width of the unit, with direct access from both the living room and the primary bedroom, ideal for relaxing and taking in peaceful views year-round. The 3 little steps to walk-in entry makes access easy, and the unit also includes a 1-CAR ATTACHED GARAGE for added convenience and storage. The community amenities elevate the lifestyle with a clubhouse, swimming pool, and a community dock featuring a swim deck and fish cleaning station. A 10 x 24 BOATSLIP with a new tritoon lift is available for an additional $60,000, perfect for making the most of your time on the water. Don't miss this opportunity to own a fully updated, low-maintenance lake retreat in one of the area's most desirable condo communities!
-
2026-02-12$225,000 Active 1166-char remark
Show marketing remark (1166 chars)
Discover the perfect lake getaway with this Walk-In Winter Lakeview Condo located in a, highly convenient lakefront community just across the Kimberling City Bridge on Table Rock Lake, minutes from shopping, restaurants, grocery store conveniences. This beautifully updated 2-bedroom, 2-bathroom condo was completely renovated top-to-bottom in 2024, offering modern finishes and move-in-ready comfort. Enjoy the spacious covered deck that spans the full width of the unit, with direct access from both the living room and the primary bedroom, ideal for relaxing and taking in peaceful views year-round. The 3 little steps to walk-in entry makes access easy, and the unit also includes a 1-CAR ATTACHED GARAGE for added convenience and storage. The community amenities elevate the lifestyle with a clubhouse, swimming pool, and a community dock featuring a swim deck and fish cleaning station. A 10 x 24 BOATSLIP with a new tritoon lift is available for an additional $60,000, perfect for making the most of your time on the water. Don't miss this opportunity to own a fully updated, low-maintenance lake retreat in one of the area's most desirable condo communities!
-
2025-04-16status Active
-
2025-04-08price $225,000
-
2025-02-14price $235,000
-
2024-09-17$240,000 Active
-
2022-07-08soldstatus Closed
-
2022-07-08soldstatus
-
2022-06-25status Pending
-
2022-06-16status Active
-
2022-06-06historical
-
2022-06-05$199,700
-
2016-08-08soldstatus
-
2016-08-08soldstatus
-
2015-10-02$69,000
-
2012-06-07soldstatus
-
1996-12-01soldstatus
ⓘ Source: listings_history table (triggers on properties + properties_extension) + one-shot
backfill from property_details.listing_events for pre-trigger history.
Tax reassessment forecast MO · Resets to sale price
- Current annual tax
- $452 · $38/mo
- Projected year-2 tax
- $1,717 · $143/mo
- Expected delta
- +$1,265/yr (+$105/mo · 279.8%)
ⓘ Screening estimate from a state-policy table — verify with the county assessor before closing.
Climate risk First Street
- Flood 1/10 Low FEMA zone X (unshaded) · 0% chance over 30 yrs
- Wildfire 1/10 Low
- Heat 5/10 Major 7 d/yr ≥105°F today · 21 d/yr by 30 yrs out
- Wind 2/10 Low 100% chance of damaging wind over 30 yrs
- Air quality 2/10 Low 0 unhealthy d/yr today · 1 by 30 yrs out
Nearby sold comps map
Loading sold comps map…
Walkable amenities ~0.75 mi
Loading nearby amenities…
Taxation est. · year 1
- Rental income
- $18,491
- − Mortgage interest
- −$9,915
- − Property taxes
- −$452
- − Insurance
- −$885
- − Repairs & maintenance
- −$1,479
- − Management
- −$1,479
- − HOA
- −$4,644
- − Depreciation
- −$5,149
- Taxable loss
- −$5,513
- Est. tax savings @ 24.0%
- +$1,323
- After-tax cash flow
- $-1,189/yr
For passive investors: Depreciation is non-cash, so a rental often shows a tax loss while cash-flowing — sheltering income. Rental losses are passive: they offset passive income freely, and up to $25,000/yr can offset ordinary (W-2) income if you actively participate and your MAGI is under $100k (phasing out to $0 by $150k); unused losses carry forward. On sale, claimed depreciation is recaptured at up to 25%, and gains may owe capital-gains tax (a 1031 exchange can defer both). Figures are a year-1 estimate at your 24.0% rate — not tax advice; consult a CPA.
Schools (NCES district)
- District
- Blue Eye R-V
- NCES district ID
- 2905280
- Math proficiency
- 41% ▲ 3.00%
- Reading proficiency
- 47% ▼ -5.00%
- Median HH income
- $42,591
- Composite
- 37.08/100
- National rank
- #4500
- State rank
- #107 of 324 in MO
Livability — Kimberling City
- Score
- 69/100
- State rank
- #162
- US rank
- #8879
Category grades
Schools grade is shown separately in the Schools card above.
Census & demographics
- Population (ZIP)
- 4,487
Population outlook (Stone County) Hauer SSP2
- Today (2025)
- 28,147 people
- By 2030
- 26,405 · -6.2%
- By 2040
- 22,762 · -19.1%
- By 2050
- 19,706 · -30.0%
- By 2075
- 14,742 · -47.6%
- By 2100
- 10,832 · -61.5%
Race, ethnicity, and origin ACS 2023
- Neighborhood character
- Predominantly White (96%)
- Race & ethnicity
- White 96% Two or more races 3%
- Common ancestry
- Lithuanian 4% Italian 3% Slovak 2%
- Foreign-born
- 2% · Canada
- Languages at home
- 99% English-only · Other Asian/Pacific 0%
Political lean MEDSL · Stone
- 2024 margin
- Solid R (+61.4) · D 18.9% · R 80.3%
- 2008→2024 swing
- -24.1pp toward R · 2008: -37.3pp · 2024: -61.4pp
- All cycles
- 2024: R+61.4 2020: R+61.1 2016: R+62.1 2012: R+49.2 2008: R+37.3
Not yet ingested
- Civics
- —
Market trends
- HPI YoY
- ▼ -90.17%
- Current HPI
- 198.5699
- Rent YoY
- —
- Metro
- —
- State GDP YoY
- ▲ 1.84%
- F500 in state
- 20
Industry mix (Fortune 500 HQ in MO)
| Industry | F500 HQs | Revenue |
|---|---|---|
| Healthcare | 1 | $163B |
|
||
| Insurance | 1 | $21B |
|
||
| Industrial Technology | 1 | $17B |
|
||
| Retail | 1 | $16B |
|
||
| Industrial Distribution | 1 | $10B |
|
||
| Utilities | 1 | $9B |
|
||
Price history
+156.5% since first listed18 events — show timeline
- 2026-05-14 Price Changed $177,000 SOMO
- 2026-04-04 Price Changed $192,000 SOMO
- 2026-02-12 Listed $225,000 SOMO
- 2025-04-16 Relisted — SOMO
- 2025-04-08 Price Changed $225,000 SOMO
- 2025-02-14 Price Changed $235,000 SOMO
- 2024-09-17 Listed $240,000 SOMO
- 2022-07-08 Sold (Public Records) — Public Records
- 2022-07-08 Sold (MLS) — SOMO
- 2022-06-25 Pending — SOMO
- 2022-06-16 Relisted — SOMO
- 2022-06-06 Delisted — SOMO
- 2022-06-05 Listed $199,700 SOMO
- 2016-08-08 Sold (Public Records) — Public Records
- 2016-08-08 Sold (MLS) — SOMO
- 2015-10-02 Listed $69,000 SOMO
- 2012-06-07 Sold (Public Records) — Public Records
- 1996-12-01 Sold (Public Records) — Public Records
Property tax history
-0.9%/yrLatest (2025): $452 · +1.2% YoY. Source: county tax records.
Cash-flow waterfall
monthlySold comps — $/sqft
last 12 mo · ≤1 miLoading sold comps…