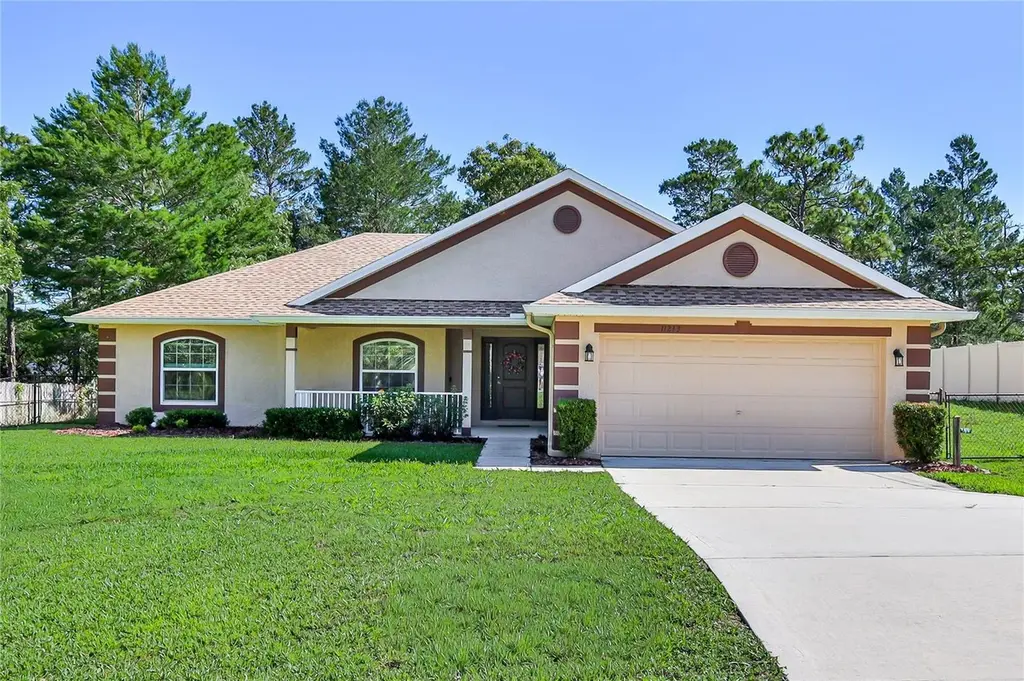
11213 Flock Ave · High Point, FL
Flood risk 1/10 · Minimal
- FEMA flood zone
- X (unshaded)
- Chance of flooding over 30 yrs
- 0.0%
- Est. flood insurance / yr
- $507 – $1,088
Fire risk 4/10 · Minor
- Est. fire insurance / yr
- $947 – $1,759
Heat risk 10/10 · Severe
- Hot days now (above 109°F)
- 7 days/yr
- Hot days in 30 yrs
- 25 days/yr
Wind risk 10/10 · Severe
- Chance of severe wind over 30 yrs
- 99.0%
Air-quality risk 2/10 · Minimal
- Unhealthy air days now
- 2 days/yr
- Unhealthy air days in 30 yrs
- 2 days/yr
Risk factors via First Street. Map © Google.
Why this score? — see what drove the F grade
The composite is a weighted blend of 9 inputs, each scored 0–100. Each bar is that input's sub-score; the figure is the points it added to the 100-point composite (weight × sub-score).
- Cash flow +13.1/30.0
- Schools +4.2/10.0
- DSCR +3.9/10.0
- Livability +3.2/5.0
- ARV discount +2.9/15.0
- 1% rule +2.6/10.0
- Rent growth +2.5/5.0
- Condition / age +2.5/5.0
- Appreciation +0.0/10.0
$340,000
🖨 Deal sheet 📄 Offer letter ✓ Due diligence
Listing remarks
Beautiful, updated 4/2/2 with NO HOA DUES AND NO CDD FEES, situated on . 46 acres & fully fenced. Original owner and very well cared for is obvious when you view it. The front of the home has A lovely front porch to sit out and enjoy the Florida weather. Lovely entry takes you to the upgraded kitchen equipped with Maple Wood Cabinets that are Staggered and Bumped Out. Newly upgraded Granite Counters, Subway Tile Backsplash and SS appliances. Range has convection oven too! The whole home has newer Luxury Vinyl Flooring. Baseboard is 5” all around the home. Very large dining area is convenient to the kitchen and great room. Open floor plan makes this home perfect for entertainin
Key facts
- Fully fenced
- Front porch
- Upgraded kitchen
Tags
Property features AI
Finance
- Other: Homestead exempt; Pets allowed
- HOA & community: No association
Exterior
- Parking: Attached 2-car garage
- Utilities: Well water; Septic tank; Cable available; Electricity connected
- Home design: Single-family residence; One story; South-facing
- Construction: Block and stucco construction; Shingle roof; Block foundation; Built by Adams
- Exterior features: Front porch; Rear porch; Screened porch; Rain gutters; Shed(s); Mature landscaping; Cleared and paved lot; Asphalt road access (publicly maintained)
Interior
- Kitchen: Convection oven; Dishwasher; Disposal; Microwave; Range; Refrigerator; Stone counters
- Bedrooms: 4 bedrooms
- Bathrooms: 2 full bathrooms
- Heating & cooling: Central heating; Central air conditioning
- Interior features: Ceiling fans; High ceilings; Kitchen–family room combo; Open floorplan; Solid wood cabinets; Split bedroom plan; Stone counters; Thermostat; Tray ceilings; Walk-in closets; Blinds
- Laundry & utility: Inside laundry with washer and dryer; Inside utility/Great Room connection; Irrigation equipment
Neighborhood map
What this means for you Summary
Snapshot
- This is a 4-bed/2.0-bath single-family listed at $340k.
Deal economics
- At list price, monthly cash flow is $-15 ($-175/yr) — negative.
- To cash-flow at today's rent, offer at most $337k (0.8% below list).
- To meet the 1% rule (rent ≥ 1% of price), the offer needs to be $258k (24.0% below list).
- Recommended offer: $258k (24.0% below list) — sets the bar for 1% rule.
Location & tenants
- Location reads 64/100 on livability (#677 in FL) — a middle-class / working-renter tenant base. Strengths: cost of living A+, housing A+, crime A; Watch: health & safety C-, schools F, amenities F.
- Hernando (suburban): math 50% / reading 50% proficiency, ranked #38 of 73 in FL (top 52%) — acceptable for families but not a draw, mixed tenant base, ~2y average lease.
- Market conditions: 691 active listings in the ZIP; 2 comparable units currently listed for rent nearby; 2,505 units permitted in Hernando County in 2024 (318 in 5+ unit buildings).
- At $2,583/mo this rent would consume 53% of the median local household income ($59k/yr) (locally 307% of renters already pay >50% of income on rent) — very limited rent-growth headroom before tenants either downsize or default.
Forward outlook
- Local home prices are declining (-3.0%/yr); year-one equity from $2k of loan paydown is wiped out by about $10k of value loss. Plan a longer hold.
- Hernando County population projected at +11% by 2050 — modest demand growth; plan on rents tracking national, not racing it.
Negotiation context
- It's been on market 30 days — a 2% lower offer ($335k) is reasonable based on typical stale-listing flexibility.
- Current owner paid $48k; list at $340k implies a 601% gain — meaningful room to come down on a strong offer.
Risks & watch-outs
- Climate carrying-cost: severe wind risk, 99% chance of damaging wind over 30y; extreme-heat days projected 7→25/yr by 2055 (HVAC capex compounding) — expect insurance premiums to compound above CPI over the hold.
Questions for the listing agent
- What do current leases actually rent for vs. the listed asking? Can we see a recent rent roll and the last 12 months of T-12 income?
- Is there a deadline driving the sale (1031 exchange, divorce, estate, relocation)? That informs how much negotiation room exists.
- Schools are F-rated, which usually means shorter tenancies and higher turnover. Who's the typical renter profile here, and what's been the actual vacancy rate?
- The area grade is low — what's the realistic commute time and amenity access for the typical tenant pool here? Any planned neighborhood developments (good or bad) we should know about?
- What's the average days-on-market for RENTAL listings here right now (not sales)? A rising rental-DOM trend means longer vacancies and softer asking-rent achievability than the comps imply.
- What's the recent tenant-quality profile in this submarket — average credit score on applications, eviction rate, late-payment / NSF rate, and stable-employment percentage? A property-management company in the area should have these aggregated.
- How much new for-sale + rental construction is in the pipeline within 1–3 miles? Heavy new supply typically softens prices + rents 12–24 months out; constrained supply supports both.
Investment metrics
- 1% rule
- 0.76% ✗
- Cap rate
- 6.24%
- Cash-on-cash
- -0.18%
- DSCR
- 0.99
- GRM
- 11.0
CMA / ARV
- ARV (on-the-fly)
- $308,704
- Comps found
- 12
Show comp detail 12 sales within ~0.75 mi
| Address | Dist | Beds/Ba | Sqft | Sold | Price | $/sf | Match |
|---|---|---|---|---|---|---|---|
| 11674 Memorial Dr | 0.54mi | 4/2.0 | 1,828 (+4%) | 1mo | $302,990 | $166 | 67 |
| 11617 Memorial Dr | 0.57mi | 4/2.0 | 1,665 (-5%) | 0mo | $291,990 | $175 | 65 |
| 11634 Memorial Dr | 0.57mi | 4/2.0 | 1,828 (+4%) | 2mo | $326,990 | $179 | 65 |
| 8104 Nightingale Rd | 0.61mi | 3/2.0 (-1) | 1,750 (-0%) | 2mo | $336,450 | $192 | 65 |
| 11641 Memorial Dr | 0.55mi | 4/2.0 | 1,665 (-5%) | 3mo | $275,990 | $166 | 64 |
| 11603 Memorial Dr | 0.58mi | 4/2.0 | 1,665 (-5%) | 1mo | $291,990 | $175 | 64 |
| 11568 Memorial Dr | 0.61mi | 4/2.0 | 1,665 (-5%) | 1mo | $292,990 | $176 | 62 |
| 11682 Memorial Dr | 0.53mi | 3/2.0 (-1) | 1,672 (-5%) | 3mo | $281,990 | $169 | 60 |
| 11644 Memorial Dr | 0.56mi | 3/2.0 (-1) | 1,672 (-5%) | 2mo | $310,000 | $185 | 60 |
| 11517 Timber Grove Ln | 0.64mi | 3/2.0 (-1) | 1,672 (-5%) | 2mo | $270,000 | $161 | 56 |
| 10494 Desert Sparrow Ave | 0.62mi | 3/2.0 (-1) | 1,564 (-11%) | 1mo | $370,000 | $237 | 47 |
| 11609 Memorial Dr | 0.58mi | 3/2.0 (-1) | 1,504 (-14%) | 2mo | $281,990 | $187 | 43 |
Match score weights: distance 35% · size 25% · config 20% · recency 20%. Top-matched comps best support the ARV.
Projected returns pro-forma
-3.0% appreciation · 3.0% rent growth · sell at horizon
- IRR
- -16.7%
- Equity multiple
- 0.41×
- Total profit
- $-56,167
- Equity at exit
- $50,695
- IRR
- -8.6%
- Equity multiple
- 0.47×
- Total profit
- $-50,684
- Equity at exit
- $29,397
Cash invested: $95,200 (down + closing). Projections, not guarantees.
Landlord ↔ Tenant lean methodology
- Overall (STATE)
- 87 Strongly Landlord-Friendly
- State Florida
- 87 Strongly Landlord-Friendly · R+3
- County
- — inherits STATE
- City
- — inherits STATE
ZIP-level market 34613
- Home prices YoY
- -17.2%
- Active inventory
- 691
- Price-to-rent
- 11.0×
Monthly cashflow live
- Estimated rent
- $2,583 medium interval (Pro) →
- Mortgage (P&I)
- −$1,783
- Tax from tax record
- −$130 /mo · $1,564/yr
- Insurance
- −$142
- HOA
- −$0
- Vacancy / Maint / Mgmt
- −$542
- Net cashflow
- $-15
Break-even live
UW: 25.0% down · 7.5% · 30yr · 1.5% tax · 5.0% vac · 8.0% maint · 8.0% mgmt
Financing live
Cash to close
- Down payment
- $85,000
- Closing costs
- $10,200
- Reserves months
- —
- Total cash needed
- —
Loan-product check · same deal, 3 products live
Conventional
25% down · 7.5% · 30yr
- Down + closing
- —
- Monthly P&I
- —
- Monthly cashflow
- —
- DSCR
- —
- Eligible?
- —
Personal DTI + credit; lowest rate.
DSCR
20% down · 8.5% · 30yr
- Down + closing
- —
- Monthly P&I
- —
- Monthly cashflow
- —
- DSCR
- —
- Eligible?
- —
No personal income docs; deal must DSCR.
Hard money
10% down · 12.0% · 12mo
- Down + closing
- —
- Monthly P&I
- —
- Monthly cashflow
- —
- DSCR
- —
- Eligible?
- —
Short-term bridge; refi at stabilization.
Rent comps 2 comps
| Address | Beds | Baths | Sqft | Rent | $/sqft | DOM | Units | Dist |
|---|---|---|---|---|---|---|---|---|
| 11285 Frigate Bird Ave Weeki Wachee, FL | 3.0 | 2.0 | 2053 | $2,225 | $1.08 | 24d | 1 | 0.27mi |
| 7718 Rome Ln Brooksville, FL | 3.0 | 2.0 | 1674 | $2,200 | $1.31 | 24d | 1 | 0.55mi |
Listing history 17 events
-
2026-06-18days on market $340,000 Active 30 DOM
-
2026-06-17days on market $340,000 Active 29 DOM
-
2026-06-16days on market $340,000 Active 28 DOM
-
2026-06-15days on market $340,000 Active 27 DOM
-
2026-06-13days on market $340,000 Active 25 DOM
-
2026-06-13days on market $340,000 Active 24 DOM
-
2026-06-09days on market $340,000 Active 21 DOM
-
2026-06-08days on market $340,000 Active 20 DOM
-
2026-06-07days on market $340,000 Active 19 DOM
-
2026-06-04days on market $340,000 Active 16 DOM
-
2026-06-03days on market $340,000 Active 15 DOM
-
2026-06-02days on market $340,000 Active 14 DOM
-
2026-06-01days on market $340,000 Active 13 DOM
-
2026-05-31days on market $340,000 Active 12 DOM
-
2026-05-19$340,000 Active
-
2005-09-14soldstatus $48,500
-
2005-08-15soldstatus $38,000
ⓘ Source: listings_history table (triggers on properties + properties_extension) + one-shot
backfill from property_details.listing_events for pre-trigger history.
Tax reassessment forecast FL · Resets to sale price
- Current annual tax
- $1,564 · $130/mo
- Projected year-2 tax
- $2,822 · $235/mo
- Expected delta
- +$1,258/yr (+$105/mo · 80.4%)
ⓘ Screening estimate from a state-policy table — verify with the county assessor before closing.
Climate risk First Street
- Flood 1/10 Low FEMA zone X (unshaded) · 0% chance over 30 yrs
- Wildfire 4/10 Moderate
- Heat 10/10 Extreme 7 d/yr ≥109°F today · 25 d/yr by 30 yrs out
- Wind 10/10 Extreme 99% chance of damaging wind over 30 yrs
- Air quality 2/10 Low 2 unhealthy d/yr today · 2 by 30 yrs out
Nearby sold comps map
Loading sold comps map…
Walkable amenities ~0.75 mi
Loading nearby amenities…
Taxation est. · year 1
- Rental income
- $30,993
- − Mortgage interest
- −$19,045
- − Property taxes
- −$1,564
- − Insurance
- −$1,700
- − Repairs & maintenance
- −$2,479
- − Management
- −$2,479
- − Depreciation
- −$9,891
- Taxable loss
- −$6,166
- Est. tax savings @ 24.0%
- +$1,480
- After-tax cash flow
- $1,305/yr
For passive investors: Depreciation is non-cash, so a rental often shows a tax loss while cash-flowing — sheltering income. Rental losses are passive: they offset passive income freely, and up to $25,000/yr can offset ordinary (W-2) income if you actively participate and your MAGI is under $100k (phasing out to $0 by $150k); unused losses carry forward. On sale, claimed depreciation is recaptured at up to 25%, and gains may owe capital-gains tax (a 1031 exchange can defer both). Figures are a year-1 estimate at your 24.0% rate — not tax advice; consult a CPA.
Schools (NCES district)
- District
- Hernando
- NCES district ID
- 1200810
- Math proficiency
- 50% ▼ -8.00%
- Reading proficiency
- 50% ▼ -4.00%
- Median HH income
- $41,985
- Composite
- 42.03/100
- National rank
- #3329
- State rank
- #38 of 73 in FL
Livability — High Point
- Score
- 64/100
- State rank
- #677
- US rank
- #14099
Category grades
Schools grade is shown separately in the Schools card above.
Census & demographics
- Census place
- High Point, FL
- County
- Hernando County · 169,677 people
- Metro
- Tampa-St. Petersburg-Clearwater, FL
- Population (ZIP)
- 19,337
- Household income
- $58,596
- Rent vs Own
- Severe rent burden
- 307.0
Population outlook (Hernando County) Hauer SSP2
- Today (2025)
- 189,218 people
- By 2030
- 194,367 · +2.7%
- By 2040
- 203,398 · +7.5%
- By 2050
- 209,589 · +10.8%
- By 2075
- 218,452 · +15.4%
- By 2100
- 205,923 · +8.8%
Race, ethnicity, and origin ACS 2023
- Neighborhood character
- Predominantly White (88%)
- Race & ethnicity
- White 88% Hispanic / Latino 6% Two or more races 4% Black 2% Asian 1%
- Hispanic origin (detail)
- Mexican 1% Puerto Rican 2% Cuban 1%
- Common ancestry
- Romanian 4% Lithuanian 3% Slovak 2%
- Foreign-born
- 8% · Canada, Vietnam
- Languages at home
- 92% English-only · Spanish 3% French/Haitian/Cajun 1% Russian/Polish/Slavic 1%
Political lean MEDSL · Hernando
- 2024 margin
- Solid R (+37.0) · D 31.1% · R 68.2%
- 2008→2024 swing
- -33.5pp toward R · 2008: -3.6pp · 2024: -37.0pp
- All cycles
- 2024: R+37.0 2020: R+30.2 2016: R+29.0 2012: R+8.5 2008: R+3.6
Not yet ingested
- Civics
- —
Market trends
- HPI YoY
- ▼ -57.51%
- Current HPI
- 276.2229
- Rent YoY
- —
- Metro
- Tampa-St. Petersburg-Clearwater, FL
- State GDP YoY
- ▲ 3.28%
- F500 in state
- 36
Industry mix (Fortune 500 HQ in FL)
| Industry | F500 HQs | Revenue |
|---|---|---|
| Industrial Technology | 2 | $29B |
|
||
| Insurance | 2 | $17B |
|
||
| Retail | 1 | $60B |
|
||
| Technology Distribution | 1 | $58B |
|
||
| Homebuilding | 1 | $35B |
|
||
| Technology Manufacturing | 1 | $35B |
|
||
Price history
+794.7% since first listed3 events — show timeline
- 2026-05-19 Listed $340,000 Stellar MLS as Distributed by MLS Grid
- 2005-09-14 Sold (Public Records) $48,500 Public Records
- 2005-08-15 Sold (Public Records) $38,000 Public Records
Property tax history
+3.3%/yrLatest (2025): $1,564 · +0.1% YoY. Source: county tax records.
Cash-flow waterfall
monthlySold comps — $/sqft
last 12 mo · ≤1 miLoading sold comps…