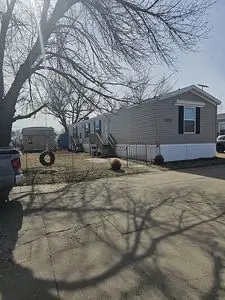
12339 Earl Ave · Blair, NE
Flood risk No data
- FEMA flood zone
- —
- Chance of flooding over 30 yrs
- —
- Est. flood insurance / yr
- —
Fire risk No data
- Est. fire insurance / yr
- —
Heat risk 3/10 · Minor
- Hot days now (above threshold)
- 7 days/yr
- Hot days in 30 yrs
- 15 days/yr
Wind risk No data
- Chance of severe wind over 30 yrs
- —
Air-quality risk 1/10 · Minimal
- Unhealthy air days now
- 0 days/yr
- Unhealthy air days in 30 yrs
- 0 days/yr
Risk factors via First Street. Map © Google.
Why this score? — see what drove the B grade
The composite is a weighted blend of 9 inputs, each scored 0–100. Each bar is that input's sub-score; the figure is the points it added to the 100-point composite (weight × sub-score).
- Cash flow +30.0/30.0
- 1% rule +10.0/10.0
- DSCR +10.0/10.0
- ARV discount +7.5/15.0
- Schools +4.6/10.0
- Livability +4.0/5.0
- Rent growth +2.5/5.0
- Condition / age +2.2/5.0
- Appreciation +0.0/10.0
$73,000
🖨 Deal sheet 📄 Offer letter ✓ Due diligence
Listing remarks
Enjoy easy living in this area just South of Blair on Hwy 133. This has everything you need to settle in and enjoy with appliances included such as the dishwasher, microwave, stove/oven, and refrigerator. Added space with an 8 x 12 storage shed included for all your storage necessities. Parted fenced in yard with a front gate. Make this priced right home yours today!! Subject to approval and background check from Country Estate Mobile Home Community.
Key facts
- Front gate
- Storage shed
- Appliances included
Tags
Neighborhood map
What this means for you Summary
Snapshot
- This is a 3-bed/2.0-bath single-family listed at $73k. Condition is rated fair.
Deal economics
- At list price, monthly cash flow is $577 ($7k/yr) — positive.
- The deal already cash-flows at list — no discount required.
- Meets the 1% rule at list price ($1k rent vs $73k).
- Recommended offer: $72k (1.5% below list) — sets the bar for market timing.
- Cap rate 15.8% vs local median 2.2% in Blair — top-decile yield for the area; either an underpriced asset or a hidden risk that comps aren't pricing in. Stress-test before assuming the spread holds.
Location & tenants
- Location reads 80/100 on livability (#25 in NE, #1,668 nationally) — a professional / high-income tenant draw. Strengths: crime A+, cost of living A+, housing A+; Watch: amenities F, commute F.
- Blair Community Schools (town): math 55% / reading 51% proficiency, ranked #46 of 111 in NE (top 41%) — acceptable for families but not a draw, mixed tenant base, ~2y average lease; only 18% free/reduced lunch — higher-income household profile.
- Market conditions: 186 active listings in the ZIP; 80 units permitted in Washington County in 2024 (0 in 5+ unit buildings).
Forward outlook
- Local home prices are declining (-3.0%/yr); year-one equity from $505 of loan paydown is wiped out by about $2k of value loss. Plan a longer hold.
- Washington County population projected to shrink 6% by 2050 — rents likely to lag national; underwrite the cash flow, not the appreciation.
- At projected returns (-3.0% appreciation + 3.0% rent growth), your $20k cash investment doubles in ~4 years — after that, you're playing with house money.
Negotiation context
- It's been on market 23 days — a 2% lower offer ($72k) is reasonable based on typical stale-listing flexibility.
Questions for the listing agent
- Have any recent inspections been done? Can we get a copy of the seller's disclosures and any deferred-maintenance estimates?
- Is there a deadline driving the sale (1031 exchange, divorce, estate, relocation)? That informs how much negotiation room exists.
- Schools are A-rated — typically a magnet for longer-tenancy family renters. What's the average tenant stay here, and is there a school-zone premium baked into asking?
- What's the average days-on-market for RENTAL listings here right now (not sales)? A rising rental-DOM trend means longer vacancies and softer asking-rent achievability than the comps imply.
- What's the recent tenant-quality profile in this submarket — average credit score on applications, eviction rate, late-payment / NSF rate, and stable-employment percentage? A property-management company in the area should have these aggregated.
- How much new for-sale + rental construction is in the pipeline within 1–3 miles? Heavy new supply typically softens prices + rents 12–24 months out; constrained supply supports both.
Investment metrics
- 1% rule
- 1.78% ✓
- Cap rate
- 15.78%
- Cash-on-cash
- 33.87%
- DSCR
- 2.51
- GRM
- 4.7
CMA / ARV
No comps found within radius.
Projected returns pro-forma
-3.0% appreciation · 3.0% rent growth · sell at horizon
- IRR
- 29.2%
- Equity multiple
- 2.22×
- Total profit
- $24,903
- Equity at exit
- $10,885
- IRR
- 36.5%
- Equity multiple
- 4.37×
- Total profit
- $68,948
- Equity at exit
- $6,312
Cash invested: $20,440 (down + closing). Projections, not guarantees.
Landlord ↔ Tenant lean methodology
- Overall (STATE)
- 83 Strongly Landlord-Friendly
- State Nebraska
- 83 Strongly Landlord-Friendly · R+13
- County
- — inherits STATE
- City
- — inherits STATE
ZIP-level market 68008
- Active inventory
- 186
- Price-to-rent
- 4.7×
Monthly cashflow live
- Estimated rent
- $1,302 medium interval (Pro) →
- Mortgage (P&I)
- −$383
- Tax from tax record
- −$38 /mo · $460/yr
- Insurance
- −$30
- HOA
- −$0
- Vacancy / Maint / Mgmt
- −$273
- Net cashflow
- $577
Break-even live
UW: 25.0% down · 7.5% · 30yr · 1.5% tax · 5.0% vac · 8.0% maint · 8.0% mgmt
Financing live
Cash to close
- Down payment
- $18,250
- Closing costs
- $2,190
- Reserves months
- —
- Total cash needed
- —
Loan-product check · same deal, 3 products live
Conventional
25% down · 7.5% · 30yr
- Down + closing
- —
- Monthly P&I
- —
- Monthly cashflow
- —
- DSCR
- —
- Eligible?
- —
Personal DTI + credit; lowest rate.
DSCR
20% down · 8.5% · 30yr
- Down + closing
- —
- Monthly P&I
- —
- Monthly cashflow
- —
- DSCR
- —
- Eligible?
- —
No personal income docs; deal must DSCR.
Hard money
10% down · 12.0% · 12mo
- Down + closing
- —
- Monthly P&I
- —
- Monthly cashflow
- —
- DSCR
- —
- Eligible?
- —
Short-term bridge; refi at stabilization.
Listing history 14 events
-
2026-06-18days on market $73,000 Active 23 DOM
-
2026-06-17days on market $73,000 Active 22 DOM
-
2026-06-16days on market $73,000 Active 21 DOM
-
2026-06-15days on market $73,000 Active 20 DOM
-
2026-06-13days on market $73,000 Active 18 DOM
-
2026-06-10days on market $73,000 Active 15 DOM
-
2026-06-09days on market $73,000 Active 14 DOM
-
2026-06-08days on market $73,000 Active 13 DOM
-
2026-06-07days on market $73,000 Active 12 DOM
-
2026-06-03days on market $73,000 Active 8 DOM
-
2026-06-03days on market $73,000 Active 7 DOM
-
2026-06-01days on market $73,000 Active 6 DOM
-
2026-05-31days on market $73,000 Active 5 DOM
-
2026-05-26$73,000 Active
ⓘ Source: listings_history table (triggers on properties + properties_extension) + one-shot
backfill from property_details.listing_events for pre-trigger history.
Tax reassessment forecast NE · Resets to sale price
- Current annual tax
- $460 · $38/mo
- Projected year-2 tax
- $1,263 · $105/mo
- Expected delta
- +$803/yr (+$67/mo · 174.6%)
ⓘ Screening estimate from a state-policy table — verify with the county assessor before closing.
Climate risk First Street
- Heat 3/10 Moderate
- Air quality 1/10 Low 0 unhealthy d/yr today · 0 by 30 yrs out
Nearby sold comps map
Loading sold comps map…
Walkable amenities ~0.75 mi
Loading nearby amenities…
Taxation est. · year 1
- Rental income
- $15,623
- − Mortgage interest
- −$4,089
- − Property taxes
- −$460
- − Insurance
- −$365
- − Repairs & maintenance
- −$1,250
- − Management
- −$1,250
- − Depreciation
- −$2,124
- Taxable income
- $6,085
- Est. tax owed @ 24.0%
- −$1,461
- After-tax cash flow
- $5,463/yr
For passive investors: Depreciation is non-cash, so a rental often shows a tax loss while cash-flowing — sheltering income. Rental losses are passive: they offset passive income freely, and up to $25,000/yr can offset ordinary (W-2) income if you actively participate and your MAGI is under $100k (phasing out to $0 by $150k); unused losses carry forward. On sale, claimed depreciation is recaptured at up to 25%, and gains may owe capital-gains tax (a 1031 exchange can defer both). Figures are a year-1 estimate at your 24.0% rate — not tax advice; consult a CPA.
Condition & rehab AI · 1 photo
This mobile home requires significant repairs and updates to improve its condition and value. Exterior siding, roof, and interior repairs are critical.
Repairs flagged
- Major exterior siding — Weathered and possibly damaged
- Major roof — No visible damage, but the mobile home appears old
- Major flooring — No visible flooring, but the mobile home appears old
- Major interior walls/paint — No visible interior, but the mobile home appears old
- Major bathrooms — No visible bathrooms, but the mobile home appears old
- Major kitchen — No visible kitchen, but the mobile home appears old
- Major HVAC/mechanicals — No visible HVAC/mechanicals, but the mobile home appears old
- Major landscaping — No visible landscaping, but the mobile home appears old
Value-add opportunities
- Both exterior siding repair — Improves curb appeal and value
- Both HVAC upgrade — Enhances comfort and energy efficiency
- Both paint interior and exterior — Enhances appearance and value
- Both landscaping — Improves curb appeal and value
Renovation cost estimate screening
| Repair item | Severity | Est. cost |
|---|---|---|
| exterior siding · Weathered and possibly damaged | Major | $15,000–50,000 |
| roof · No visible damage, but the mobile home appears old | Major | $15,000–50,000 |
| flooring · No visible flooring, but the mobile home appears old | Major | $15,000–50,000 |
| interior walls/paint · No visible interior, but the mobile home appears old | Major | $15,000–50,000 |
| bathrooms · No visible bathrooms, but the mobile home appears old | Major | $15,000–50,000 |
| kitchen · No visible kitchen, but the mobile home appears old | Major | $15,000–50,000 |
| HVAC/mechanicals · No visible HVAC/mechanicals, but the mobile home appears old | Major | $15,000–50,000 |
| landscaping · No visible landscaping, but the mobile home appears old | Major | $15,000–50,000 |
| Total estimated repair cost · 8 items | $120,000–400,000 |
Value-add ROI direction
- Both exterior siding repair — Improves curb appeal and value ↑
- Both HVAC upgrade — Enhances comfort and energy efficiency ↑
- Both paint interior and exterior — Enhances appearance and value ↑
- Both landscaping — Improves curb appeal and value ↑
ⓘ Cost ranges are severity-bucket heuristics (US national rule-of-thumb). Get contractor quotes + a written scope before underwriting a rehab budget.
Schools (NCES district)
- District
- Blair Community Schools
- NCES district ID
- 3104100
- Math proficiency
- 55% ▼ -5.00%
- Reading proficiency
- 51% ▼ -9.00%
- Median HH income
- $62,205
- Composite
- 46.47/100
- National rank
- #2439
- State rank
- #46 of 111 in NE
Livability — Blair
- Score
- 80/100
- State rank
- #25
- US rank
- #1668
Category grades
Schools grade is shown separately in the Schools card above.
Census & demographics
- Population (ZIP)
- 12,906
Population outlook (Washington County) Hauer SSP2
- Today (2025)
- 20,361 people
- By 2030
- 20,293 · -0.3%
- By 2040
- 19,861 · -2.5%
- By 2050
- 19,080 · -6.3%
- By 2075
- 17,987 · -11.7%
- By 2100
- 16,240 · -20.2%
Race, ethnicity, and origin ACS 2023
- Neighborhood character
- Predominantly White (95%)
- Race & ethnicity
- White 95% Two or more races 3% Hispanic / Latino 2%
- Common ancestry
- Portuguese 6% Romanian 4% Lithuanian 2%
- Foreign-born
- 1%
- Languages at home
- 98% English-only · Spanish 1%
Political lean MEDSL · Washington
- 2024 margin
- Solid R (+42.4) · D 28.2% · R 70.6% · Other 1.2%
- 2008→2024 swing
- -16.1pp toward R · 2008: -26.3pp · 2024: -42.4pp
- All cycles
- 2024: R+42.4 2020: R+40.3 2016: R+45.0 2012: R+37.1 2008: R+26.3
Not yet ingested
- Civics
- —
Market trends
- HPI YoY
- ▼ -135.43%
- Current HPI
- 207.5425
- Rent YoY
- —
- Metro
- —
- State GDP YoY
- ▲ 0.68%
- F500 in state
- 2
Industry mix (Fortune 500 HQ in NE)
| Industry | F500 HQs | Revenue |
|---|---|---|
| Conglomerate | 1 | $371B |
|
||
Price history
1 event — show timeline
- 2026-05-26 Listed $73,000 FSBO.com
Property tax history
-12.7%/yrLatest (2025): $460 · +9.2% YoY. Source: county tax records.
Cash-flow waterfall
monthlySold comps — $/sqft
last 12 mo · ≤1 miLoading sold comps…