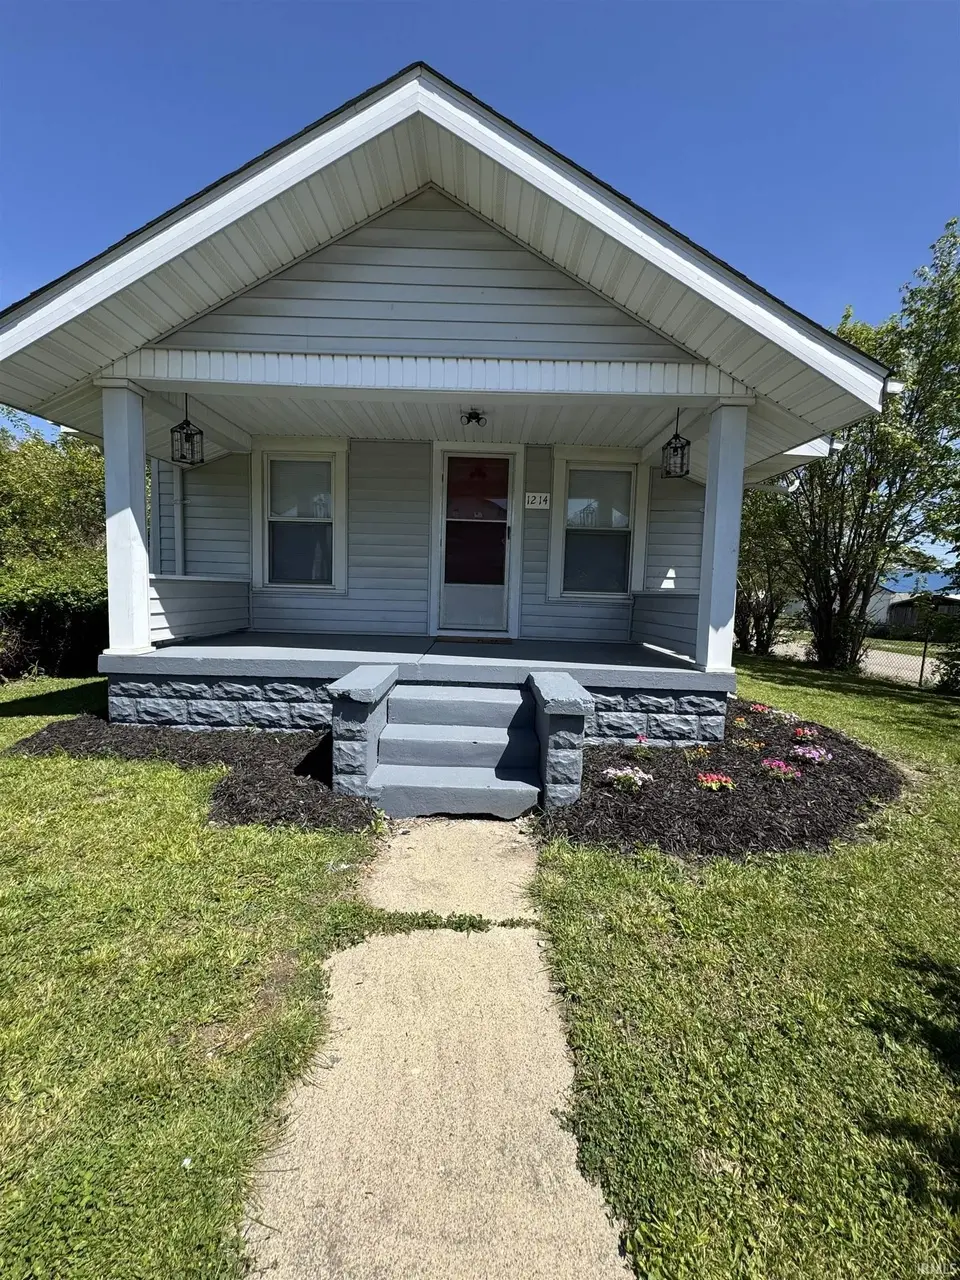
1214 E 28th St · Anderson, IN
Flood risk 1/10 · Minimal
- FEMA flood zone
- X (unshaded)
- Chance of flooding over 30 yrs
- 0.0%
- Est. flood insurance / yr
- $473 – $860
Fire risk 1/10 · Minimal
- Est. fire insurance / yr
- $717 – $1,331
Heat risk 3/10 · Minor
- Hot days now (above 100°F)
- 7 days/yr
- Hot days in 30 yrs
- 18 days/yr
Wind risk 2/10 · Minimal
- Chance of severe wind over 30 yrs
- 0.0%
Air-quality risk 3/10 · Minor
- Unhealthy air days now
- 2 days/yr
- Unhealthy air days in 30 yrs
- 3 days/yr
Risk factors via First Street. Map © Google.
Why this score? — see what drove the D grade
The composite is a weighted blend of 9 inputs, each scored 0–100. Each bar is that input's sub-score; the figure is the points it added to the 100-point composite (weight × sub-score).
- Cash flow +20.9/30.0
- DSCR +6.7/10.0
- 1% rule +5.2/10.0
- Rent growth +4.5/5.0
- Livability +3.0/5.0
- Condition / age +2.5/5.0
- Schools +1.6/10.0
- ARV discount +0.0/15.0
- Appreciation +0.0/10.0
$89,900
🖨 Deal sheet 📄 Offer letter ✓ Due diligence
Listing remarks MLS
Come take a look at this cozy 2 bed, 1 bath home located on the SE side of Anderson! Residence is situated on a corner lot, has a covered front porch and a nice sized deck off the back of the residence. Inside you will find a large living rm/dining rm combo, kitchen, a jack and jill bath, laundry room on main and some original hardwood floors. Home sits on top of a partial basement and perfect for extra storage.
Key facts
- Covered front porch
- Laundry room on main
- Jack and jill bath
Tags
Property features AI
Exterior
- Parking: On-street parking
- Utilities: Public water; Municipal sewer; 200+ amp electrical service; Electricity connected; Natural gas connected; Sewer connected; Water connected
- Home design: Single-family residence; One story
- Construction: Vinyl siding; Block foundation
- Exterior features: Covered porch; Deck; Corner lot; Sidewalks; Storm sewer; Street lights
Interior
- Kitchen: Gas oven; Microwave; Refrigerator
- Bedrooms: 2 bedrooms on the main level
- Flooring: Hardwood floors
- Bathrooms: 1 full bathroom on the main level
- Heating & cooling: Forced air heating (natural gas); Window air conditioning units
- Interior features: Hardwood floors; Woodwork painted
- Laundry & utility: Main-level laundry; Washer; Dryer; Water heater
Neighborhood map
What this means for you Summary
Snapshot
- This is a 2-bed/1.0-bath single-family listed at $90k.
Deal economics
- At list price, monthly cash flow is $125 ($2k/yr) — positive.
- The deal already cash-flows at list — no discount required.
- Meets the 1% rule at list price ($919 rent vs $90k).
- Recommended offer: $89k (1.5% below list) — sets the bar for market timing.
- Cap rate 8.0% vs local median 6.5% in Anderson — meaningfully above typical; check what's discounted (condition, days-on-market, listing class) to confirm the premium yield is real.
Location & tenants
- Location reads 60/100 on livability (#521 in IN) — a middle-class / working-renter tenant base. Strengths: cost of living A+, housing A+; Watch: schools F, crime D-, amenities F.
- Anderson Community School Corporation (urban): math 15% / reading 23% proficiency, ranked #280 of 301 in IN (top 93%) — low school quality limits family demand, transient renter base, plan for 1-2y turnover; 70% free/reduced lunch — lower-income household profile, screen leases tightly.
- Market conditions: Rents rising fast (+7.9%/yr); 185 active listings in the ZIP; 40 comparable units currently listed for rent nearby; rentals at typical pace (median 24d on market — plan ~3-4 weeks tenant-placement turnaround); 45% of comp listings sitting > 30 days — soft ceiling on asking rent; lower-income renter base — watch delinquency; 184 units permitted in Madison County in 2024 (0 in 5+ unit buildings).
- This rent runs 31% of the median local income ($36k/yr) — at the standard rent-burdened threshold; future hikes will face affordability resistance.
Forward outlook
- Local home prices are declining (-3.0%/yr); year-one equity from $622 of loan paydown is wiped out by about $3k of value loss. Plan a longer hold.
- Madison County population projected at -14% by 2050 — secular population decline; favor cash flow + early exit over multi-decade hold.
- At projected returns (-3.0% appreciation + 7.9% rent growth), your $25k cash investment doubles in ~9 years — after that, you're playing with house money.
Negotiation context
- It's been on market 30 days — a 2% lower offer ($89k) is reasonable based on typical stale-listing flexibility.
- 3 sale attempts since 19y ago; this cycle's ask has dropped $10k (10%) from the opening price — seller is motivated, your offer sets the floor, not the list.
Risks & watch-outs
- Watch-outs: built in 1920 — expect roof / HVAC / electrical / plumbing capex.
Questions for the listing agent
- Built in 1920 — when were the roof, HVAC, electrical panel, plumbing, and water heater last replaced?
- Is there a deadline driving the sale (1031 exchange, divorce, estate, relocation)? That informs how much negotiation room exists.
- Schools are F-rated, which usually means shorter tenancies and higher turnover. Who's the typical renter profile here, and what's been the actual vacancy rate?
- Crime grade is D in this area — have there been break-ins, vandalism, or insurance claims at this property in the last 3 years? What carrier currently insures it and at what premium?
- The area grade is low — what's the realistic commute time and amenity access for the typical tenant pool here? Any planned neighborhood developments (good or bad) we should know about?
- What's the average days-on-market for RENTAL listings here right now (not sales)? A rising rental-DOM trend means longer vacancies and softer asking-rent achievability than the comps imply.
- What's the recent tenant-quality profile in this submarket — average credit score on applications, eviction rate, late-payment / NSF rate, and stable-employment percentage? A property-management company in the area should have these aggregated.
- How much new for-sale + rental construction is in the pipeline within 1–3 miles? Heavy new supply typically softens prices + rents 12–24 months out; constrained supply supports both.
Investment metrics
- 1% rule
- 1.02% ✓
- Cap rate
- 7.97%
- Cash-on-cash
- 5.97%
- DSCR
- 1.27
- GRM
- 8.2
CMA / ARV
- ARV (on-the-fly)
- $69,696
- Comps found
- 10
Show comp detail 10 sales within ~0.75 mi
| Address | Dist | Beds/Ba | Sqft | Sold | Price | $/sf | Match |
|---|---|---|---|---|---|---|---|
| 2911 E Lynn St | 0.14mi | 2/1.0 | 1,092 (+13%) | 8mo | $70,000 | $64 | 65 |
| 826 E 31st St | 0.31mi | 2/1.0 | 1,056 (+9%) | 8mo | $132,500 | $125 | 64 |
| 2639 Central Ave | 0.68mi | 2/1.0 | 952 (-2%) | 8mo | $57,000 | $60 | 58 |
| 717 E 27th St | 0.31mi | 2/1.0 | 1,092 (+13%) | 12mo | $74,900 | $69 | 54 |
| 1221 E 22nd St | 0.42mi | 2/1.0 | 864 (-11%) | 12mo | $65,000 | $75 | 52 |
| 1718 Cincinnati Ave | 0.71mi | 2/1.0 | 898 (-7%) | 4mo | $115,000 | $128 | 52 |
| 220 E 29th St | 0.64mi | 2/1.0 | 924 (-4%) | 15mo | $90,000 | $97 | 50 |
| 3434 Forrest Ter | 0.56mi | 1/1.0 (-1) | 882 (-9%) | 12mo | $54,000 | $61 | 44 |
| 3507 Columbus Ave | 0.62mi | 2/1.0 | 832 (-14%) | 4mo | $60,000 | $72 | 44 |
| 3546 Clark St | 0.64mi | 2/1.0 | 1,044 (+8%) | 18mo | $65,500 | $63 | 42 |
Match score weights: distance 35% · size 25% · config 20% · recency 20%. Top-matched comps best support the ARV.
Projected returns pro-forma
-3.0% appreciation · 7.88% rent growth · sell at horizon
- IRR
- -1.9%
- Equity multiple
- 0.93×
- Total profit
- $-1,855
- Equity at exit
- $13,404
- IRR
- 12.4%
- Equity multiple
- 2.20×
- Total profit
- $30,148
- Equity at exit
- $7,773
Cash invested: $25,172 (down + closing). Projections, not guarantees.
Landlord ↔ Tenant lean methodology
- Overall (STATE)
- 90 Strongly Landlord-Friendly
- State Indiana
- 90 Strongly Landlord-Friendly · R+11
- County
- — inherits STATE
- City
- — inherits STATE
ZIP-level market 46016
- Home prices YoY
- -3.5%
- Rents YoY
- 7.9%
- Active inventory
- 185
- Price-to-rent
- 8.2×
Monthly cashflow live
- Estimated rent
- $919 high interval (Pro) →
- Mortgage (P&I)
- −$471
- Tax from tax record
- −$91 /mo · $1,098/yr
- Insurance
- −$37
- HOA
- −$0
- Vacancy / Maint / Mgmt
- −$193
- Net cashflow
- $125
Break-even live
UW: 25.0% down · 7.5% · 30yr · 1.5% tax · 5.0% vac · 8.0% maint · 8.0% mgmt
Financing live
Cash to close
- Down payment
- $22,475
- Closing costs
- $2,697
- Reserves months
- —
- Total cash needed
- —
Loan-product check · same deal, 3 products live
Conventional
25% down · 7.5% · 30yr
- Down + closing
- —
- Monthly P&I
- —
- Monthly cashflow
- —
- DSCR
- —
- Eligible?
- —
Personal DTI + credit; lowest rate.
DSCR
20% down · 8.5% · 30yr
- Down + closing
- —
- Monthly P&I
- —
- Monthly cashflow
- —
- DSCR
- —
- Eligible?
- —
No personal income docs; deal must DSCR.
Hard money
10% down · 12.0% · 12mo
- Down + closing
- —
- Monthly P&I
- —
- Monthly cashflow
- —
- DSCR
- —
- Eligible?
- —
Short-term bridge; refi at stabilization.
Rent comps 40 comps
| Address | Beds | Baths | Sqft | Rent | $/sqft | DOM | Units | Dist |
|---|---|---|---|---|---|---|---|---|
| 1232 E 28th St Anderson, IN | 2.0 | 2.0 | 795 | $950 | $1.19 | 43d | 1 | 0.04mi |
| 3009 E Lynn St Unit 1 Anderson, IN | 3.0 | 1.0 | 1000 | $875 | $0.88 | 20d | 1 | 0.24mi |
| 1501 E 31st St Anderson, IN | 2.0 | 1.0 | 840 | $1,199 | $1.43 | 20d | 1 | 0.32mi |
| 2233 E Lynn St Anderson, IN | 1.0 | 1.0 | 700 | $695 | $0.99 | 1d | 1 | 0.35mi |
| 3006 Noble St Anderson, IN | 2.0 | 1.0 | 1064 | $995 | $0.94 | 7d | 1 | 0.43mi |
| 702 E 23rd St Anderson, IN | 1.0 | 1.0 | 560 | $595 | $1.06 | 14d | 1 | 0.46mi |
| 328 E 31st St Anderson, IN | 1.0 | 1.0 | 600 | $750 | $1.25 | 43d | 1 | 0.61mi |
| 2002 Jefferson St Unit 3 Anderson, IN | 1.0 | 2.0 | 725 | $600 | $0.83 | 43d | 1 | 0.62mi |
| 3000 Fletcher St Unit 3000 Anderson, IN | 2.0 | 1.0 | 800 | $650 | $0.81 | 43d | 1 | 0.63mi |
| 1719 Johnson Ave Anderson, IN | 1.0 | 1.0 | 616 | $824 | $1.34 | 43d | 1 | 0.71mi |
| 3614 Columbus Ave Anderson, IN | 1.0 | 1.0 | 553 | $725 | $1.31 | 14d | 1 | 0.72mi |
| 2625 Main St Anderson, IN | 2.0 | 1.0 | 988 | $895 | $0.91 | 23d | 1 | 0.74mi |
| 1710 Jefferson St Apt 2 Anderson, IN | 2.0 | 1.0 | 550 | $950 | $1.73 | 43d | 1 | 0.76mi |
| 1726-1728 Walnut St Anderson, IN | 2.0 | 2.0 | 900 | $995 | $1.11 | 1d | 1 | 0.80mi |
| 2111 Central Ave Anderson, IN | 3.0 | 1.0 | 1026 | $1,250 | $1.22 | 43d | 1 | 0.81mi |
| 1411 Home Ave Anderson, IN | 3.0 | 1.0 | 810 | $1,295 | $1.60 | 23d | 1 | 1.01mi |
| 2627 Chase St Anderson, IN | 3.0 | 1.0 | 1050 | $850 | $0.81 | 17d | 1 | 1.06mi |
| 2324 Chase St Anderson, IN | 2.0 | 1.0 | 783 | $950 | $1.21 | 43d | 1 | 1.07mi |
| 2904 Lincoln St Anderson, IN | 2.0 | 1.0 | 864 | $900 | $1.04 | 43d | 1 | 1.10mi |
| 221 E 13th St Anderson, IN | 1.0 | 1.0 | 595 | $995 | $1.67 | 14d | 1 | 1.15mi |
| 219 E 13th St Anderson, IN | 3.0 | 1.0 | 882 | $1,000 | $1.13 | 3d | 1 | 1.16mi |
| 2442 Morton St Anderson, IN | 2.0 | 1.0 | 862 | $1,125 | $1.31 | 23d | 1 | 1.17mi |
| 414 Wheeler Ave Apt B Anderson, IN | 1.0 | 1.0 | 600 | $650 | $1.08 | 43d | 1 | 1.20mi |
| 1045 Alhambra Dr Unit 6 Anderson, IN | 2.0 | 1.5 | 900 | $975 | $1.08 | 23d | 1 | 1.20mi |
| 1317 Main St Anderson, IN | 2.0 | 1.0 | 750 | $800 | $1.07 | 43d | 1 | 1.22mi |
| 2820 Fairview St Unit A Anderson, IN | 2.0 | 1.0 | 850 | $895 | $1.05 | 43d | 1 | 1.22mi |
| 223 E 11th St Anderson, IN | 2.0 | 1.0 | 800 | $900 | $1.12 | 43d | 1 | 1.27mi |
| 1829 E 8th St Anderson, IN | 1.0–3.0 | 1.0 | 810 | $1,025 | $1.27 | 23d | 9 | 1.28mi |
| 812 Mellen Dr Unit 814 Anderson, IN | 2.0 | 1.0 | 924 | $950 | $1.03 | 1d | 1 | 1.29mi |
| 4415 Columbus Ave Apt 15 Anderson, IN | 2.0 | 1.0 | 800 | $800 | $1.00 | 1d | 1 | 1.29mi |
| 917 E 8th St Unit 2 Anderson, IN | 2.0 | 1.0 | 550 | $825 | $1.50 | 7d | 1 | 1.31mi |
| 618 W 22nd St Anderson, IN | 3.0 | 1.0 | 900 | $1,250 | $1.39 | 43d | 1 | 1.33mi |
| 2301 Sheridan St Anderson, IN | 2.0 | 1.0 | 900 | $950 | $1.06 | 43d | 1 | 1.35mi |
| 4426 Mellen Ct Anderson, IN | 2.0 | 1.0 | 899 | $900 | $1.00 | 1d | 1 | 1.35mi |
| 702 W 23rd St Anderson, IN | 1.0 | 1.0 | 560 | $595 | $1.06 | 4d | 1 | 1.35mi |
| 2505 E 10th St Anderson, IN | 1.0–2.0 | 1.0 | 850 | $949 | $1.12 | 43d | 2 | 1.41mi |
| 4015 Haverhill Dr Anderson, IN | 3.0 | 2.0 | 884 | $1,100 | $1.24 | 43d | 1 | 1.44mi |
| 2411 Hendricks St Anderson, IN | 3.0 | 1.0 | 860 | $1,000 | $1.16 | 23d | 1 | 1.45mi |
| 919 E 6th St Apt 2 Anderson, IN | 1.0 | 1.0 | 700 | $625 | $0.89 | 23d | 1 | 1.45mi |
| 2208 Hendricks St Unit 3 Anderson, IN | 1.0 | 1.0 | 585 | $675 | $1.15 | 43d | 1 | 1.45mi |
Listing history 18 events
-
2026-06-18days on market $89,900 Active 30 DOM
-
2026-06-17days on market $89,900 Active 29 DOM
-
2026-06-16days on market $89,900 Active 28 DOM
-
2026-06-15days on market $89,900 Active 27 DOM
-
2026-06-13days on market $89,900 Active 25 DOM
-
2026-06-09days on market $89,900 Active 21 DOM
-
2026-06-08days on market $89,900 Active 20 DOM
-
2026-06-07days on market $89,900 Active 19 DOM
-
2026-06-05days on market $89,900 Active 16 DOM
-
2026-06-03days on market $89,900 Active 15 DOM
-
2026-06-02days on market $89,900 Active 14 DOM
-
2026-06-01days on market $89,900 Active 13 DOM
-
2026-06-01price $89,900 Active 12 DOM
-
2026-05-31days on market $99,900 Active 12 DOM
-
2026-05-18$99,900 Active
Show marketing remark (415 chars)
Come take a look at this cozy 2 bed, 1 bath home located on the SE side of Anderson! Residence is situated on a corner lot, has a covered front porch and a nice sized deck off the back of the residence. Inside you will find a large living rm/dining rm combo, kitchen, a jack and jill bath, laundry room on main and some original hardwood floors. Home sits on top of a partial basement and perfect for extra storage.
-
2026-05-18$99,900 Active 415-char remark
Show marketing remark (415 chars)
Come take a look at this cozy 2 bed, 1 bath home located on the SE side of Anderson! Residence is situated on a corner lot, has a covered front porch and a nice sized deck off the back of the residence. Inside you will find a large living rm/dining rm combo, kitchen, a jack and jill bath, laundry room on main and some original hardwood floors. Home sits on top of a partial basement and perfect for extra storage.
-
2007-10-24historical
-
2007-04-24$45,000
ⓘ Source: listings_history table (triggers on properties + properties_extension) + one-shot
backfill from property_details.listing_events for pre-trigger history.
Tax reassessment forecast IN · Partial reset (capped growth)
- Current annual tax
- $1,098 · $91/mo
- Projected year-2 tax
- $1,098 · $91/mo
- Expected delta
- $0/yr ($0/mo · 0.0%)
ⓘ Screening estimate from a state-policy table — verify with the county assessor before closing.
Climate risk First Street
- Flood 1/10 Low FEMA zone X (unshaded) · 0% chance over 30 yrs
- Wildfire 1/10 Low
- Heat 3/10 Moderate 7 d/yr ≥100°F today · 18 d/yr by 30 yrs out
- Wind 2/10 Low 0% chance of damaging wind over 30 yrs
- Air quality 3/10 Moderate 2 unhealthy d/yr today · 3 by 30 yrs out
Nearby sold comps map
Loading sold comps map…
Walkable amenities ~0.75 mi
Loading nearby amenities…
Taxation est. · year 1
- Rental income
- $11,023
- − Mortgage interest
- −$5,036
- − Property taxes
- −$1,098
- − Insurance
- −$450
- − Repairs & maintenance
- −$882
- − Management
- −$882
- − Depreciation
- −$2,615
- Taxable income
- $61
- Est. tax owed @ 24.0%
- −$15
- After-tax cash flow
- $1,489/yr
For passive investors: Depreciation is non-cash, so a rental often shows a tax loss while cash-flowing — sheltering income. Rental losses are passive: they offset passive income freely, and up to $25,000/yr can offset ordinary (W-2) income if you actively participate and your MAGI is under $100k (phasing out to $0 by $150k); unused losses carry forward. On sale, claimed depreciation is recaptured at up to 25%, and gains may owe capital-gains tax (a 1031 exchange can defer both). Figures are a year-1 estimate at your 24.0% rate — not tax advice; consult a CPA.
Schools (NCES district)
- District
- Anderson Community School Corporation
- NCES district ID
- 1800150
- Math proficiency
- 15% ▼ -14.00%
- Reading proficiency
- 23% ▼ -7.00%
- Median HH income
- $38,208
- Composite
- 15.93/100
- National rank
- #9250
- State rank
- #280 of 301 in IN
Livability — Anderson
- Score
- 60/100
- State rank
- #521
- US rank
- #18709
Category grades
Schools grade is shown separately in the Schools card above.
Census & demographics
- Census place
- Anderson, IN
- County
- Madison County · 69,445 people
- City population
- 57,762
- Metro
- Indianapolis-Carmel-Anderson, IN
- Population (ZIP)
- 17,834
- Household income
- $36,029
- Rent vs Own
- Severe rent burden
- 1193.0
Population outlook (Madison County) Hauer SSP2
- Today (2025)
- 125,800 people
- By 2030
- 122,640 · -2.5%
- By 2040
- 115,420 · -8.3%
- By 2050
- 108,148 · -14.0%
- By 2075
- 91,838 · -27.0%
- By 2100
- 75,670 · -39.8%
Race, ethnicity, and origin ACS 2023
- Neighborhood character
- Diverse neighborhood (Simpson 0.58)
- Race & ethnicity
- White 61% Black 18% Hispanic / Latino 13% Two or more races 11% Native American 1%
- Hispanic origin (detail)
- Mexican 10% Puerto Rican 1%
- Common ancestry
- Italian 2% Slovak 1% Iranian 1%
- Foreign-born
- 4% · Canada
- Languages at home
- 86% English-only · Spanish 12%
Political lean MEDSL · Madison
- 2024 margin
- Strong R (+26.9) · D 35.6% · R 62.5% · Other 1.9%
- 2008→2024 swing
- -33.5pp toward R · 2008: 6.5pp · 2024: -26.9pp
- All cycles
- 2024: R+26.9 2020: R+22.6 2016: R+25.7 2012: R+4.5 2008: D+6.5
Not yet ingested
- Civics
- —
Market trends
- HPI YoY
- ▼ -11.12%
- Current HPI
- 302.7437
- Rent YoY
- ▲ 7.88%
- Metro
- Indianapolis-Carmel-Anderson, IN
- State GDP YoY
- ▲ 2.90%
- F500 in state
- 18
Industry mix (Fortune 500 HQ in IN)
| Industry | F500 HQs | Revenue |
|---|---|---|
| Industrial Machinery | 2 | $37B |
|
||
| Healthcare | 1 | $177B |
|
||
| Pharmaceuticals | 1 | $45B |
|
||
| Metals / Steel | 1 | $18B |
|
||
| Agriculture | 1 | $17B |
|
||
| Packaging | 1 | $12B |
|
||
Price history
+122.0% since first listed4 events — show timeline
- 2026-05-18 Listed $99,900 IRMLS
- 2026-05-18 Listed $99,900 MIBOR as Distributed by MLS Grid
- 2007-10-24 Listing Removed — MIBOR as Distributed by MLS Grid
- 2007-04-24 Listed $45,000 MIBOR as Distributed by MLS Grid
Property tax history
+14.4%/yrLatest (2024): $1,098 · +8.8% YoY. Source: county tax records.
Cash-flow waterfall
monthlySold comps — $/sqft
last 12 mo · ≤1 miLoading sold comps…