 Triplex
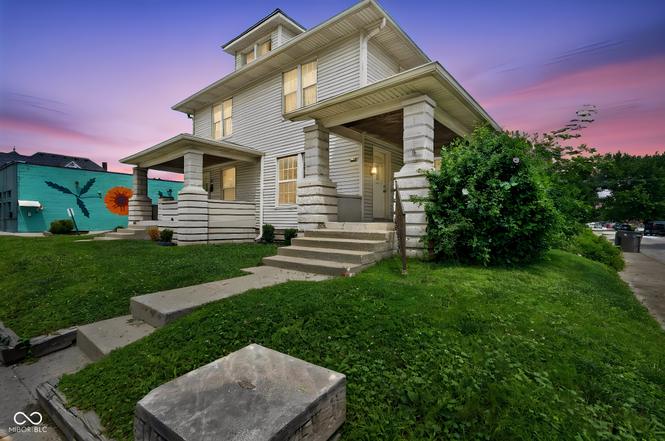
1920 E Washington St · Indianapolis city (balance), IN
Flood risk 1/10 · Minimal
- FEMA flood zone
- X (unshaded)
- Chance of flooding over 30 yrs
- 0.0%
- Est. flood insurance / yr
- $473 – $860
Fire risk 1/10 · Minimal
- Est. fire insurance / yr
- $717 – $1,331
Heat risk 4/10 · Minor
- Hot days now (above 101°F)
- 7 days/yr
- Hot days in 30 yrs
- 19 days/yr
Wind risk 2/10 · Minimal
- Chance of severe wind over 30 yrs
- 1.0%
Air-quality risk 4/10 · Minor
- Unhealthy air days now
- 5 days/yr
- Unhealthy air days in 30 yrs
- 7 days/yr
Risk factors via First Street. Map © Google.
Why this score? — see what drove the D+ grade
The composite is a weighted blend of 9 inputs, each scored 0–100. Each bar is that input's sub-score; the figure is the points it added to the 100-point composite (weight × sub-score).
- Cash flow +19.9/30.0
- DSCR +6.3/10.0
- ARV discount +5.7/15.0
- 1% rule +5.4/10.0
- Rent growth +4.3/5.0
- Livability +2.5/5.0
- Condition / age +2.5/5.0
- Schools +1.4/10.0
- Appreciation +0.0/10.0
$360,000
🖨 Deal sheet 📄 Offer letter ✓ Due diligence
Multi-family units
County records classify this as Multi-Family (2-4 Unit). Listing-text estimate: 3 units. confirmed
Listing remarks MLS
Investor's dream! A fantastic triplex located across from a park in an up-and-coming area. The roof has recently been replaced, eliminating that expense. The triplex consists of a 3-bedroom, 1.5-bath unit rented for $1400 per month, a studio unit at 1922 renting for $1175 per month, and an upstairs 1-bedroom, 1-bath unit at 10 Parkview renting for $1000 per month. The 1922 unit is currently rented on a month-to-month lease and has been occupied for the past 5 years. 1920 and 10 Parkview are currently vacant. Units were revamped in last few years and should only need cosmetic upgrades. The units still retain much of their original charm and offer the potential for custom upgrades by the new owner. The seller is willing to entertain all offers. Don't miss out on this opportunity!
Key facts
- Fresh paint
- New flooring
- Updated bathrooms
Tags
Property features AI
Finance
- Financial info: Gross income reported: 29,100; Reported expenses: 0; Three total rental units; Unit rents reported: approximately $1,500/month (3-bed), $925/month (1-bed), one unit rent not listed
Exterior
- Utilities: Solid waste service: No
- Home design: Residential income property; Triplex; Two levels
- Construction: Converted property
- Exterior features: Asphalt roof; Street access with street cuts
Interior
- Kitchen: 3-bedroom unit kitchen size approx. 350; 1-bedroom unit kitchen size approx. 150; Third unit kitchen size approx. 200
- Bedrooms: One 3-bedroom unit (2 levels); One 1-bedroom unit (1 level); One additional unit with central air (2 levels)
- Heating & cooling: Central air in multiple units; Forced heat in at least one unit
- Interior features: Basement present
- Laundry & utility: 3-bedroom unit utilities include central air, forced heat, electric hot water; 1-bedroom unit utilities include central air; Third unit utilities include central air
Neighborhood map
What this means for you Summary
Snapshot
- This is a 1×3bd/1.5ba + 1×1bd/1ba + 1×?bd/1ba units multifamily listed at $360k.
Deal economics
- At list price, monthly cash flow is $436 ($5k/yr) — positive. Per door: $145/mo.
- The deal already cash-flows at list — no discount required.
- Meets the 1% rule at list price ($4k rent vs $360k).
- Cap rate 7.7% vs local median 4.4% in Indianapolis city (balance) — top-decile yield for the area; either an underpriced asset or a hidden risk that comps aren't pricing in. Stress-test before assuming the spread holds.
Location & tenants
- Location reads: area grade D — affects rentability + tenant quality, not the cash-flow math above.
- Indianapolis Public Schools (urban): math 14% / reading 20% proficiency, ranked #286 of 301 in IN (top 95%) — low school quality limits family demand, transient renter base, plan for 1-2y turnover; 77% free/reduced lunch — lower-income household profile, screen leases tightly.
- Market conditions: Rents rising fast (+7.3%/yr); 480 active listings in the ZIP; 10 comparable units currently listed for rent nearby; rentals at typical pace (median 24d on market — plan ~3-4 weeks tenant-placement turnaround); 1,906 units permitted in Marion County in 2024 (621 in 5+ unit buildings).
- At $3,762/mo this rent would consume 92% of the median local household income ($49k/yr) (locally 1906% of renters already pay >50% of income on rent) — very limited rent-growth headroom before tenants either downsize or default.
Forward outlook
- Local home prices are declining (-3.0%/yr); year-one equity from $2k of loan paydown is wiped out by about $11k of value loss. Plan a longer hold.
- Marion County population projected at +18% by 2050 — long-run rental-demand tailwind backs the buy-and-hold thesis.
- At projected returns (-3.0% appreciation + 7.3% rent growth), your $101k cash investment doubles in ~10 years — after that, you're playing with house money.
Negotiation context
- Only 1 days on market — expect competitive offers; lowballing is unlikely to land.
- 11 sale attempts since 7y ago with the ask held roughly flat each time — persistent listings suggest the price (not the market) is what's stuck; bring a comps-based counter.
- Current owner paid $268k; 35% above their basis — modest negotiation headroom, anchor on the comps not their cost.
Risks & watch-outs
- Watch-outs: built in 1915 — expect roof / HVAC / electrical / plumbing capex.
Questions for the listing agent
- Can we see the unit-by-unit rent roll, current vacancy, and any below-market leases? What's the average tenancy length?
- What capital expenditures (roof, boiler, parking lot, exteriors) have been made in the last 5 years, and what's planned in the next 2?
- Built in 1915 — when were the roof, HVAC, electrical panel, plumbing, and water heater last replaced?
- Is there a deadline driving the sale (1031 exchange, divorce, estate, relocation)? That informs how much negotiation room exists.
- The area grade is low — what's the realistic commute time and amenity access for the typical tenant pool here? Any planned neighborhood developments (good or bad) we should know about?
- What's the average days-on-market for RENTAL listings here right now (not sales)? A rising rental-DOM trend means longer vacancies and softer asking-rent achievability than the comps imply.
- What's the recent tenant-quality profile in this submarket — average credit score on applications, eviction rate, late-payment / NSF rate, and stable-employment percentage? A property-management company in the area should have these aggregated.
- How much new apartment / multifamily construction is in the pipeline within 1–3 miles? Heavy new supply (>2% of stock underway) typically softens rents 12–24 months out; light construction supports rent growth.
Investment metrics
- 1% rule
- 1.04% ✓
- Cap rate
- 7.75%
- Cash-on-cash
- 5.19%
- DSCR
- 1.23
- GRM
- 8.0
CMA / ARV
- ARV (on-the-fly)
- $346,332
- Comps found
- 11
Show comp detail 11 sales within ~0.75 mi
| Address | Dist | Beds/Ba | Sqft | Sold | Price | $/sf | Match |
|---|---|---|---|---|---|---|---|
| 10 N Randolph St | 0.05mi | 6/2.0 (+1) | 2,600 (-0%) | 19mo | $250,000 | $96 | 61 |
| 2209 E New York St | 0.31mi | 4/4.0 (-1) | 2,640 (+1%) | 6mo | $290,000 | $110 | 58 |
| 618-620 N Hamilton Ave | 0.65mi | 4/2.0 (-1) | 2,600 (-0%) | 1mo | $270,000 | $104 | 48 |
| 339 N Walcott St | 0.28mi | 4/3.0 (-1) | 2,300 (-12%) | 0mo | $321,050 | $140 | 47 |
| 350 N Hamilton Ave | 0.35mi | 6/4.0 (+1) | 2,800 (+8%) | 10mo | $415,000 | $148 | 43 |
| 2028 Southeastern Ave | 0.34mi | 6/4.0 (+1) | 2,500 (-4%) | 19mo | $420,000 | $168 | 42 |
| 326 Jefferson Ave | 0.33mi | 6/3.0 (+1) | 2,442 (-6%) | 22mo | $230,000 | $94 | 36 |
| 510 Woodruff Place Middle Dr | 0.48mi | 6/2.0 (+1) | 2,560 (-2%) | 24mo | $445,000 | $174 | 35 |
| 456 N State Ave | 0.44mi | 6/2.0 (+1) | 2,784 (+7%) | 18mo | $369,000 | $133 | 33 |
| 434-6 N State Ave | 0.40mi | 4/4.0 (-1) | 2,408 (-8%) | 20mo | $395,000 | $164 | 32 |
| 2521 Southeastern Ave | 0.66mi | 4/2.0 (-1) | 2,240 (-14%) | 10mo | $121,000 | $54 | 17 |
Match score weights: distance 35% · size 25% · config 20% · recency 20%. Top-matched comps best support the ARV.
Projected returns pro-forma
-3.0% appreciation · 7.31% rent growth · sell at horizon
- IRR
- -3.4%
- Equity multiple
- 0.87×
- Total profit
- $-13,437
- Equity at exit
- $53,677
- IRR
- 10.7%
- Equity multiple
- 2.00×
- Total profit
- $100,787
- Equity at exit
- $31,126
Cash invested: $100,800 (down + closing). Projections, not guarantees.
Landlord ↔ Tenant lean methodology
- Overall (STATE)
- 90 Strongly Landlord-Friendly
- State Indiana
- 90 Strongly Landlord-Friendly · R+11
- County
- — inherits STATE
- City
- — inherits STATE
ZIP-level market 46201
- Home prices YoY
- -33.9%
- Rents YoY
- 7.3%
- Active inventory
- 480
- Price-to-rent
- 21.1×
Monthly cashflow live
- Estimated rent
- $3,762 high interval (Pro) →
- Mortgage (P&I)
- −$1,888
- Tax from tax record
- −$498 /mo · $5,973/yr
- Insurance
- −$150
- HOA
- −$0
- Vacancy / Maint / Mgmt
- −$790
- Net cashflow
- $436
Break-even live
3-unit breakdown (identical units grouped — click to expand)
| Units | Beds | Baths | Est. rent |
|---|---|---|---|
| 1× unit | 3 | 1.5 | $1,422 |
| 1× unit | 1 | 1 | $1,164 |
| 1× unit | 0 | 1 | $1,176 |
| Total (3 units) | $3,762 | ||
UW: 25.0% down · 7.5% · 30yr · 1.5% tax · 5.0% vac · 8.0% maint · 8.0% mgmt
Financing live
Cash to close
- Down payment
- $90,000
- Closing costs
- $10,800
- Reserves months
- —
- Total cash needed
- —
Loan-product check · same deal, 3 products live
Conventional
25% down · 7.5% · 30yr
- Down + closing
- —
- Monthly P&I
- —
- Monthly cashflow
- —
- DSCR
- —
- Eligible?
- —
Personal DTI + credit; lowest rate.
DSCR
20% down · 8.5% · 30yr
- Down + closing
- —
- Monthly P&I
- —
- Monthly cashflow
- —
- DSCR
- —
- Eligible?
- —
No personal income docs; deal must DSCR.
Hard money
10% down · 12.0% · 12mo
- Down + closing
- —
- Monthly P&I
- —
- Monthly cashflow
- —
- DSCR
- —
- Eligible?
- —
Short-term bridge; refi at stabilization.
Rent comps 10 comps
| Address | Beds | Baths | Sqft | Rent | $/sqft | DOM | Units | Dist |
|---|---|---|---|---|---|---|---|---|
| 29 N Walcott St Indianapolis, IN | 4.0 | 3.0 | 2200 | $2,400 | $1.09 | 43d | 1 | 0.13mi |
| 210 N Keystone Ave Indianapolis, IN | 4.0 | 2.0 | 2024 | $2,200 | $1.09 | 7d | 1 | 0.35mi |
| 1548 Lexington Ave Indianapolis, IN | 4.0 | 3.0 | 2224 | $2,250 | $1.01 | 3d | 1 | 0.84mi |
| 1135 Spann Ave Indianapolis, IN | 4.0 | 2.5 | 1836 | $2,495 | $1.36 | 17d | 1 | 0.87mi |
| 2201 Pleasant St Indianapolis, IN | 4.0 | 3.0 | 2063 | $2,495 | $1.21 | 4d | 1 | 0.91mi |
| 1140 Hoyt Ave Indianapolis, IN | 4.0 | 1.5 | 1831 | $1,895 | $1.03 | 43d | 1 | 0.94mi |
| 1027 Hosbrook St Indianapolis, IN | 4.0 | 3.5 | 3612 | $4,750 | $1.32 | 17d | 1 | 1.16mi |
| 1153 Villa Ave Indianapolis, IN | 4.0 | 2.0 | 2880 | $2,100 | $0.73 | 23d | 1 | 1.18mi |
| 931 N Lasalle St Indianapolis, IN | 4.0 | 2.5 | 2544 | $2,300 | $0.90 | 43d | 1 | 1.29mi |
| 1409 Linden St Unit 1028898P Indianapolis, IN | 5.0 | 6.0 | 2895 | $14,651 | $5.06 | 23d | 1 | 1.42mi |
Listing history 2 events
-
2026-06-19remarks 699-char remark
-
2026-06-19$360,000 Active 1 DOM
ⓘ Source: listings_history table (triggers on properties + properties_extension) + one-shot
backfill from property_details.listing_events for pre-trigger history.
Tax reassessment forecast IN · Partial reset (capped growth)
- Current annual tax
- $5,973 · $498/mo
- Projected year-2 tax
- $5,973 · $498/mo
- Expected delta
- $0/yr ($0/mo · 0.0%)
ⓘ Screening estimate from a state-policy table — verify with the county assessor before closing.
Climate risk First Street
- Flood 1/10 Low FEMA zone X (unshaded) · 0% chance over 30 yrs
- Wildfire 1/10 Low
- Heat 4/10 Moderate 7 d/yr ≥101°F today · 19 d/yr by 30 yrs out
- Wind 2/10 Low 100% chance of damaging wind over 30 yrs
- Air quality 4/10 Moderate 5 unhealthy d/yr today · 7 by 30 yrs out
Nearby sold comps map
Loading sold comps map…
Walkable amenities ~0.75 mi
Loading nearby amenities…
Taxation est. · year 1
- Rental income
- $45,144
- − Mortgage interest
- −$20,166
- − Property taxes
- −$5,973
- − Insurance
- −$1,800
- − Repairs & maintenance
- −$3,612
- − Management
- −$3,612
- − Depreciation
- −$10,473
- Taxable loss
- −$491
- Est. tax savings @ 24.0%
- +$118
- After-tax cash flow
- $5,354/yr
For passive investors: Depreciation is non-cash, so a rental often shows a tax loss while cash-flowing — sheltering income. Rental losses are passive: they offset passive income freely, and up to $25,000/yr can offset ordinary (W-2) income if you actively participate and your MAGI is under $100k (phasing out to $0 by $150k); unused losses carry forward. On sale, claimed depreciation is recaptured at up to 25%, and gains may owe capital-gains tax (a 1031 exchange can defer both). Figures are a year-1 estimate at your 24.0% rate — not tax advice; consult a CPA.
Schools (NCES district)
- District
- Indianapolis Public Schools
- NCES district ID
- 1804770
- Math proficiency
- 14% ▼ -7.00%
- Reading proficiency
- 20% ▼ -3.00%
- Median HH income
- $32,034
- Composite
- 13.69/100
- National rank
- #9499
- State rank
- #286 of 301 in IN
Livability — Indianapolis city (balance)
No livability data for this city. (Only ~50 U.S. cities are tracked.)
Census & demographics
- Census place
- Indianapolis city (balance), IN
- County
- Marion County · 998,460 people
- City population
- 881,119
- Metro
- Indianapolis-Carmel-Anderson, IN
- Population (ZIP)
- 30,335
- Household income
- $49,195
- Rent vs Own
- Severe rent burden
- 1906.0
Population outlook (Marion County) Hauer SSP2
- Today (2025)
- 1,025,572 people
- By 2030
- 1,065,727 · +3.9%
- By 2040
- 1,141,577 · +11.3%
- By 2050
- 1,208,920 · +17.9%
- By 2075
- 1,367,288 · +33.3%
- By 2100
- 1,438,201 · +40.2%
Race, ethnicity, and origin ACS 2023
- Neighborhood character
- Diverse neighborhood (Simpson 0.63)
- Race & ethnicity
- White 53% Hispanic / Latino 23% Black 18% Two or more races 9%
- Hispanic origin (detail)
- Mexican 14% Puerto Rican 2%
- Common ancestry
- Slovak 2% Lithuanian 2% Italian 1%
- Foreign-born
- 9% · Canada
- Languages at home
- 81% English-only · Spanish 17%
Political lean MEDSL · Marion
- 2024 margin
- Strong D (+27.7) · D 63.0% · R 35.3% · Other 1.7%
- 2008→2024 swing
- -0.7pp no change · 2008: 28.4pp · 2024: 27.7pp
- All cycles
- 2024: D+27.7 2020: D+29.1 2016: D+22.8 2012: D+22.2 2008: D+28.4
Not yet ingested
- Civics
- —
Market trends
- HPI YoY
- ▼ -192.51%
- Current HPI
- 375.0969
- Rent YoY
- ▲ 7.31%
- Metro
- Indianapolis-Carmel-Anderson, IN
- State GDP YoY
- ▲ 2.90%
- F500 in state
- 18
Industry mix (Fortune 500 HQ in IN)
| Industry | F500 HQs | Revenue |
|---|---|---|
| Industrial Machinery | 2 | $37B |
|
||
| Healthcare | 1 | $177B |
|
||
| Pharmaceuticals | 1 | $45B |
|
||
| Metals / Steel | 1 | $18B |
|
||
| Agriculture | 1 | $17B |
|
||
| Packaging | 1 | $12B |
|
||
Price history
+41.2% since first listed34 events — show timeline
- 2026-06-18 Listed $360,000 MIBOR as Distributed by MLS Grid
- 2025-03-14 Sold (MLS) $267,500 MIBOR as Distributed by MLS Grid
- 2025-01-06 Pending — MIBOR as Distributed by MLS Grid
- 2024-12-10 Price Changed $305,000 MIBOR as Distributed by MLS Grid
- 2024-12-08 Relisted — MIBOR as Distributed by MLS Grid
- 2024-11-05 Pending — MIBOR as Distributed by MLS Grid
- 2024-10-16 Price Changed $319,000 MIBOR as Distributed by MLS Grid
- 2024-10-04 Listed $329,000 MIBOR as Distributed by MLS Grid
- 2024-09-18 Rental Removed $1,375 BUILDIUM
- 2024-09-07 Price Changed $1,375 BUILDIUM
- 2024-08-28 Price Changed $1,425 BUILDIUM
- 2024-08-16 Listed for Rent $1,500 BUILDIUM
- 2022-11-12 Pending — MIBOR as Distributed by MLS Grid
- 2022-11-12 Listing Removed — MIBOR as Distributed by MLS Grid
- 2022-11-02 Listed $325,000 MIBOR as Distributed by MLS Grid
- 2020-06-12 Sold (MLS) $219,000 MIBOR as Distributed by MLS Grid
- 2020-06-12 Sold (MLS) $219,000 MIBOR as Distributed by MLS Grid
- 2020-06-03 Listing Removed — MIBOR as Distributed by MLS Grid
- 2020-06-02 Relisted — MIBOR as Distributed by MLS Grid
- 2020-05-01 Pending — MIBOR as Distributed by MLS Grid
- 2020-05-01 Pending — MIBOR as Distributed by MLS Grid
- 2020-05-01 Listing Removed — MIBOR as Distributed by MLS Grid
- 2020-04-30 Price Changed $239,000 MIBOR as Distributed by MLS Grid
- 2020-04-30 Price Changed $239,000 MIBOR as Distributed by MLS Grid
- 2020-03-26 Price Changed $245,000 MIBOR as Distributed by MLS Grid
- 2020-03-26 Price Changed $245,000 MIBOR as Distributed by MLS Grid
- 2020-02-28 Listed $1,100 MIBOR as Distributed by MLS Grid
- 2020-01-29 Listing Removed — MIBOR as Distributed by MLS Grid
- 2019-12-30 Listed $800 MIBOR as Distributed by MLS Grid
- 2019-10-19 Listed $255,000 MIBOR as Distributed by MLS Grid
- 2019-10-19 Relisted — MIBOR as Distributed by MLS Grid
- 2019-08-15 Pending — MIBOR as Distributed by MLS Grid
- 2019-08-14 Listing Removed — MIBOR as Distributed by MLS Grid
- 2019-07-16 Listed $255,000 MIBOR as Distributed by MLS Grid
Property tax history
+16.4%/yrLatest (2025): $5,973 · -11.0% YoY. Source: county tax records.
Cash-flow waterfall
monthlySold comps — $/sqft
last 12 mo · ≤1 miLoading sold comps…