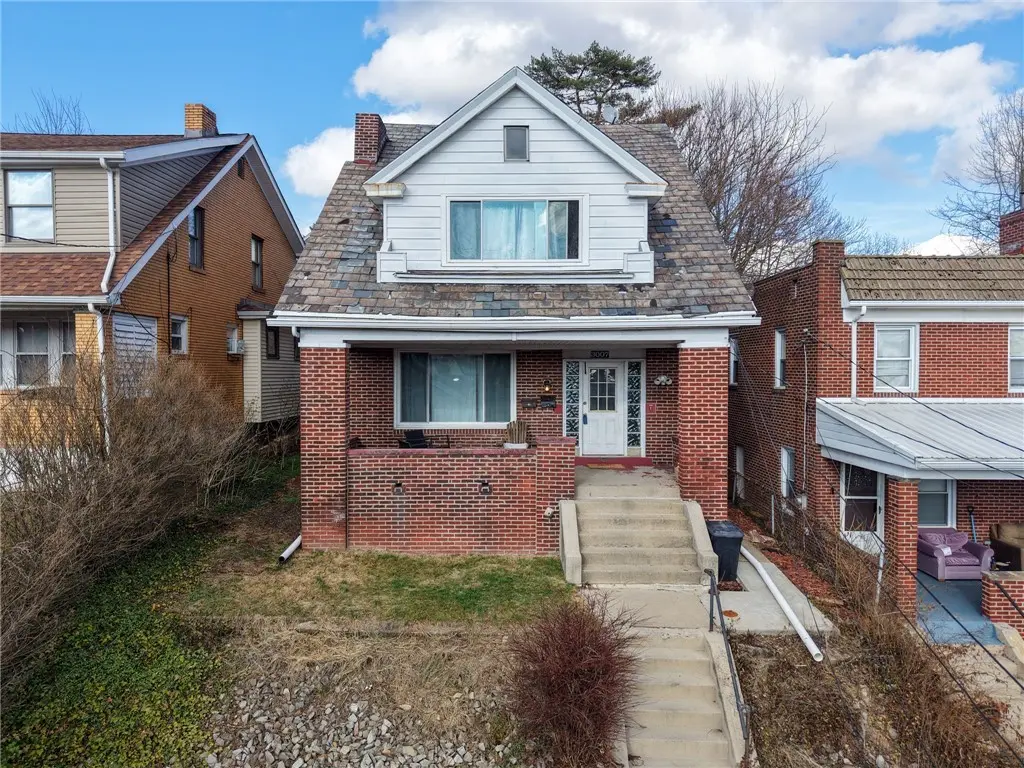
 Duplex
3007 Pyramid Ave · Brentwood, PA
Flood risk 1/10 · Minimal
- FEMA flood zone
- X (unshaded)
- Chance of flooding over 30 yrs
- 0.0%
- Est. flood insurance / yr
- $473 – $860
Fire risk 1/10 · Minimal
- Est. fire insurance / yr
- $511 – $949
Heat risk 3/10 · Minor
- Hot days now (above 96°F)
- 7 days/yr
- Hot days in 30 yrs
- 17 days/yr
Wind risk 2/10 · Minimal
- Chance of severe wind over 30 yrs
- —
Air-quality risk 3/10 · Minor
- Unhealthy air days now
- 3 days/yr
- Unhealthy air days in 30 yrs
- 5 days/yr
Risk factors via First Street. Map © Google.
Why this score? — see what drove the B grade
The composite is a weighted blend of 9 inputs, each scored 0–100. Each bar is that input's sub-score; the figure is the points it added to the 100-point composite (weight × sub-score).
- Cash flow +30.0/30.0
- 1% rule +10.0/10.0
- DSCR +10.0/10.0
- ARV discount +7.5/15.0
- Livability +4.0/5.0
- Rent growth +3.6/5.0
- Schools +3.4/10.0
- Condition / age +2.5/5.0
- Appreciation +0.0/10.0
$155,000
🖨 Deal sheet 📄 Offer letter ✓ Due diligence
Multi-family units
County records classify this as Multi-Family (2-4 Unit). Listing-text estimate: 2 units. confirmed
Listing remarks MLS
This well maintained up and down duplex in the heart of Brentwood is a real charmer. Live in one unit and rent out the other or easy to transition if you want to be a landlord. The seller has taken care of everything here for you!
Key facts
- Lower floor unit
- Many updates
- Upper floor unit
Tags
Property features AI
Finance
- Other:
- Financial info: Gross annual income: $21,960; Maintenance expense: $1,045; Utilities expense: $6,012; Insurance expense: $673; Unit rents: one unit at $1,050/month, one unit at $780/month
- HOA & community:
Exterior
- Parking: On-street parking
- Security:
- Utilities: Electricity available; Natural gas available; Public sewer available; Public water available
- Home design: Multi-unit property (2 units)
- Construction: Brick construction; Slate roof
- Exterior features: Residential zoning
Interior
- Kitchen:
- Bedrooms: One unit with 2 bedrooms; One unit with 1 bedroom
- Flooring:
- Bathrooms: Each unit has 1 full bathroom
- Heating & cooling:
- Interior features: Basement with storage space; Two total dwelling units
- Laundry & utility:
Neighborhood map
What this means for you Summary
Snapshot
- This is a 2 × 3-bed/2.0-bath units multifamily listed at $155k.
Deal economics
- At list price, monthly cash flow is $1k ($12k/yr) — positive. Per door: $520/mo.
- The deal already cash-flows at list — no discount required.
- Meets the 1% rule at list price ($3k rent vs $155k).
- Recommended offer: $146k (6.0% below list) — sets the bar for market timing.
- Cap rate 14.3% vs local median 4.3% in Brentwood — top-decile yield for the area; either an underpriced asset or a hidden risk that comps aren't pricing in. Stress-test before assuming the spread holds.
Location & tenants
- Location reads 81/100 on livability (#178 in PA, #1,479 nationally) — a professional / high-income tenant draw. Strengths: schools A+, cost of living A+, housing A+; Watch: amenities C-.
- Brentwood Borough SD (suburban): math 29% / reading 50% proficiency, ranked #357 of 539 in PA (top 66%) — families likely to look elsewhere, expect single-tenant / working-renter base with shorter leases.
- Market conditions: Rents rising fast (+4.3%/yr); 117 active listings in the ZIP; 14 comparable units currently listed for rent nearby; rentals at typical pace (median 15d on market — plan ~3-4 weeks tenant-placement turnaround); solid renter incomes; 2,996 units permitted in Allegheny County in 2024 (1,588 in 5+ unit buildings).
- At $2,859/mo this rent would consume 45% of the median local household income ($75k/yr) (locally 780% of renters already pay >50% of income on rent) — very limited rent-growth headroom before tenants either downsize or default.
Forward outlook
- Local home prices are declining (-3.0%/yr); year-one equity from $1k of loan paydown is wiped out by about $5k of value loss. Plan a longer hold.
- At projected returns (-3.0% appreciation + 4.3% rent growth), your $43k cash investment doubles in ~4 years — after that, you're playing with house money.
Negotiation context
- It's been on market 86 days — a 6% lower offer ($146k) is reasonable based on typical stale-listing flexibility.
- 9 sale attempts since 22y ago with the ask held roughly flat each time — persistent listings suggest the price (not the market) is what's stuck; bring a comps-based counter.
- Current owner paid $115k; 35% above their basis — modest negotiation headroom, anchor on the comps not their cost.
Risks & watch-outs
- Watch-outs: property tax is 2.6% of price; built in 1921 — expect roof / HVAC / electrical / plumbing capex.
Questions for the listing agent
- It's been on market 86 days. Have you received any prior offers? Is the seller open to a 6% concession, seller financing, or rate buy-down credit?
- Can we see the unit-by-unit rent roll, current vacancy, and any below-market leases? What's the average tenancy length?
- What capital expenditures (roof, boiler, parking lot, exteriors) have been made in the last 5 years, and what's planned in the next 2?
- Built in 1921 — when were the roof, HVAC, electrical panel, plumbing, and water heater last replaced?
- Property tax is high relative to price — has the assessment been appealed recently, and will the sale trigger a re-assessment?
- Why hasn't it sold? Are there any deal-killer items the seller is aware of (foundation, flood, title, zoning, code violations)?
- Is there a deadline driving the sale (1031 exchange, divorce, estate, relocation)? That informs how much negotiation room exists.
- Schools are A-rated — typically a magnet for longer-tenancy family renters. What's the average tenant stay here, and is there a school-zone premium baked into asking?
- What's the average days-on-market for RENTAL listings here right now (not sales)? A rising rental-DOM trend means longer vacancies and softer asking-rent achievability than the comps imply.
- What's the recent tenant-quality profile in this submarket — average credit score on applications, eviction rate, late-payment / NSF rate, and stable-employment percentage? A property-management company in the area should have these aggregated.
- How much new apartment / multifamily construction is in the pipeline within 1–3 miles? Heavy new supply (>2% of stock underway) typically softens rents 12–24 months out; light construction supports rent growth.
Investment metrics
- 1% rule
- 1.84% ✓
- Cap rate
- 14.34%
- Cash-on-cash
- 28.76%
- DSCR
- 2.28
- GRM
- 4.5
CMA / ARV
No comps found within radius.
Projected returns pro-forma
-3.0% appreciation · 4.33% rent growth · sell at horizon
- IRR
- 24.7%
- Equity multiple
- 2.04×
- Total profit
- $45,132
- Equity at exit
- $23,111
- IRR
- 33.4%
- Equity multiple
- 4.26×
- Total profit
- $141,481
- Equity at exit
- $13,402
Cash invested: $43,400 (down + closing). Projections, not guarantees.
Landlord ↔ Tenant lean methodology
- Overall (STATE)
- 62 Landlord-Friendly
- State Pennsylvania
- 62 Landlord-Friendly · EVEN
- County
- — inherits STATE
- City
- — inherits STATE
ZIP-level market 15227
- Home prices YoY
- -27.5%
- Rents YoY
- 4.3%
- Active inventory
- 117
- Price-to-rent
- 9.0×
Monthly cashflow live
- Estimated rent
- $2,859 medium interval (Pro) →
- Mortgage (P&I)
- −$813
- Tax from tax record
- −$341 /mo · $4,094/yr
- Insurance
- −$65
- HOA
- −$0
- Vacancy / Maint / Mgmt
- −$600
- Net cashflow
- $1,040
Break-even live
2-unit breakdown (identical units grouped — click to expand)
| Units | Beds | Baths | Est. rent |
|---|---|---|---|
| 2× units | 3 | 2 | $2,860 |
| #1 | 3 | 2 | $1,430 |
| #2 | 3 | 2 | $1,430 |
| Total (2 units) | $2,859 | ||
UW: 25.0% down · 7.5% · 30yr · 1.5% tax · 5.0% vac · 8.0% maint · 8.0% mgmt
Financing live
Cash to close
- Down payment
- $38,750
- Closing costs
- $4,650
- Reserves months
- —
- Total cash needed
- —
Loan-product check · same deal, 3 products live
Conventional
25% down · 7.5% · 30yr
- Down + closing
- —
- Monthly P&I
- —
- Monthly cashflow
- —
- DSCR
- —
- Eligible?
- —
Personal DTI + credit; lowest rate.
DSCR
20% down · 8.5% · 30yr
- Down + closing
- —
- Monthly P&I
- —
- Monthly cashflow
- —
- DSCR
- —
- Eligible?
- —
No personal income docs; deal must DSCR.
Hard money
10% down · 12.0% · 12mo
- Down + closing
- —
- Monthly P&I
- —
- Monthly cashflow
- —
- DSCR
- —
- Eligible?
- —
Short-term bridge; refi at stabilization.
Rent comps 14 comps
| Address | Beds | Baths | Sqft | Rent | $/sqft | DOM | Units | Dist |
|---|---|---|---|---|---|---|---|---|
| 2940 Brevard Ave Pittsburgh, PA | 3.0 | 1.5 | 1176 | $1,475 | $1.25 | 43d | 1 | 0.11mi |
| 2823 Clermont Ave Pittsburgh, PA | 3.0 | 1.0 | 1354 | $1,490 | $1.10 | 20d | 1 | 0.16mi |
| 2721 Pyramid Ave Pittsburgh, PA | 3.0 | 1.0 | 1560 | $1,550 | $0.99 | 7d | 1 | 0.20mi |
| 139 W Bellecrest Ave Brentwood, PA | 1.0–3.0 | 1.0 | 775 | $1,450 | $1.87 | 2d | 12 | 0.48mi |
| 3341 Recker Dr Pittsburgh, PA | 3.0 | 2.0 | 1174 | $1,750 | $1.49 | 23d | 1 | 0.57mi |
| 3341 Recker Dr Pittsburgh, PA | 3.0 | 2.0 | 875 | $1,790 | $2.05 | 43d | 1 | 0.57mi |
| 1053 Edward Dr Pittsburgh, PA | 3.0 | 1.0 | 1163 | $1,700 | $1.46 | 23d | 1 | 0.87mi |
| 453 Greenlee Rd Pittsburgh, PA | 3.0 | 1.0 | 1176 | $1,495 | $1.27 | 43d | 1 | 0.88mi |
| 3367 Jameson Dr Brentwood, PA | 2.0–3.0 | 1.0 | 975 | $1,435 | $1.47 | 7d | 7 | 0.91mi |
| 4588 E Willock Rd Pittsburgh, PA | 3.0 | 1.5 | 1500 | $1,500 | $1.00 | 4d | 1 | 1.14mi |
| 960 Agnew Rd Pittsburgh, PA | 3.0 | 2.0 | 950 | $1,295 | $1.36 | 14d | 1 | 1.15mi |
| 973 Agnew Rd Pittsburgh, PA | 4.0 | 3.0 | 1532 | $2,395 | $1.56 | 7d | 1 | 1.19mi |
| 1526 Parkline Dr Pittsburgh, PA | 3.0 | 1.0 | 942 | $1,475 | $1.56 | 7d | 44 | 1.24mi |
| 2355 Glenbury St Pittsburgh, PA | 4.0 | 2.0 | 1350 | $2,300 | $1.70 | 3d | 1 | 1.42mi |
Listing history 29 events
-
2026-06-02statusdays on market $155,000 Pending 86 DOM
-
2026-06-01days on market $155,000 Contingent 85 DOM
-
2026-05-31days on market $155,000 Contingent 84 DOM
-
2026-04-29historical Contingent
-
2026-03-19status Active
-
2026-03-10historical Contingent
-
2026-03-08$155,000 Active
-
2022-04-15soldstatus $115,000
-
2022-04-13soldstatus $115,000 Closed 230-char remark
Show marketing remark (230 chars)
This well maintained up and down duplex in the heart of Brentwood is a real charmer. Live in one unit and rent out the other or easy to transition if you want to be a landlord. The seller has taken care of everything here for you!
-
2022-03-04historical Contingent 230-char remark
Show marketing remark (230 chars)
This well maintained up and down duplex in the heart of Brentwood is a real charmer. Live in one unit and rent out the other or easy to transition if you want to be a landlord. The seller has taken care of everything here for you!
-
2022-01-26$119,900 Active 230-char remark
Show marketing remark (230 chars)
This well maintained up and down duplex in the heart of Brentwood is a real charmer. Live in one unit and rent out the other or easy to transition if you want to be a landlord. The seller has taken care of everything here for you!
-
2021-12-21historical Contingent 230-char remark
Show marketing remark (230 chars)
This well maintained up and down duplex in the heart of Brentwood is a real charmer. Live in one unit and rent out the other or easy to transition if you want to be a landlord. The seller has taken care of everything here for you!
-
2021-11-26status Active 230-char remark
Show marketing remark (230 chars)
This well maintained up and down duplex in the heart of Brentwood is a real charmer. Live in one unit and rent out the other or easy to transition if you want to be a landlord. The seller has taken care of everything here for you!
-
2021-11-13historical Contingent 230-char remark
Show marketing remark (230 chars)
This well maintained up and down duplex in the heart of Brentwood is a real charmer. Live in one unit and rent out the other or easy to transition if you want to be a landlord. The seller has taken care of everything here for you!
-
2021-11-05price $119,900 230-char remark
Show marketing remark (230 chars)
This well maintained up and down duplex in the heart of Brentwood is a real charmer. Live in one unit and rent out the other or easy to transition if you want to be a landlord. The seller has taken care of everything here for you!
-
2021-08-28price $124,900 230-char remark
Show marketing remark (230 chars)
This well maintained up and down duplex in the heart of Brentwood is a real charmer. Live in one unit and rent out the other or easy to transition if you want to be a landlord. The seller has taken care of everything here for you!
-
2021-07-09$129,900 Active 230-char remark
Show marketing remark (230 chars)
This well maintained up and down duplex in the heart of Brentwood is a real charmer. Live in one unit and rent out the other or easy to transition if you want to be a landlord. The seller has taken care of everything here for you!
-
2014-03-26soldstatus $55,000
-
2014-03-21price $55,000
-
2014-03-21price $56,900
-
2014-03-21soldstatus $55,000
-
2014-02-25historical
-
2013-02-25$56,900
-
2012-03-08$62,500
-
2011-03-05$67,500
-
2005-04-29soldstatus $69,900
-
2004-07-26$69,900
-
1987-12-10soldstatus $28,500
-
1977-12-08soldstatus $22,500
ⓘ Source: listings_history table (triggers on properties + properties_extension) + one-shot
backfill from property_details.listing_events for pre-trigger history.
Tax reassessment forecast PA · Partial reset (capped growth)
- Current annual tax
- $4,094 · $341/mo
- Projected year-2 tax
- $4,094 · $341/mo
- Expected delta
- $0/yr ($0/mo · 0.0%)
ⓘ Screening estimate from a state-policy table — verify with the county assessor before closing.
Climate risk First Street
- Flood 1/10 Low FEMA zone X (unshaded) · 0% chance over 30 yrs
- Wildfire 1/10 Low
- Heat 3/10 Moderate 7 d/yr ≥96°F today · 17 d/yr by 30 yrs out
- Wind 2/10 Low
- Air quality 3/10 Moderate 3 unhealthy d/yr today · 5 by 30 yrs out
Nearby sold comps map
Loading sold comps map…
Walkable amenities ~0.75 mi
Loading nearby amenities…
Taxation est. · year 1
- Rental income
- $34,308
- − Mortgage interest
- −$8,682
- − Property taxes
- −$4,094
- − Insurance
- −$775
- − Repairs & maintenance
- −$2,745
- − Management
- −$2,745
- − Depreciation
- −$4,509
- Taxable income
- $10,758
- Est. tax owed @ 24.0%
- −$2,582
- After-tax cash flow
- $9,898/yr
For passive investors: Depreciation is non-cash, so a rental often shows a tax loss while cash-flowing — sheltering income. Rental losses are passive: they offset passive income freely, and up to $25,000/yr can offset ordinary (W-2) income if you actively participate and your MAGI is under $100k (phasing out to $0 by $150k); unused losses carry forward. On sale, claimed depreciation is recaptured at up to 25%, and gains may owe capital-gains tax (a 1031 exchange can defer both). Figures are a year-1 estimate at your 24.0% rate — not tax advice; consult a CPA.
Schools (NCES district)
- District
- Brentwood Borough SD
- NCES district ID
- 4204140
- Math proficiency
- 29% ▼ -15.00%
- Reading proficiency
- 50% ▼ -15.00%
- Median HH income
- $49,260
- Composite
- 33.92/100
- National rank
- #5341
- State rank
- #357 of 539 in PA
Livability — Brentwood
- Score
- 81/100
- State rank
- #178
- US rank
- #1479
Category grades
Schools grade is shown separately in the Schools card above.
Census & demographics
- Census place
- Brentwood, PA
- County
- Allegheny County · 1,022,028 people
- City population
- 28,460
- Metro
- Pittsburgh, PA
- Population (ZIP)
- 28,460
- Household income
- $75,448
- Rent vs Own
- Severe rent burden
- 780.0
Population outlook (Allegheny County) Hauer SSP2
- Today (2025)
- 1,250,282 people
- By 2030
- 1,256,482 · +0.5%
- By 2040
- 1,256,318 · +0.5%
- By 2050
- 1,244,169 · -0.5%
- By 2075
- 1,197,693 · -4.2%
- By 2100
- 1,093,187 · -12.6%
Race, ethnicity, and origin ACS 2023
- Neighborhood character
- Predominantly White (80%)
- Race & ethnicity
- White 80% Black 7% Asian 6% Two or more races 5% Hispanic / Latino 1%
- Common ancestry
- Romanian 9% Scotch-Irish 2% Slovak 1%
- Foreign-born
- 9% · India, Canada, China
- Languages at home
- 89% English-only · Other Indo-European 6% Other Asian/Pacific 1% French/Haitian/Cajun 1%
Political lean MEDSL · Allegheny
- 2024 margin
- Strong D (+20.3) · D 59.7% · R 39.4%
- 2008→2024 swing
- +4.8pp toward D · 2008: 15.5pp · 2024: 20.3pp
- All cycles
- 2024: D+20.3 2020: D+20.4 2016: D+16.4 2012: D+14.4 2008: D+15.5
Not yet ingested
- Civics
- —
Market trends
- HPI YoY
- ▼ -92.53%
- Current HPI
- 243.6383
- Rent YoY
- ▲ 4.33%
- Metro
- Pittsburgh, PA
- State GDP YoY
- ▲ 1.68%
- F500 in state
- 34
Industry mix (Fortune 500 HQ in PA)
| Industry | F500 HQs | Revenue |
|---|---|---|
| Healthcare | 2 | $309B |
|
||
| Insurance | 2 | $27B |
|
||
| Telecommunications / Media | 1 | $124B |
|
||
| Industrial Distribution | 1 | $22B |
|
||
| Financial Services | 1 | $20B |
|
||
| Chemicals / Materials | 1 | $18B |
|
||
Price history
+588.9% since first listed26 events — show timeline
- 2026-04-29 Contingent — West Penn MLS
- 2026-03-19 Relisted — West Penn MLS
- 2026-03-10 Contingent — West Penn MLS
- 2026-03-08 Listed $155,000 West Penn MLS
- 2022-04-15 Sold (Public Records) $115,000 Public Records
- 2022-04-13 Sold (MLS) $115,000 West Penn MLS
- 2022-03-04 Contingent — West Penn MLS
- 2022-01-26 Listed $119,900 West Penn MLS
- 2021-12-21 Contingent — West Penn MLS
- 2021-11-26 Relisted — West Penn MLS
- 2021-11-13 Contingent — West Penn MLS
- 2021-11-05 Price Changed $119,900 West Penn MLS
- 2021-08-28 Price Changed $124,900 West Penn MLS
- 2021-07-09 Listed $129,900 West Penn MLS
- 2014-03-26 Sold (Public Records) $55,000 Public Records
- 2014-03-21 Price Changed $55,000 West Penn MLS
- 2014-03-21 Sold (MLS) $55,000 West Penn MLS
- 2014-03-21 Price Changed $56,900 West Penn MLS
- 2014-02-25 Delisted — West Penn MLS
- 2013-02-25 Listed $56,900 West Penn MLS
- 2012-03-08 Listed $62,500 West Penn MLS
- 2011-03-05 Listed $67,500 West Penn MLS
- 2005-04-29 Sold (MLS) $69,900 West Penn MLS
- 2004-07-26 Listed $69,900 West Penn MLS
- 1987-12-10 Sold (Public Records) $28,500 Public Records
- 1977-12-08 Sold (Public Records) $22,500 Public Records
Property tax history
+3.1%/yrLatest (2026): $4,094 · +4.6% YoY. Source: county tax records.
Cash-flow waterfall
monthlySold comps — $/sqft
last 12 mo · ≤1 miLoading sold comps…