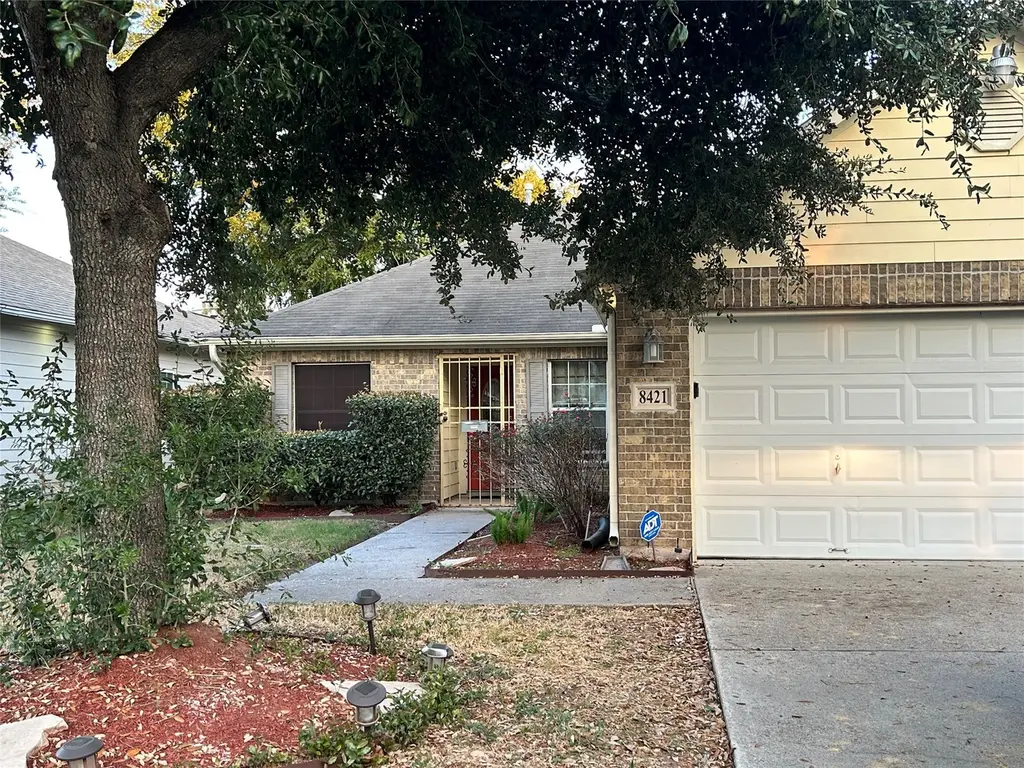
8421 Lawler St · Houston, TX
Flood risk 4/10 · Minor
- FEMA flood zone
- X (unshaded)
- Chance of flooding over 30 yrs
- 0.2%
- Est. flood insurance / yr
- $507 – $1,088
Fire risk 3/10 · Minor
- Est. fire insurance / yr
- $1,222 – $2,270
Heat risk 9/10 · Severe
- Hot days now (above 109°F)
- 6 days/yr
- Hot days in 30 yrs
- 21 days/yr
Wind risk 9/10 · Severe
- Chance of severe wind over 30 yrs
- 99.0%
Air-quality risk 2/10 · Minimal
- Unhealthy air days now
- 2 days/yr
- Unhealthy air days in 30 yrs
- 2 days/yr
Risk factors via First Street. Map © Google.
Why this score? — see what drove the C- grade
The composite is a weighted blend of 9 inputs, each scored 0–100. Each bar is that input's sub-score; the figure is the points it added to the 100-point composite (weight × sub-score).
- Cash flow +14.4/30.0
- Appreciation +10.0/10.0
- ARV discount +7.5/15.0
- 1% rule +4.5/10.0
- DSCR +4.4/10.0
- Rent growth +3.7/5.0
- Livability +3.7/5.0
- Schools +2.7/10.0
- Condition / age +2.5/5.0
$245,000
🖨 Deal sheet 📄 Offer letter ✓ Due diligence
Listing remarks MLS
Nestled in a charming neighborhood, this property boasts 3 bedrooms, 2 bathrooms, and a spacious backyard perfect for entertaining. The open-concept living area features a modern kitchen with stainless steel appliances. Enjoy the convenience of a two-car garage and easy access to nearby parks and schools. Don't miss out on the opportunity to make this house your home!
Key facts
- Spacious backyard
- Cozy fireplace
- Modern kitchen
Tags
Neighborhood map
What this means for you Summary
Snapshot
- This is a 3-bed/2.0-bath single-family listed at $245k.
Deal economics
- At list price, monthly cash flow is $49 ($588/yr) — positive.
- The deal already cash-flows at list — no discount required.
- To meet the 1% rule (rent ≥ 1% of price), the offer needs to be $234k (4.6% below list).
- Recommended offer: $216k (12.0% below list) — sets the bar for market timing.
- Cap rate 6.5% vs local median 3.2% in Houston — top-decile yield for the area; either an underpriced asset or a hidden risk that comps aren't pricing in. Stress-test before assuming the spread holds.
Location & tenants
- Location reads 74/100 on livability (#184 in TX, #4,771 nationally) — a middle-class / working-renter tenant base. Strengths: amenities A+, cost of living A+, housing A+; Watch: schools D, crime F.
- Houston ISD (urban): math 27% / reading 35% proficiency, ranked #593 of 826 in TX (top 72%) — families likely to look elsewhere, expect single-tenant / working-renter base with shorter leases; 71% free/reduced lunch — lower-income household profile, screen leases tightly.
- Market conditions: Rents rising fast (+4.8%/yr); 312 active listings in the ZIP; 40 comparable units currently listed for rent nearby; rentals at typical pace (median 24d on market — plan ~3-4 weeks tenant-placement turnaround); 42% of comp listings sitting > 30 days — soft ceiling on asking rent; lower-income renter base — watch delinquency; 29,883 units permitted in Harris County in 2024 (8,621 in 5+ unit buildings).
- At $2,337/mo this rent would consume 75% of the median local household income ($37k/yr) (locally 1446% of renters already pay >50% of income on rent) — very limited rent-growth headroom before tenants either downsize or default.
Forward outlook
- In year one you build about $26k of equity ($2k loan paydown + $24k appreciation (10.0% local appreciation)).
- Harris County population projected at +47% by 2050 — long-run rental-demand tailwind backs the buy-and-hold thesis.
- At projected returns (10.0% appreciation + 4.8% rent growth), your $69k cash investment doubles in ~3 years — after that, you're playing with house money.
- By year 2, paydown + projected appreciation supports a ~$42k cash-out refi (75% LTV) — recoverable capital for the next deal without selling this one.
Negotiation context
- It's been on market 164 days — a 12% lower offer ($216k) is reasonable based on typical stale-listing flexibility.
- 2 sale attempts since 17y ago; this cycle's ask is 97900% above the opening price — seller raised mid-cycle; expect resistance to lowballs.
Risks & watch-outs
- Climate carrying-cost: severe wind risk, 99% chance of damaging wind over 30y; extreme-heat days projected 6→21/yr by 2055 (HVAC capex compounding) — expect insurance premiums to compound above CPI over the hold.
Questions for the listing agent
- It's been on market 164 days. Have you received any prior offers? Is the seller open to a 12% concession, seller financing, or rate buy-down credit?
- Why hasn't it sold? Are there any deal-killer items the seller is aware of (foundation, flood, title, zoning, code violations)?
- Is there a deadline driving the sale (1031 exchange, divorce, estate, relocation)? That informs how much negotiation room exists.
- Schools are D-rated, which usually means shorter tenancies and higher turnover. Who's the typical renter profile here, and what's been the actual vacancy rate?
- Crime grade is F in this area — have there been break-ins, vandalism, or insurance claims at this property in the last 3 years? What carrier currently insures it and at what premium?
- What's the average days-on-market for RENTAL listings here right now (not sales)? A rising rental-DOM trend means longer vacancies and softer asking-rent achievability than the comps imply.
- What's the recent tenant-quality profile in this submarket — average credit score on applications, eviction rate, late-payment / NSF rate, and stable-employment percentage? A property-management company in the area should have these aggregated.
- How much new for-sale + rental construction is in the pipeline within 1–3 miles? Heavy new supply typically softens prices + rents 12–24 months out; constrained supply supports both.
Investment metrics
- 1% rule
- 0.95% ✗
- Cap rate
- 6.53%
- Cash-on-cash
- 0.86%
- DSCR
- 1.04
- GRM
- 8.7
CMA / ARV
- ARV (median comp)
- $245,266
- List price
- $245,000
- Delta
- -0.11%
- Verdict
- FAIR
- Comps
- 20 within 1.0 mi
Show comp detail 12 sales within ~0.75 mi
| Address | Dist | Beds/Ba | Sqft | Sold | Price | $/sf | Match |
|---|---|---|---|---|---|---|---|
| 8110 Parnell St | 0.33mi | 3/2.0 | 1,512 (-3%) | 12mo | $205,000 | $136 | 69 |
| 8017 Comal St | 0.37mi | 4/2.0 (+1) | 1,536 (-2%) | 9mo | $170,000 | $111 | 67 |
| 8324 Grandview St | 0.15mi | 3/2.0 | 1,416 (-9%) | 13mo | $244,900 | $173 | 66 |
| 8436 Lawler St | 0.04mi | 3/2.0 | 1,334 (-14%) | 9mo | $177,900 | $133 | 66 |
| 8230 Woodward St | 0.16mi | 3/2.0 | 1,347 (-14%) | 10mo | $155,000 | $115 | 61 |
| 3928 Mckinley St | 0.38mi | 3/2.5 | 1,478 (-5%) | 13mo | $235,000 | $159 | 61 |
| 8002 Colonial Ln | 0.44mi | 3/2.0 | 1,447 (-7%) | 9mo | $235,000 | $162 | 60 |
| 4215 Sterling St | 0.45mi | 4/2.5 (+1) | 1,645 (+5%) | 10mo | $228,000 | $139 | 54 |
| 9007 Comal St | 0.59mi | 3/2.5 | 1,703 (+9%) | 4mo | $289,000 | $170 | 52 |
| 9009 Comal St | 0.60mi | 3/2.5 | 1,717 (+10%) | 11mo | $299,900 | $175 | 44 |
| 4403 Aledo St | 0.67mi | 3/2.5 | 1,751 (+12%) | 8mo | $299,950 | $171 | 39 |
| 8607 Edgar St | 0.66mi | 3/2.5 | 1,751 (+12%) | 9mo | $289,950 | $166 | 39 |
Match score weights: distance 35% · size 25% · config 20% · recency 20%. Top-matched comps best support the ARV.
Projected returns pro-forma
10.0% appreciation · 4.77% rent growth · sell at horizon
- IRR
- 25.6%
- Equity multiple
- 3.05×
- Total profit
- $140,889
- Equity at exit
- $220,715
- IRR
- 23.0%
- Equity multiple
- 7.15×
- Total profit
- $421,876
- Equity at exit
- $475,981
Cash invested: $68,600 (down + closing). Projections, not guarantees.
Landlord ↔ Tenant lean methodology
- Overall (STATE)
- 87 Strongly Landlord-Friendly
- State Texas
- 87 Strongly Landlord-Friendly · R+5
- County
- — inherits STATE
- City
- — inherits STATE
ZIP-level market 77051
- Home prices YoY
- 9.7%
- Rents YoY
- 4.8%
- Active inventory
- 312
- Price-to-rent
- 8.7×
Monthly cashflow live
- Estimated rent
- $2,337 high interval (Pro) →
- Mortgage (P&I)
- −$1,285
- Tax from tax record
- −$411 /mo · $4,927/yr
- Insurance
- −$102
- HOA
- −$0
- Vacancy / Maint / Mgmt
- −$491
- Net cashflow
- $49
Break-even live
UW: 25.0% down · 7.5% · 30yr · 1.5% tax · 5.0% vac · 8.0% maint · 8.0% mgmt
Financing live
Cash to close
- Down payment
- $61,250
- Closing costs
- $7,350
- Reserves months
- —
- Total cash needed
- —
Loan-product check · same deal, 3 products live
Conventional
25% down · 7.5% · 30yr
- Down + closing
- —
- Monthly P&I
- —
- Monthly cashflow
- —
- DSCR
- —
- Eligible?
- —
Personal DTI + credit; lowest rate.
DSCR
20% down · 8.5% · 30yr
- Down + closing
- —
- Monthly P&I
- —
- Monthly cashflow
- —
- DSCR
- —
- Eligible?
- —
No personal income docs; deal must DSCR.
Hard money
10% down · 12.0% · 12mo
- Down + closing
- —
- Monthly P&I
- —
- Monthly cashflow
- —
- DSCR
- —
- Eligible?
- —
Short-term bridge; refi at stabilization.
Rent comps 40 comps
| Address | Beds | Baths | Sqft | Rent | $/sqft | DOM | Units | Dist |
|---|---|---|---|---|---|---|---|---|
| 8328 Corinth St Unit B Houston, TX | 3.0 | 2.5 | 1500 | $2,800 | $1.87 | 20d | 1 | 0.12mi |
| 3620 Du Bois St Unit 1302349P Houston, TX | 3.0 | 2.5 | 1797 | $2,945 | $1.64 | 2d | 1 | 0.22mi |
| 8010 Livingston St Houston, TX | 3.0 | 2.0 | 1400 | $1,800 | $1.29 | 43d | 1 | 0.36mi |
| 4117 Shelby Cir Unit 1230900P Houston, TX | 4.0 | 2.0 | 1367 | $5,355 | $3.92 | 1d | 1 | 0.41mi |
| 3137 W Bellfort Ave Houston, TX | 2.0 | 2.0 | 1164 | $1,802 | $1.55 | 43d | 1 | 0.54mi |
| 7806 Comal St Unit B Houston, TX | 3.0 | 2.5 | 1800 | $2,200 | $1.22 | 43d | 1 | 0.56mi |
| 4406 Sterling St Houston, TX | 3.0 | 2.5 | 1840 | $1,999 | $1.09 | 16d | 1 | 0.68mi |
| 2889 Reed Rd Houston, TX | 1.0–2.0 | 1.0–2.0 | 997 | $1,648 | $1.65 | 2d | 2 | 0.83mi |
| 4514 Galesburg St Unit B Houston, TX | 3.0 | 2.5 | 1680 | $3,500 | $2.08 | 24d | 1 | 0.86mi |
| 4526 Knoxville St Unit A Houston, TX | 3.0 | 2.5 | 1474 | $1,775 | $1.20 | 14d | 1 | 0.91mi |
| 4601 White Rock St Unit A Houston, TX | 3.0 | 2.5 | 1700 | $2,500 | $1.47 | 43d | 1 | 0.95mi |
| 2725 Reed Rd Houston, TX | 1.0–3.0 | 1.0–2.5 | 911 | $975 | $1.07 | 43d | 1 | 0.98mi |
| 4609 Bricker St Unit B Houston, TX | 3.0 | 2.5 | 1300 | $3,500 | $2.69 | 12d | 1 | 1.00mi |
| 4609 Bricker St Unit ABC Houston, TX | 3.0 | 2.5 | 1375 | $3,500 | $2.55 | 11d | 1 | 1.00mi |
| 4609 Bricker St Unit C Houston, TX | 2.0 | 1.5 | 1100 | $3,200 | $2.91 | 12d | 1 | 1.00mi |
| 4613 Bricker St Unit B Houston, TX | 3.0 | 2.5 | 1600 | $2,300 | $1.44 | 43d | 1 | 1.02mi |
| 4530 Mayflower St Houston, TX | 3.0 | 2.0 | 1302 | $1,800 | $1.38 | 43d | 1 | 1.05mi |
| 2910 Reed Rd Houston, TX | 1.0–3.0 | 1.0–2.0 | 967 | $1,280 | $1.32 | 1d | 5 | 1.05mi |
| 4538 Clover St Houston, TX | 4.0 | 2.0 | 1768 | $1,595 | $0.90 | 43d | 1 | 1.08mi |
| 3846 Seabrook St Houston, TX | 3.0 | 3.5 | 1833 | $2,300 | $1.25 | 43d | 1 | 1.08mi |
| 3732 Seabrook St Houston, TX | 3.0 | 2.5 | 1727 | $2,350 | $1.36 | 24d | 1 | 1.08mi |
| 3710 Rockingham St Houston, TX | 3.0 | 2.0 | 1890 | $1,700 | $0.90 | 43d | 1 | 1.09mi |
| 8181 El Mundo St Houston, TX | 1.0–3.0 | 1.0–2.0 | 1241 | $2,041 | $1.64 | 24d | 18 | 1.09mi |
| 8181 El Mundo St Houston, TX | 1.0–3.0 | 1.0–2.5 | 1356 | $2,262 | $1.67 | 1d | 47 | 1.09mi |
| 8107 Calhoun Rd Houston, TX | 3.0 | 2.5 | 1304 | $2,250 | $1.73 | 24d | 1 | 1.10mi |
| 3655 Seabrook St Unit 6 Houston, TX | 2.0 | 1.0 | 1600 | $1,000 | $0.62 | 43d | 1 | 1.12mi |
| 7507 Springhill St Houston, TX | 3.0 | 3.5 | 2000 | $4,500 | $2.25 | 43d | 1 | 1.12mi |
| 4835 Sunflower St Unit 1546466P Houston, TX | 3.0 | 2.0 | 1883 | $4,516 | $2.40 | 14d | 1 | 1.14mi |
| 7321 Conley St Unit A Houston, TX | 3.0 | 2.5 | 1869 | $2,025 | $1.08 | 20d | 1 | 1.15mi |
| 7321 Conley St Unit B Houston, TX | 3.0 | 2.0 | 1501 | $2,025 | $1.35 | 20d | 1 | 1.15mi |
| 8383 El Mundo St Unit 2165 Houston, TX | 2.0 | 2.0 | 1104 | $1,521 | $1.38 | 2d | 1 | 1.17mi |
| 8383 El Mundo St Unit 422 Houston, TX | 2.0 | 2.0 | 1104 | $1,529 | $1.38 | 7d | 1 | 1.17mi |
| 8383 El Mundo St Unit 2174 Houston, TX | 2.0 | 2.0 | 1104 | $1,553 | $1.41 | 10d | 1 | 1.17mi |
| 8383 El Mundo St Unit 8440 Houston, TX | 2.0 | 2.0 | 1104 | $1,558 | $1.41 | 43d | 1 | 1.17mi |
| 3088 Holly Hall St Unit 1 Houston, TX | 2.0 | 2.5 | 1600 | $1,750 | $1.09 | 14d | 1 | 1.20mi |
| 9610 Buffum St Houston, TX | 3.0 | 3.0 | 1605 | $1,799 | $1.12 | 43d | 1 | 1.20mi |
| 2968 Holly Hall St Houston, TX | 2.0 | 3.0 | 1600 | $2,000 | $1.25 | 43d | 1 | 1.20mi |
| 2924 Holly Hall St Houston, TX | 2.0 | 3.0 | 1600 | $1,950 | $1.22 | 43d | 1 | 1.24mi |
| 9606 Ashville Dr Unit B Houston, TX | 3.0 | 2.0 | 1610 | $1,570 | $0.98 | 43d | 1 | 1.25mi |
| 2700 Holly Hall St Unit 2737 Houston, TX | 2.0 | 2.0 | 1720 | $1,724 | $1.00 | 2d | 1 | 1.30mi |
Listing history 8 events
-
2026-04-21price $245,000 370-char remark
Show marketing remark (370 chars)
Nestled in a charming neighborhood, this property boasts 3 bedrooms, 2 bathrooms, and a spacious backyard perfect for entertaining. The open-concept living area features a modern kitchen with stainless steel appliances. Enjoy the convenience of a two-car garage and easy access to nearby parks and schools. Don't miss out on the opportunity to make this house your home!
-
2025-12-17price $250,000 370-char remark
Show marketing remark (370 chars)
Nestled in a charming neighborhood, this property boasts 3 bedrooms, 2 bathrooms, and a spacious backyard perfect for entertaining. The open-concept living area features a modern kitchen with stainless steel appliances. Enjoy the convenience of a two-car garage and easy access to nearby parks and schools. Don't miss out on the opportunity to make this house your home!
-
2025-12-17$250 Active 370-char remark
Show marketing remark (370 chars)
Nestled in a charming neighborhood, this property boasts 3 bedrooms, 2 bathrooms, and a spacious backyard perfect for entertaining. The open-concept living area features a modern kitchen with stainless steel appliances. Enjoy the convenience of a two-car garage and easy access to nearby parks and schools. Don't miss out on the opportunity to make this house your home!
-
2010-12-10soldstatus 196-char remark
Show marketing remark (196 chars)
UPGRADED PAINT! 9 FOOT CEILINGS IN MASTER AND FAMILY ROOM. CEILING FANS IN MASTER AND FAMILY ROOM. VINYL WOOD FLOORING, CERAMIC TILE, MASTER HAS A TUB WITH A SEPERATE SHOWER. THIS HOME HAS IT ALL!
-
2010-10-29historical 196-char remark
Show marketing remark (196 chars)
UPGRADED PAINT! 9 FOOT CEILINGS IN MASTER AND FAMILY ROOM. CEILING FANS IN MASTER AND FAMILY ROOM. VINYL WOOD FLOORING, CERAMIC TILE, MASTER HAS A TUB WITH A SEPERATE SHOWER. THIS HOME HAS IT ALL!
-
2009-12-01$120,000 196-char remark
Show marketing remark (196 chars)
UPGRADED PAINT! 9 FOOT CEILINGS IN MASTER AND FAMILY ROOM. CEILING FANS IN MASTER AND FAMILY ROOM. VINYL WOOD FLOORING, CERAMIC TILE, MASTER HAS A TUB WITH A SEPERATE SHOWER. THIS HOME HAS IT ALL!
-
2007-03-13soldstatus
-
1999-11-01soldstatus
ⓘ Source: listings_history table (triggers on properties + properties_extension) + one-shot
backfill from property_details.listing_events for pre-trigger history.
Tax reassessment forecast TX · Resets to sale price
- Current annual tax
- $4,927 · $411/mo
- Projected year-2 tax
- $4,927 · $411/mo
- Expected delta
- $0/yr ($0/mo · 0.0%)
ⓘ Screening estimate from a state-policy table — verify with the county assessor before closing.
Climate risk First Street
- Flood 4/10 Moderate FEMA zone X (unshaded) · 20% chance over 30 yrs
- Wildfire 3/10 Moderate
- Heat 9/10 Extreme 6 d/yr ≥109°F today · 21 d/yr by 30 yrs out
- Wind 9/10 Extreme 99% chance of damaging wind over 30 yrs
- Air quality 2/10 Low 2 unhealthy d/yr today · 2 by 30 yrs out
Nearby sold comps map
Loading sold comps map…
Walkable amenities ~0.75 mi
Loading nearby amenities…
Taxation est. · year 1
- Rental income
- $28,048
- − Mortgage interest
- −$13,724
- − Property taxes
- −$4,927
- − Insurance
- −$1,225
- − Repairs & maintenance
- −$2,244
- − Management
- −$2,244
- − Depreciation
- −$7,127
- Taxable loss
- −$3,443
- Est. tax savings @ 24.0%
- +$826
- After-tax cash flow
- $1,414/yr
For passive investors: Depreciation is non-cash, so a rental often shows a tax loss while cash-flowing — sheltering income. Rental losses are passive: they offset passive income freely, and up to $25,000/yr can offset ordinary (W-2) income if you actively participate and your MAGI is under $100k (phasing out to $0 by $150k); unused losses carry forward. On sale, claimed depreciation is recaptured at up to 25%, and gains may owe capital-gains tax (a 1031 exchange can defer both). Figures are a year-1 estimate at your 24.0% rate — not tax advice; consult a CPA.
Schools (NCES district)
- District
- Houston ISD
- NCES district ID
- 4823640
- Math proficiency
- 27% ▼ -18.00%
- Reading proficiency
- 35% ▼ -6.00%
- Median HH income
- $46,054
- Composite
- 26.63/100
- National rank
- #7173
- State rank
- #593 of 826 in TX
Livability — Houston
- Score
- 74/100
- State rank
- #184
- US rank
- #4771
Category grades
Schools grade is shown separately in the Schools card above.
Census & demographics
- Census place
- Houston, TX
- County
- Harris County · 4,702,590 people
- City population
- 3,226,434
- Metro
- Houston-The Woodlands-Sugar Land, TX
- Population (ZIP)
- 19,795
- Household income
- $37,415
- Rent vs Own
- Severe rent burden
- 1446.0
Population outlook (Harris County) Hauer SSP2
- Today (2025)
- 5,571,493 people
- By 2030
- 6,089,821 · +9.3%
- By 2040
- 7,142,806 · +28.2%
- By 2050
- 8,185,864 · +46.9%
- By 2075
- 10,574,329 · +89.8%
- By 2100
- 12,109,958 · +117.4%
Race, ethnicity, and origin ACS 2023
- Neighborhood character
- Predominantly Black (77%)
- Race & ethnicity
- Black 77% Hispanic / Latino 16% Two or more races 11% White 3%
- Hispanic origin (detail)
- Mexican 6% Puerto Rican 1%
- Foreign-born
- 8% · Canada, China
- Languages at home
- 88% English-only · Spanish 10%
Political lean MEDSL · Harris
- 2024 margin
- Lean D (+5.5) · D 52.0% · R 46.4% · Other 1.6%
- 2008→2024 swing
- +3.9pp toward D · 2008: 1.6pp · 2024: 5.5pp
- All cycles
- 2024: D+5.5 2020: D+13.3 2016: D+12.4 2012: D+0.1 2008: D+1.6
Not yet ingested
- Civics
- —
Market trends
- HPI YoY
- ▲ 16.02%
- Current HPI
- 180.4283
- Rent YoY
- ▲ 4.77%
- Metro
- Houston-The Woodlands-Sugar Land, TX
- State GDP YoY
- ▲ 3.95%
- F500 in state
- 110
Industry mix (Fortune 500 HQ in TX)
| Industry | F500 HQs | Revenue |
|---|---|---|
| Energy | 16 | $1,198B |
|
||
| Technology | 5 | $198B |
|
||
| Engineering / Construction | 4 | $72B |
|
||
| Energy Services | 3 | $60B |
|
||
| Utilities | 3 | $41B |
|
||
| Healthcare | 2 | $330B |
|
||
Price history
+104.2% since first listed8 events — show timeline
- 2026-04-21 Price Changed $245,000 HARMLS
- 2025-12-17 Price Changed $250,000 HARMLS
- 2025-12-17 Listed $250 HARMLS
- 2010-12-10 Sold (MLS) — HARMLS
- 2010-10-29 Listing Removed — HARMLS
- 2009-12-01 Listed $120,000 HARMLS
- 2007-03-13 Sold (Public Records) — Public Records
- 1999-11-01 Sold (Public Records) — Public Records
Property tax history
+22.1%/yrLatest (2025): $4,927 · -1.5% YoY. Source: county tax records.
Cash-flow waterfall
monthlySold comps — $/sqft
last 12 mo · ≤1 miLoading sold comps…