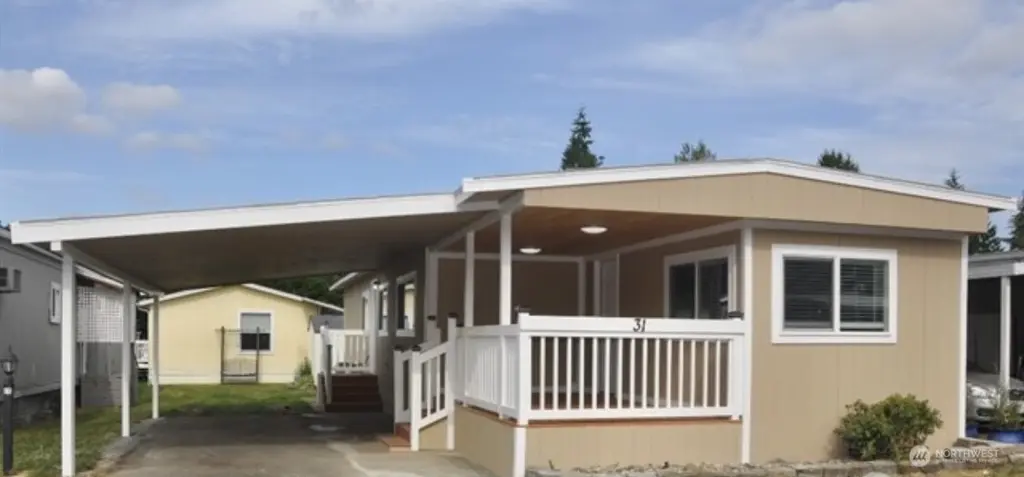
18501 52nd Ave W #31 · Lynnwood, WA
Flood risk No data
- FEMA flood zone
- —
- Chance of flooding over 30 yrs
- —
- Est. flood insurance / yr
- —
Fire risk No data
- Est. fire insurance / yr
- —
Heat risk No data
- Hot days now (above threshold)
- —
- Hot days in 30 yrs
- —
Wind risk No data
- Chance of severe wind over 30 yrs
- —
Air-quality risk No data
- Unhealthy air days now
- —
- Unhealthy air days in 30 yrs
- —
Risk factors via First Street. Map © Google.
Why this score? — see what drove the C+ grade
The composite is a weighted blend of 9 inputs, each scored 0–100. Each bar is that input's sub-score; the figure is the points it added to the 100-point composite (weight × sub-score).
- Cash flow +30.0/30.0
- 1% rule +10.0/10.0
- DSCR +10.0/10.0
- Schools +5.4/10.0
- Livability +3.9/5.0
- Rent growth +2.8/5.0
- Condition / age +2.5/5.0
- ARV discount +0.0/15.0
- Appreciation +0.0/10.0
$129,900
🖨 Deal sheet 📄 Offer letter ✓ Due diligence
Listing remarks
Welcome home to this beautifully remodeled gem in a peaceful 55+ community! This charming 2-bedroom, 1.5-bath home offers an open and airy layout filled with natural light. You'll love the gorgeous kitchen, complete with brand-new stainless-steel appliances with 5-year warranty—perfect for everyday cooking and gathering with loved ones. The spacious primary suite features its own walk-in closet for added comfort. There's also a cozy, versatile area that can be your reading nook, craft space, home office, or anything your heart desires. Plus, enjoy the convenience of covered 2-car parking with a carport. This home is ready to fit your lifestyle—come and imagine the possibilities.
Key facts
- Remodeled gem
- Walk-in closet
- Gorgeous kitchen
Tags
Neighborhood map
What this means for you Summary
Snapshot
- This is a 2-bed/1.0-bath manufactured listed at $130k.
Deal economics
- At list price, monthly cash flow is $800 ($10k/yr) — positive.
- The deal already cash-flows at list — no discount required.
- Meets the 1% rule at list price ($2k rent vs $130k).
- Recommended offer: $114k (12.0% below list) — sets the bar for market timing.
- Cap rate 13.7% vs local median 2.2% in Lynnwood — top-decile yield for the area; either an underpriced asset or a hidden risk that comps aren't pricing in. Stress-test before assuming the spread holds.
Location & tenants
- Location reads 77/100 on livability (#150 in WA, #3,226 nationally) — a middle-class / working-renter tenant base. Strengths: commute A+, health & safety A+, employment A; Watch: crime F, cost of living F.
- Edmonds School District (suburban): math 54% / reading 65% proficiency, ranked #53 of 291 in WA (top 18%) — acceptable for families but not a draw, mixed tenant base, ~2y average lease.
- Market conditions: Rents rising (+1.4%/yr); 173 active listings in the ZIP; 40 comparable units currently listed for rent nearby; rentals leasing fast (median 5d on market — plan ~1-2 weeks tenant-placement turnaround); solid renter incomes; 3,982 units permitted in Snohomish County in 2024 (1,492 in 5+ unit buildings).
Forward outlook
- Local home prices are declining (-3.0%/yr); year-one equity from $898 of loan paydown is wiped out by about $4k of value loss. Plan a longer hold.
- Snohomish County population projected at +30% by 2050 — long-run rental-demand tailwind backs the buy-and-hold thesis.
- At projected returns (-3.0% appreciation + 1.4% rent growth), your $36k cash investment doubles in ~5 years — after that, you're playing with house money.
Negotiation context
- It's been on market 192 days — a 12% lower offer ($114k) is reasonable based on typical stale-listing flexibility.
Questions for the listing agent
- It's been on market 192 days. Have you received any prior offers? Is the seller open to a 12% concession, seller financing, or rate buy-down credit?
- Built in 1966 — when were the roof, HVAC, electrical panel, plumbing, and water heater last replaced?
- Why hasn't it sold? Are there any deal-killer items the seller is aware of (foundation, flood, title, zoning, code violations)?
- Is there a deadline driving the sale (1031 exchange, divorce, estate, relocation)? That informs how much negotiation room exists.
- Crime grade is F in this area — have there been break-ins, vandalism, or insurance claims at this property in the last 3 years? What carrier currently insures it and at what premium?
- What's the average days-on-market for RENTAL listings here right now (not sales)? A rising rental-DOM trend means longer vacancies and softer asking-rent achievability than the comps imply.
- What's the recent tenant-quality profile in this submarket — average credit score on applications, eviction rate, late-payment / NSF rate, and stable-employment percentage? A property-management company in the area should have these aggregated.
- How much new for-sale + rental construction is in the pipeline within 1–3 miles? Heavy new supply typically softens prices + rents 12–24 months out; constrained supply supports both.
Investment metrics
- 1% rule
- 1.65% ✓
- Cap rate
- 13.68%
- Cash-on-cash
- 26.38%
- DSCR
- 2.17
- GRM
- 5.0
CMA / ARV
- ARV (median comp)
- $105,426
- List price
- $129,900
- Delta
- 23.21%
- Verdict
- OVERPRICED
- Comps
- 20 within 1.0 mi
Show comp detail 12 sales within ~0.75 mi
| Address | Dist | Beds/Ba | Sqft | Sold | Price | $/sf | Match |
|---|---|---|---|---|---|---|---|
| 18501 52nd Ave W #88 | 0.08mi | 2/2.0 | 902 (-1%) | 6mo | $129,800 | $144 | 87 |
| 18501 52nd Ave W #18 | 0.08mi | 2/2.0 | 924 (+2%) | 13mo | $125,897 | $136 | 79 |
| 18501 52nd Ave W #15 | 0.08mi | 2/1.0 | 840 (-8%) | 14mo | $111,000 | $132 | 72 |
| 18501 52nd Ave W #41 | 0.08mi | 2/1.0 | 840 (-8%) | 15mo | $20,000 | $24 | 71 |
| 18501 52nd Ave W #37 | 0.08mi | 2/1.0 | 784 (-14%) | 6mo | $35,000 | $45 | 69 |
| 5220 176th St SW #27 | 0.45mi | 2/1.0 | 840 (-8%) | 7mo | $52,500 | $63 | 61 |
| 5001 180th St SW #33 | 0.28mi | 2/1.0 | 791 (-13%) | 9mo | $92,000 | $116 | 58 |
| 5001 180th St SW #30 | 0.28mi | 2/1.0 | 791 (-13%) | 15mo | $100,000 | $126 | 53 |
| 5220 176th St SW #4 | 0.45mi | 2/1.5 | 1,040 (+14%) | 1mo | $85,000 | $82 | 52 |
| 5001 180th St SW #28 | 0.28mi | 2/1.0 | 791 (-13%) | 16mo | $116,700 | $148 | 52 |
| 5220 176th St SW #8 | 0.45mi | 2/1.0 | 784 (-14%) | 6mo | $60,000 | $77 | 51 |
| 5001 180th St SW #29 | 0.28mi | 2/1.0 | 784 (-14%) | 17mo | $63,000 | $80 | 50 |
Match score weights: distance 35% · size 25% · config 20% · recency 20%. Top-matched comps best support the ARV.
Projected returns pro-forma
-3.0% appreciation · 1.37% rent growth · sell at horizon
- IRR
- 18.3%
- Equity multiple
- 1.73×
- Total profit
- $26,436
- Equity at exit
- $19,369
- IRR
- 25.6%
- Equity multiple
- 3.06×
- Total profit
- $74,952
- Equity at exit
- $11,231
Cash invested: $36,372 (down + closing). Projections, not guarantees.
Landlord ↔ Tenant lean methodology
- Overall (STATE)
- 28 Tenant-Leaning
- State Washington
- 28 Tenant-Leaning · D+8
- County
- — inherits STATE
- City
- — inherits STATE
ZIP-level market 98037
- Rents YoY
- 1.4%
- Active inventory
- 173
- Price-to-rent
- 5.0×
Monthly cashflow live
- Estimated rent
- $2,148 high interval (Pro) →
- Mortgage (P&I)
- −$681
- Tax est. 1.5%
- −$162 /mo · $1,948/yr
- Insurance
- −$54
- HOA
- −$0
- Vacancy / Maint / Mgmt
- −$451
- Net cashflow
- $800
Break-even live
UW: 25.0% down · 7.5% · 30yr · 1.5% tax · 5.0% vac · 8.0% maint · 8.0% mgmt
Financing live
Cash to close
- Down payment
- $32,475
- Closing costs
- $3,897
- Reserves months
- —
- Total cash needed
- —
Loan-product check · same deal, 3 products live
Conventional
25% down · 7.5% · 30yr
- Down + closing
- —
- Monthly P&I
- —
- Monthly cashflow
- —
- DSCR
- —
- Eligible?
- —
Personal DTI + credit; lowest rate.
DSCR
20% down · 8.5% · 30yr
- Down + closing
- —
- Monthly P&I
- —
- Monthly cashflow
- —
- DSCR
- —
- Eligible?
- —
No personal income docs; deal must DSCR.
Hard money
10% down · 12.0% · 12mo
- Down + closing
- —
- Monthly P&I
- —
- Monthly cashflow
- —
- DSCR
- —
- Eligible?
- —
Short-term bridge; refi at stabilization.
Rent comps 40 comps
| Address | Beds | Baths | Sqft | Rent | $/sqft | DOM | Units | Dist |
|---|---|---|---|---|---|---|---|---|
| 18400 52nd Ave W Lynnwood, WA | 2.0 | 1.0 | 1092 | $1,995 | $1.83 | 43d | 1 | 0.10mi |
| 18534 52nd Ave W Lynnwood, WA | 2.0 | 2.0 | 1100 | $2,295 | $2.09 | 1d | 1 | 0.18mi |
| 5311 188th St SW Lynnwood, WA | 2.0 | 1.5 | 1004 | $2,500 | $2.49 | 43d | 1 | 0.27mi |
| 5620 183rd St SW Lynnwood, WA | 1.0–2.0 | 1.0 | 787 | $2,075 | $2.63 | 2d | 2 | 0.38mi |
| 5707 186th Pl SW Unit 4-PLEX 1 Lynnwood, WA | 2.0 | 2.0 | 1000 | $2,135 | $2.13 | 24d | 1 | 0.40mi |
| 5624 183rd St SW Lynnwood, WA | 1.0–2.0 | 1.0 | 787 | $2,100 | $2.67 | 4d | 2 | 0.41mi |
| 4816 176th St SW Lynnwood, WA | 1.0–2.0 | 1.0–1.5 | 802 | $1,970 | $2.45 | 2d | 6 | 0.48mi |
| 4702 176th St SW Lynnwood, WA | 1.0–2.0 | 1.0 | 886 | $1,925 | $2.17 | 2d | 8 | 0.49mi |
| 4502 176th St SW Unit 2 Lynnwood, WA | 2.0 | 2.0 | 1004 | $2,195 | $2.19 | 43d | 1 | 0.50mi |
| 17828 44th Ave W Unit 2 Lynnwood, WA | 2.0 | 2.0 | 750 | $2,100 | $2.80 | 43d | 1 | 0.52mi |
| 4432 176th St SW Unit 3 Lynnwood, WA | 2.0 | 2.0 | 1004 | $2,195 | $2.19 | 43d | 1 | 0.55mi |
| 4432 176th St SW Unit 2 Lynnwood, WA | 2.0 | 2.0 | 1004 | $2,195 | $2.19 | 23d | 1 | 0.55mi |
| 4428 176th St SW Unit 4 Lynnwood, WA | 2.0 | 2.0 | 1004 | $2,195 | $2.19 | 23d | 1 | 0.56mi |
| 17422 52nd Ave W Lynnwood, WA | 2.0 | 1.5 | 850 | $1,960 | $2.31 | 24d | 1 | 0.58mi |
| 4410 176th St SW Lynnwood, WA | 1.0–2.0 | 1.0 | 770 | $1,850 | $2.40 | 4d | 3 | 0.62mi |
| 17529 44th Ave W Lynnwood, WA | 2.0 | 1.0 | 1000 | $2,395 | $2.40 | 3d | 1 | 0.68mi |
| 5419 172nd Pl SW Lynnwood, WA | 3.0 | 2.0 | 980 | $2,895 | $2.95 | 24d | 1 | 0.76mi |
| 17314 44th Ave W Unit C Lynnwood, WA | 2.0 | 1.5 | 1000 | $2,200 | $2.20 | 17d | 1 | 0.78mi |
| 19801 50th Ave W Lynnwood, WA | 1.0–2.0 | 1.0 | 825 | $1,925 | $2.33 | 4d | 5 | 0.86mi |
| 19800 50th Ave W Lynnwood, WA | 2.0 | 1.0 | 854 | $1,790 | $2.10 | 2d | 4 | 0.90mi |
| 19309 40th Ave W Lynnwood, WA | 2.0 | 1.0–1.5 | 707 | $2,580 | $3.65 | 43d | 3 | 0.92mi |
| 18124 36th Ave W Lynnwood, WA | 1.0–2.0 | 1.0–2.0 | 821 | $2,155 | $2.62 | 2d | 8 | 0.93mi |
| 5618 198th St SW Unit 202 Lynnwood, WA | 2.0 | 1.0 | 817 | $1,750 | $2.14 | 3d | 1 | 0.96mi |
| 18505 36th Ave W Lynnwood, WA | 1.0–2.0 | 1.0–2.0 | 776 | $2,356 | $3.04 | 1d | 9 | 0.99mi |
| 18031 36th Ave W Lynnwood, WA | 1.0–2.0 | 1.0–2.0 | 760 | $2,186 | $2.88 | 2d | 6 | 0.99mi |
| 4807 200th St SW Lynnwood, WA | 2.0–3.0 | 1.0 | 935 | $1,550 | $1.66 | 1d | 12 | 0.99mi |
| 5720 198th St SW Lynnwood, WA | 1.0 | 1.0 | 688 | $1,525 | $2.22 | 43d | 1 | 1.00mi |
| 19501 40th Ave W Lynnwood, WA | 1.0–2.0 | 1.0 | 662 | $2,346 | $3.54 | 2d | 25 | 1.00mi |
| 4727 200th St SW Lynnwood, WA | 1.0–2.0 | 1.0–1.5 | 875 | $2,558 | $2.92 | 1d | 12 | 1.00mi |
| 19900 56th Ave W Unit A33 Lynnwood, WA | 1.0 | 1.0 | 675 | $1,645 | $2.44 | 14d | 1 | 1.01mi |
| 5725 200th St SW Lynnwood, WA | 2.0 | 1.0 | 800 | $2,000 | $2.50 | 16d | 1 | 1.05mi |
| 19815 Scriber Lake Rd Lynnwood, WA | 1.0 | 1.0 | 495 | $1,634 | $3.30 | 2d | 10 | 1.05mi |
| 4800 200th St SW Unit E201 Lynnwood, WA | 2.0 | 2.0 | 971 | $2,300 | $2.37 | 4d | 1 | 1.06mi |
| 4001 198th St SW Lynnwood, WA | 3.0 | 1.0–2.0 | 905 | $3,115 | $3.44 | 2d | 242 | 1.08mi |
| 4301 Alderwood Mall Blvd Lynnwood, WA | 2.0 | 1.0 | 440 | $2,100 | $4.77 | 2d | 14 | 1.09mi |
| 16604 48th Ave W Lynnwood, WA | 1.0–3.0 | 1.0–2.0 | 890 | $2,162 | $2.43 | 2d | 9 | 1.11mi |
| 19301 36th Ave W Lynnwood, WA | 2.0 | 1.5 | 1080 | $2,250 | $2.08 | 24d | 1 | 1.11mi |
| 19301 36th Ave W Unit 37 Lynnwood, WA | 2.0 | 1.5 | 1080 | $2,250 | $2.08 | 10d | 1 | 1.13mi |
| 5812 200th St SW Unit B Lynnwood, WA | 2.0 | 2.0 | 942 | $2,300 | $2.44 | 43d | 1 | 1.13mi |
| 19888 40th Ave W Lynnwood, WA | 1.0 | 1.0 | 572 | $2,565 | $4.48 | 2d | 8 | 1.15mi |
Listing history 15 events
-
2026-06-18days on market $129,900 Active 192 DOM
-
2026-06-17days on market $129,900 Active 191 DOM
-
2026-06-16days on market $129,900 Active 190 DOM
-
2026-06-15days on market $129,900 Active 189 DOM
-
2026-06-13days on market $129,900 Active 187 DOM
-
2026-06-13days on market $129,900 Active 186 DOM
-
2026-06-09days on market $129,900 Active 183 DOM
-
2026-06-08days on market $129,900 Active 182 DOM
-
2026-06-07days on market $129,900 Active 181 DOM
-
2026-06-04days on market $129,900 Active 178 DOM
-
2026-06-03days on market $129,900 Active 177 DOM
-
2026-06-02days on market $129,900 Active 176 DOM
-
2026-06-01days on market $129,900 Active 175 DOM
-
2026-05-31days on market $129,900 Active 174 DOM
-
2025-12-08$129,900 Active
ⓘ Source: listings_history table (triggers on properties + properties_extension) + one-shot
backfill from property_details.listing_events for pre-trigger history.
Nearby sold comps map
Loading sold comps map…
Walkable amenities ~0.75 mi
Loading nearby amenities…
Taxation est. · year 1
- Rental income
- $25,780
- − Mortgage interest
- −$7,276
- − Property taxes
- −$1,948
- − Insurance
- −$650
- − Repairs & maintenance
- −$2,062
- − Management
- −$2,062
- − Depreciation
- −$3,779
- Taxable income
- $8,002
- Est. tax owed @ 24.0%
- −$1,921
- After-tax cash flow
- $7,673/yr
For passive investors: Depreciation is non-cash, so a rental often shows a tax loss while cash-flowing — sheltering income. Rental losses are passive: they offset passive income freely, and up to $25,000/yr can offset ordinary (W-2) income if you actively participate and your MAGI is under $100k (phasing out to $0 by $150k); unused losses carry forward. On sale, claimed depreciation is recaptured at up to 25%, and gains may owe capital-gains tax (a 1031 exchange can defer both). Figures are a year-1 estimate at your 24.0% rate — not tax advice; consult a CPA.
Schools (NCES district)
- District
- Edmonds School District
- NCES district ID
- 5302400
- Math proficiency
- 54% ▼ -1.00%
- Reading proficiency
- 65% ▬ 0.00%
- Median HH income
- $67,451
- Composite
- 53.94/100
- National rank
- #3026
- State rank
- #53 of 291 in WA
Livability — Lynnwood
- Score
- 77/100
- State rank
- #150
- US rank
- #3226
Category grades
Schools grade is shown separately in the Schools card above.
Census & demographics
- Census place
- Lynnwood, WA
- County
- Snohomish County · 786,756 people
- City population
- 152,865
- Metro
- Seattle-Tacoma-Bellevue, WA
- Population (ZIP)
- 29,723
- Household income
- $107,281
- Rent vs Own
- Severe rent burden
- 1090.0
Population outlook (Snohomish County) Hauer SSP2
- Today (2025)
- 899,800 people
- By 2030
- 960,975 · +6.8%
- By 2040
- 1,074,447 · +19.4%
- By 2050
- 1,171,954 · +30.2%
- By 2075
- 1,384,849 · +53.9%
- By 2100
- 1,497,296 · +66.4%
Race, ethnicity, and origin ACS 2023
- Neighborhood character
- Diverse neighborhood (Simpson 0.69)
- Race & ethnicity
- White 48% Asian 23% Hispanic / Latino 15% Two or more races 12% Black 6%
- Hispanic origin (detail)
- Mexican 11%
- Common ancestry
- Portuguese 3% Italian 3% Slovak 2%
- Foreign-born
- 28% · Canada, China, South Korea
- Languages at home
- 65% English-only · Spanish 10% Chinese 4% Korean 4%
Political lean MEDSL · Snohomish
- 2024 margin
- D (+19.0) · D 57.8% · R 38.9% · Other 3.3%
- 2008→2024 swing
- +0.1pp no change · 2008: 18.9pp · 2024: 19.0pp
- All cycles
- 2024: D+19.0 2020: D+20.6 2016: D+16.6 2012: D+16.2 2008: D+18.9
Not yet ingested
- Civics
- —
Market trends
- HPI YoY
- ▼ -847.19%
- Current HPI
- 340.6136
- Rent YoY
- ▲ 1.37%
- Metro
- Seattle-Tacoma-Bellevue, WA
- State GDP YoY
- ▲ 4.65%
- F500 in state
- 22
Industry mix (Fortune 500 HQ in WA)
| Industry | F500 HQs | Revenue |
|---|---|---|
| Retail | 2 | $269B |
|
||
| Technology / Retail | 1 | $638B |
|
||
| Technology | 1 | $245B |
|
||
| Telecommunications | 1 | $38B |
|
||
| Food / Beverage | 1 | $36B |
|
||
| Automotive / Trucks | 1 | $34B |
|
||
Price history
1 event — show timeline
- 2025-12-08 Listed $129,900 NWMLS as Distributed by MLS Grid
Property tax history
+5.7%/yrLatest (2026): $118 · +44.3% YoY. Source: county tax records.
Cash-flow waterfall
monthlySold comps — $/sqft
last 12 mo · ≤1 miLoading sold comps…