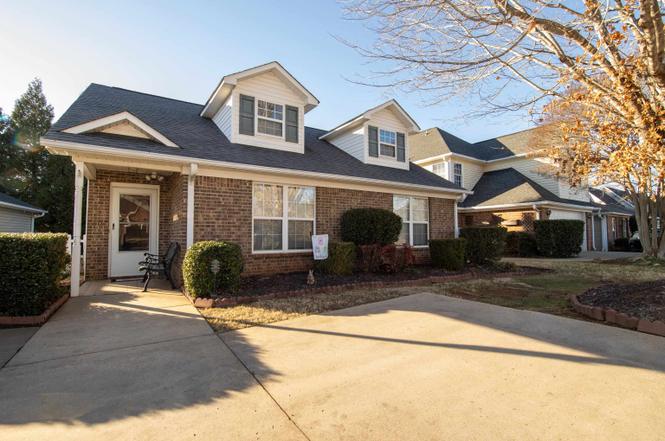
32 Arbours West Ln Ln · Roebuck, SC
Flood risk 1/10 · Minimal
- FEMA flood zone
- X (unshaded)
- Chance of flooding over 30 yrs
- 0.0%
- Est. flood insurance / yr
- $507 – $1,088
Fire risk 3/10 · Minor
- Est. fire insurance / yr
- $783 – $1,453
Heat risk 6/10 · Moderate
- Hot days now (above 105°F)
- 7 days/yr
- Hot days in 30 yrs
- 16 days/yr
Wind risk 2/10 · Minimal
- Chance of severe wind over 30 yrs
- 2.0%
Air-quality risk 4/10 · Minor
- Unhealthy air days now
- 4 days/yr
- Unhealthy air days in 30 yrs
- 5 days/yr
Risk factors via First Street. Map © Google.
Why this score? — see what drove the D+ grade
The composite is a weighted blend of 9 inputs, each scored 0–100. Each bar is that input's sub-score; the figure is the points it added to the 100-point composite (weight × sub-score).
- ARV discount +15.0/15.0
- Cash flow +14.5/30.0
- DSCR +4.4/10.0
- 1% rule +3.6/10.0
- Schools +3.2/10.0
- Livability +3.2/5.0
- Rent growth +2.9/5.0
- Condition / age +2.5/5.0
- Appreciation +0.0/10.0
$240,000
🖨 Deal sheet (PDF) 📄 Offer letter ✓ Due diligence
Listing remarks
* * NEW LOWER PRICE * * Welcome Home to the sought after neighborhood of Arbours West! This CHARMING 3BR/2BA home has a lot to offer!! Spacious living room for entertaining family and friends. Master bedroom is on the main level with a full bath and walk-in closet and separate laundry with washer and dryer, included! New Hot Water Heater (2019). New garbage disposal (2025), New HVAC (2024) Roof (2016) Large eat-in kitchen and open dining living area with gas logs fireplace. Full hall bath and two roomy bedrooms. Fenced backyard where you can enjoy nice evenings on the manufactured poly-deck knowing that you won't have to stain of care for it and you can leave the yard work to someone els
Key facts
- Clubhouse
- Walk-in closet
- Neighborhood pool
Tags
Property features AI
Finance
- HOA & community: Homeowners association with a $145 association fee; Community clubhouse and pool
Exterior
- Parking: No designated parking listed
- Utilities: Public water; Private sewer; Underground utilities
- Home design: Single-family residence; One story; Brick veneer and vinyl siding; Slab foundation
- Construction: Brick veneer construction; Vinyl siding; Slab foundation
- Exterior features: Storage; Enclosed porch; Deck; Porch; Storm doors
Interior
- Kitchen: Dishwasher; Disposal; Microwave; Electric range / Free-standing range; Refrigerator; Gas water heater
- Bedrooms: 3 bedrooms on the main level
- Flooring: Carpet; Vinyl
- Bathrooms: 2 full bathrooms (both on the main level)
- Heating & cooling: Natural gas heating; Forced air; Heat pump; Central air; Ceiling fans; Electric cooling
- Interior features: Walk-in closets; Ceiling fans; Laminate counters; Storm windows; Gas log fireplace
- Laundry & utility: Washer hookup on main level; Electric dryer hookup on main level; Washer and dryer included
Neighborhood map
What this means for you Summary
Snapshot
- This is a 3-bed/2.0-bath single-family listed at $240k.
Deal economics
- At list price, monthly cash flow is $54 ($646/yr) — positive.
- The deal already cash-flows at list — no discount required.
- To meet the 1% rule (rent ≥ 1% of price), the offer needs to be $206k (14.3% below list).
- Recommended offer: $206k (14.3% below list) — sets the bar for 1% rule.
- Cap rate 6.6% vs local median 4.7% in Roebuck — top-decile yield for the area; either an underpriced asset or a hidden risk that comps aren't pricing in. Stress-test before assuming the spread holds.
Location & tenants
- Location reads 64/100 on livability (#147 in SC) — a middle-class / working-renter tenant base. Strengths: crime A+, cost of living A+, housing A+; Watch: amenities F, commute F, health & safety F.
- Spartanburg 06 (suburban): math 33% / reading 42% proficiency, ranked #35 of 80 in SC (top 44%) — families likely to look elsewhere, expect single-tenant / working-renter base with shorter leases.
- Zoned schools: R. P. Dawkins Middle (math 38% / reading 44%, grade F, #72 of 229 statewide, top 32%, 862 students, 76% FRL); Dorman High (math 46% / reading 78%, grade B-, #99 of 196 statewide, top 53%, 3,808 students, 75% FRL) — zoned schools average 76% FRL vs 48% district-wide (27 pts higher); higher-poverty schools than district average — tighter screening recommended.
- Zoned-school proficiency averages 52% at this address vs 38% district-wide (+14 pts) — the actual schools serving this property are materially stronger than the Spartanburg 06 average implies; a family-tenant draw the district grade alone would hide.
- Market conditions: Rents rising (+1.8%/yr); 357 active listings in the ZIP; 2 comparable units currently listed for rent nearby; solid renter incomes; 3,129 units permitted in Spartanburg County in 2024 (40 in 5+ unit buildings).
Forward outlook
- Local home prices are declining (-3.0%/yr); year-one equity from $2k of loan paydown is wiped out by about $7k of value loss. Plan a longer hold.
- Spartanburg County population projected at +18% by 2050 — long-run rental-demand tailwind backs the buy-and-hold thesis.
Negotiation context
- It's been on market 121 days — a 12% lower offer ($211k) is reasonable based on typical stale-listing flexibility.
Risks & watch-outs
- Climate carrying-cost: extreme-heat days projected 7→16/yr by 2055 (HVAC capex compounding) — expect insurance premiums to compound above CPI over the hold.
Questions for the listing agent
- It's been on market 121 days. Have you received any prior offers? Is the seller open to a 14% concession, seller financing, or rate buy-down credit?
- What does the HOA fee cover, when was the last increase, and are there any pending special assessments or reserve-fund shortfalls?
- Why hasn't it sold? Are there any deal-killer items the seller is aware of (foundation, flood, title, zoning, code violations)?
- Is there a deadline driving the sale (1031 exchange, divorce, estate, relocation)? That informs how much negotiation room exists.
- Schools are D-rated, which usually means shorter tenancies and higher turnover. Who's the typical renter profile here, and what's been the actual vacancy rate?
- The area grade is low — what's the realistic commute time and amenity access for the typical tenant pool here? Any planned neighborhood developments (good or bad) we should know about?
- What's the average days-on-market for RENTAL listings here right now (not sales)? A rising rental-DOM trend means longer vacancies and softer asking-rent achievability than the comps imply.
- What's the recent tenant-quality profile in this submarket — average credit score on applications, eviction rate, late-payment / NSF rate, and stable-employment percentage? A property-management company in the area should have these aggregated.
- How much new for-sale + rental construction is in the pipeline within 1–3 miles? Heavy new supply typically softens prices + rents 12–24 months out; constrained supply supports both.
Investment metrics
- 1% rule
- 0.86% ✗
- Cap rate
- 6.56%
- Cash-on-cash
- 0.96%
- DSCR
- 1.04
- GRM
- 9.7
CMA / ARV
- ARV (on-the-fly)
- $292,775
- Comps found
- 12
Show comp detail 12 sales within ~0.75 mi
| Address | Dist | Beds/Ba | Sqft | Sold | Price | $/sf | Match |
|---|---|---|---|---|---|---|---|
| 207 Old Salem Rd | 0.41mi | 3/2.0 | 1,648 (-2%) | 2mo | $270,000 | $164 | 76 |
| 433 Litchfield Dr | 0.42mi | 3/2.0 | 1,704 (+2%) | 2mo | $305,000 | $179 | 76 |
| 1149 Merlot Ct | 0.21mi | 3/2.5 | 1,550 (-7%) | 1mo | $228,000 | $147 | 75 |
| 422 Rambling Rose Way | 0.17mi | 3/2.0 | 1,862 (+11%) | 3mo | $330,000 | $177 | 71 |
| 2054 Lachaise Ln | 0.50mi | 3/2.0 | 1,576 (-6%) | 3mo | $277,500 | $176 | 65 |
| 173 Bradford Crossing Dr | 0.60mi | 3/2.0 | 1,774 (+6%) | 0mo | $305,000 | $172 | 62 |
| 2292 Davenport Ct | 0.49mi | 3/2.5 | 1,814 (+8%) | 1mo | $309,000 | $170 | 60 |
| 2601 Karkinnen Way | 0.45mi | 3/2.5 | 1,828 (+9%) | 2mo | $315,000 | $172 | 59 |
| 105 Churchill Ave | 0.35mi | 3/2.0 | 1,424 (-15%) | 1mo | $155,100 | $109 | 58 |
| 2281 Davenport Ct | 0.53mi | 3/2.5 | 1,828 (+9%) | 2mo | $319,000 | $175 | 56 |
| 2245 Davenport Court Ct | 0.62mi | 3/2.0 | 1,456 (-13%) | 2mo | $263,975 | $181 | 48 |
| 2236 Davenport Court Ct | 0.61mi | 3/2.0 | 1,456 (-13%) | 3mo | $259,930 | $179 | 47 |
Match score weights: distance 35% · size 25% · config 20% · recency 20%. Top-matched comps best support the ARV.
Projected returns pro-forma
-3.0% appreciation · 1.75% rent growth · sell at horizon
- IRR
- -16.1%
- Equity multiple
- 0.43×
- Total profit
- $-38,041
- Equity at exit
- $35,785
- IRR
- -10.0%
- Equity multiple
- 0.42×
- Total profit
- $-39,028
- Equity at exit
- $20,751
Cash invested: $67,200 (down + closing). Projections, not guarantees.
Landlord ↔ Tenant lean methodology
- Overall (STATE)
- 90 Strongly Landlord-Friendly
- State South Carolina
- 90 Strongly Landlord-Friendly · R+6
- County
- — inherits STATE
- City
- — inherits STATE
ZIP-level market 29369
- Home prices YoY
- -27.4%
- Rents YoY
- 1.8%
- Active inventory
- 357
- Price-to-rent
- 9.7×
Monthly cashflow live
- Estimated rent
- $2,057 medium interval (Pro) →
- Mortgage (P&I)
- −$1,259
- Tax from tax record
- −$67 /mo · $807/yr
- Insurance
- −$100
- HOA
- −$145
- Vacancy / Maint / Mgmt
- −$432
- Net cashflow
- $54
Break-even live
Sensitivity live
| Price | -10% $190 | -5% $122 | +0% $54 | +5% $-14 | +10% $-82 |
|---|---|---|---|---|---|
| Rent | -10% $-109 | -5% $-27 | +0% $54 | +5% $135 | +10% $216 |
| Rate | -1.0pp $175 | -0.5pp $115 | base $54 | +0.5pp $-8 | +1.0pp $-72 |
UW: 25.0% down · 7.5% · 30yr · 1.5% tax · 5.0% vac · 8.0% maint · 8.0% mgmt
Financing live
Cash to close
- Down payment
- $60,000
- Closing costs
- $7,200
- Reserves months
- —
- Total cash needed
- —
Loan-product check · same deal, 3 products live
Conventional
25% down · 7.5% · 30yr
- Down + closing
- —
- Monthly P&I
- —
- Monthly cashflow
- —
- DSCR
- —
- Eligible?
- —
Personal DTI + credit; lowest rate.
DSCR
20% down · 8.5% · 30yr
- Down + closing
- —
- Monthly P&I
- —
- Monthly cashflow
- —
- DSCR
- —
- Eligible?
- —
No personal income docs; deal must DSCR.
Hard money
10% down · 12.0% · 12mo
- Down + closing
- —
- Monthly P&I
- —
- Monthly cashflow
- —
- DSCR
- —
- Eligible?
- —
Short-term bridge; refi at stabilization.
Rent comps 2 comps
| Address | Beds | Baths | Sqft | Rent | $/sqft | DOM | Units | Dist |
|---|---|---|---|---|---|---|---|---|
| 6039 Haddington Dr Roebuck, SC | 3.0 | 2.5 | 1913 | $1,975 | $1.03 | 23d | 1 | 0.31mi |
| 2180 Davenport Ct Moore, SC | 3.0 | 2.0 | 1456 | $2,000 | $1.37 | 15d | 1 | 0.62mi |
HOA detail
- Monthly dues
- $145 · $1,740/yr
- Likely covers
- watertrashgas
Listing history 18 events
-
2026-06-22days on market $240,000 Active 121 DOM
-
2026-06-18days on market $240,000 Active 118 DOM
-
2026-06-17days on market $240,000 Active 117 DOM
-
2026-06-16days on market $240,000 Active 116 DOM
-
2026-06-15days on market $240,000 Active 115 DOM
-
2026-06-14days on market $240,000 Active 113 DOM
-
2026-06-13days on market $240,000 Active 112 DOM
-
2026-06-10days on market $240,000 Active 110 DOM
-
2026-06-09days on market $240,000 Active 109 DOM
-
2026-06-08days on market $240,000 Active 108 DOM
-
2026-06-07days on market $240,000 Active 107 DOM
-
2026-06-02days on market $240,000 Active 102 DOM
-
2026-06-01days on market $240,000 Active 101 DOM
-
2026-05-31days on market $240,000 Active 100 DOM
-
2026-05-30days on market $240,000 Active 99 DOM
-
2026-05-15price $240,000
-
2026-03-18price $244,900
-
2026-02-19$249,900 Active
ⓘ Source: listings_history table (triggers on properties + properties_extension) + one-shot
backfill from property_details.listing_events for pre-trigger history.
Tax reassessment forecast SC · Resets to sale price
- Current annual tax
- $807 · $67/mo
- Projected year-2 tax
- $1,368 · $114/mo
- Expected delta
- +$561/yr (+$47/mo · 69.5%)
ⓘ Screening estimate from a state-policy table — verify with the county assessor before closing.
Climate risk First Street
- Flood 1/10 Low FEMA zone X (unshaded) · 0% chance over 30 yrs
- Wildfire 3/10 Moderate
- Heat 6/10 Major 7 d/yr ≥105°F today · 16 d/yr by 30 yrs out
- Wind 2/10 Low 2% chance of damaging wind over 30 yrs
- Air quality 4/10 Moderate 4 unhealthy d/yr today · 5 by 30 yrs out
Nearby sold comps map
Loading sold comps map…
Walkable amenities ~0.75 mi
Loading nearby amenities…
Taxation est. · year 1
- Rental income
- $24,678
- − Mortgage interest
- −$13,444
- − Property taxes
- −$807
- − Insurance
- −$1,200
- − Repairs & maintenance
- −$1,974
- − Management
- −$1,974
- − HOA
- −$1,740
- − Depreciation
- −$6,982
- Taxable loss
- −$3,443
- Est. tax savings @ 24.0%
- +$826
- After-tax cash flow
- $1,472/yr
For passive investors: Depreciation is non-cash, so a rental often shows a tax loss while cash-flowing — sheltering income. Rental losses are passive: they offset passive income freely, and up to $25,000/yr can offset ordinary (W-2) income if you actively participate and your MAGI is under $100k (phasing out to $0 by $150k); unused losses carry forward. On sale, claimed depreciation is recaptured at up to 25%, and gains may owe capital-gains tax (a 1031 exchange can defer both). Figures are a year-1 estimate at your 24.0% rate — not tax advice; consult a CPA.
Schools (NCES district)
- District
- Spartanburg 06
- NCES district ID
- 4503630
- Math proficiency
- 33% ▼ -8.00%
- Reading proficiency
- 42% ▼ -2.00%
- Median HH income
- $46,110
- Composite
- 32.02/100
- National rank
- #5827
- State rank
- #35 of 80 in SC
Livability — Roebuck
- Score
- 64/100
- State rank
- #147
- US rank
- #13929
Category grades
Schools grade is shown separately in the Schools card above.
Census & demographics
- County
- Spartanburg County · 258,607 people
- Metro
- Spartanburg, SC
- Population (ZIP)
- 16,503
- Household income
- $82,924
- Rent vs Own
- Severe rent burden
- 199.0
Population outlook (Spartanburg County) Hauer SSP2
- Today (2025)
- 325,495 people
- By 2030
- 338,800 · +4.1%
- By 2040
- 363,471 · +11.7%
- By 2050
- 384,156 · +18.0%
- By 2075
- 430,137 · +32.1%
- By 2100
- 442,733 · +36.0%
Race, ethnicity, and origin ACS 2023
- Neighborhood character
- Predominantly White (65%)
- Race & ethnicity
- White 65% Black 20% Hispanic / Latino 11% Two or more races 9% Asian 2%
- Hispanic origin (detail)
- Mexican 4% Cuban 3%
- Common ancestry
- Italian 2% Lithuanian 2% Slovak 1%
- Foreign-born
- 8% · Canada, Jamaica, Dominican Republic
- Languages at home
- 87% English-only · Spanish 10% Other Indo-European 1% Russian/Polish/Slavic 1%
Political lean MEDSL · Spartanburg
- 2024 margin
- Solid R (+33.6) · D 32.6% · R 66.2% · Other 1.2%
- 2008→2024 swing
- -12.0pp toward R · 2008: -21.6pp · 2024: -33.6pp
- All cycles
- 2024: R+33.6 2020: R+27.3 2016: R+30.0 2012: R+23.1 2008: R+21.6
Not yet ingested
- Civics
- —
Market trends
- HPI YoY
- ▼ -80.31%
- Current HPI
- 212.4242
- Rent YoY
- ▲ 1.75%
- Metro
- Spartanburg, SC
- State GDP YoY
- ▲ 4.51%
- F500 in state
- 2
Industry mix (Fortune 500 HQ in SC)
| Industry | F500 HQs | Revenue |
|---|---|---|
| Packaging | 1 | $7B |
|
||
Price history
-4.0% since first listed3 events — show timeline
- 2026-05-15 Price Changed $240,000 SPMLS
- 2026-03-18 Price Changed $244,900 SPMLS
- 2026-02-19 Listed $249,900 SPMLS
Property tax history
+3.8%/yrLatest (2025): $807 · +1.4% YoY. Source: county tax records.
Cash-flow waterfall
monthlySold comps — $/sqft
last 12 mo · ≤1 miLoading sold comps…