2016 Grovefield Dr · Hopkins, SC
Flood risk 1/10 · Minimal
- FEMA flood zone
- X (unshaded)
- Chance of flooding over 30 yrs
- 0.0%
- Est. flood insurance / yr
- $507 – $1,088
Fire risk 3/10 · Minor
- Est. fire insurance / yr
- $783 – $1,453
Heat risk 6/10 · Moderate
- Hot days now (above 108°F)
- 7 days/yr
- Hot days in 30 yrs
- 16 days/yr
Wind risk 8/10 · Major
- Chance of severe wind over 30 yrs
- 80.0%
Air-quality risk 3/10 · Minor
- Unhealthy air days now
- 2 days/yr
- Unhealthy air days in 30 yrs
- 2 days/yr
Risk factors via First Street. Map © Google.
Why this score? — see what drove the D- grade
The composite is a weighted blend of 9 inputs, each scored 0–100. Each bar is that input's sub-score; the figure is the points it added to the 100-point composite (weight × sub-score).
- Cash flow +14.3/30.0
- DSCR +4.3/10.0
- 1% rule +4.2/10.0
- Condition / age +4.0/5.0
- Livability +3.0/5.0
- Schools +2.6/10.0
- Rent growth +2.5/5.0
- ARV discount +1.9/15.0
- Appreciation +0.0/10.0
$235,000
🖨 Deal sheet (PDF) 📄 Offer letter ✓ Due diligence
Listing remarks
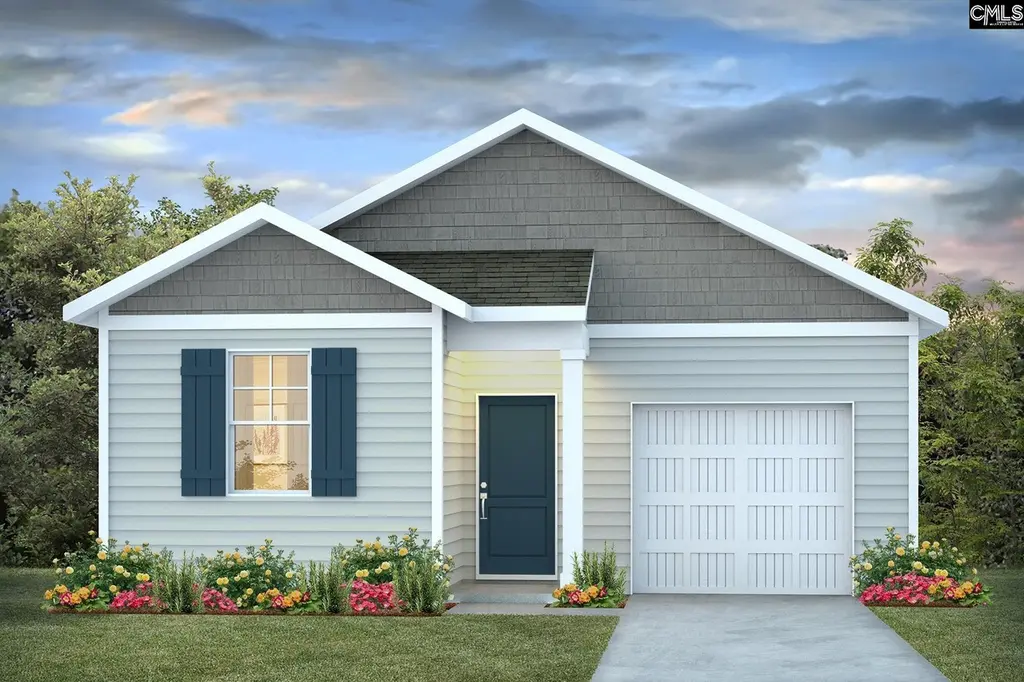
Unlock the Devon at 2016 Grovefield Drive and find a beautiful new construction ranch-style home in Hopkins, SC! This floorplan features an open concept floorplan, including the kitchen, dining, and living areas that are finished with matching vinyl flooring. There are sleek, white quartz counter tops in the kitchen, white cabinetry, and a floating island. The dining and living areas are bright with natural light from several windows, creating a warm, inviting feel. The 3 bedrooms and 2 bathrooms are all conveniently located on one level, with the primary privately located at the back of the home. An impressive en-suite bathroom and walk-in closet complete the primary suite. This home is eq
Key facts
- 4,791 sq ft lot
- Garage
- Community pool
Property features AI
Finance
- Other: Paved road access; Lot located in a community (lot #209, approx. 0.11 acre)
- HOA & community: Community association with common area maintenance, playground, pool and green areas; Community pool
Exterior
- Parking: Attached garage (1 car)
- Utilities: Public water; Public sewer
- Home design: Single-story home
- Construction: Slab foundation
- Exterior features: Patio; Vinyl exterior
Interior
- Kitchen: Eat-in kitchen with island; Pantry; Painted cabinets; Quartz countertops; Vinyl flooring; Microwave above stove; Dishwasher; Disposal; Free-standing gas range; Refrigerator
- Bedrooms: Main-level master with double vanity, private bath, walk-in closet and carpet floors; Main-level bedroom 2 with private closet and carpet floors; Main-level bedroom 3 with private closet and carpet floors
- Flooring: Carpet in bedrooms; Vinyl floors in living areas and kitchen
- Bathrooms: Two full bathrooms
- Heating & cooling: Central cooling; Gas heating on main level
- Interior features: Garage opener; Attic with pull-down access; Tankless water heater; Gas water heater
- Laundry & utility: Washer and dryer included; Washer/Dryer located on main level
Neighborhood map
What this means for you Summary
Snapshot
- This is a 3-bed/2.0-bath single-family listed at $235k. Condition is rated good.
Deal economics
- At list price, monthly cash flow is $42 ($499/yr) — positive.
- The deal already cash-flows at list — no discount required.
- To meet the 1% rule (rent ≥ 1% of price), the offer needs to be $216k (8.1% below list).
- Recommended offer: $216k (8.1% below list) — sets the bar for 1% rule.
Location & tenants
- Location reads 59/100 on livability (#238 in SC) — a working-class tenant base; expect higher turnover. Strengths: cost of living A+, crime B+, housing B; Watch: employment D+, amenities F, commute F.
- Richland 01 (urban): math 26% / reading 36% proficiency, ranked #54 of 80 in SC (top 68%) — families likely to look elsewhere, expect single-tenant / working-renter base with shorter leases; 64% free/reduced lunch — lower-income household profile, screen leases tightly.
- Zoned schools: Horrell Hill Elementary (math 17% / reading 17%, grade F, #515 of 597 statewide, top 89%, 562 students, 100% FRL); Southeast Middle (math 7% / reading 19%, grade F, #210 of 229 statewide, top 93%, 493 students, 100% FRL); Lower Richland High (math 5% / reading 64%, grade F, #185 of 196 statewide, top 94%, 1,244 students, 100% FRL) — zoned schools average 100% FRL vs 64% district-wide (36 pts higher); higher-poverty schools than district average — tighter screening recommended.
- Market conditions: 335 active listings in the ZIP; 6 comparable units currently listed for rent nearby; rentals at typical pace (median 25d on market — plan ~3-4 weeks tenant-placement turnaround); 3,472 units permitted in Richland County in 2024 (1,096 in 5+ unit buildings).
- This rent runs 43% of the median local income ($60k/yr) — at the standard rent-burdened threshold; future hikes will face affordability resistance.
Forward outlook
- Local home prices are declining (-3.0%/yr); year-one equity from $2k of loan paydown is wiped out by about $7k of value loss. Plan a longer hold.
- Richland County population projected at +30% by 2050 — long-run rental-demand tailwind backs the buy-and-hold thesis.
Negotiation context
- Only 1 days on market — expect competitive offers; lowballing is unlikely to land.
Risks & watch-outs
- Climate carrying-cost: severe wind risk, 80% chance of damaging wind over 30y; extreme-heat days projected 7→16/yr by 2055 (HVAC capex compounding) — expect insurance premiums to compound above CPI over the hold.
Questions for the listing agent
- What does the HOA fee cover, when was the last increase, and are there any pending special assessments or reserve-fund shortfalls?
- Is there a deadline driving the sale (1031 exchange, divorce, estate, relocation)? That informs how much negotiation room exists.
- Schools are F-rated, which usually means shorter tenancies and higher turnover. Who's the typical renter profile here, and what's been the actual vacancy rate?
- The area grade is low — what's the realistic commute time and amenity access for the typical tenant pool here? Any planned neighborhood developments (good or bad) we should know about?
- What's the average days-on-market for RENTAL listings here right now (not sales)? A rising rental-DOM trend means longer vacancies and softer asking-rent achievability than the comps imply.
- What's the recent tenant-quality profile in this submarket — average credit score on applications, eviction rate, late-payment / NSF rate, and stable-employment percentage? A property-management company in the area should have these aggregated.
- How much new for-sale + rental construction is in the pipeline within 1–3 miles? Heavy new supply typically softens prices + rents 12–24 months out; constrained supply supports both.
Investment metrics
- 1% rule
- 0.92% ✗
- Cap rate
- 6.51%
- Cash-on-cash
- 0.76%
- DSCR
- 1.03
- GRM
- 9.1
CMA / ARV
- ARV (on-the-fly)
- $208,803
- Comps found
- 1
Show comp detail 1 sale within ~0.75 mi
| Address | Dist | Beds/Ba | Sqft | Sold | Price | $/sf | Match |
|---|---|---|---|---|---|---|---|
| 972 Harvest Valley Ln | 0.36mi | 3/2.5 | 1,404 (+10%) | 18mo | $228,900 | $163 | 50 |
Match score weights: distance 35% · size 25% · config 20% · recency 20%. Top-matched comps best support the ARV.
Projected returns pro-forma
-3.0% appreciation · 3.0% rent growth · sell at horizon
- IRR
- -15.1%
- Equity multiple
- 0.46×
- Total profit
- $-35,373
- Equity at exit
- $35,039
- IRR
- -6.4%
- Equity multiple
- 0.59×
- Total profit
- $-27,157
- Equity at exit
- $20,319
Cash invested: $65,800 (down + closing). Projections, not guarantees.
Landlord ↔ Tenant lean methodology
- Overall (STATE)
- 90 Strongly Landlord-Friendly
- State South Carolina
- 90 Strongly Landlord-Friendly · R+6
- County
- — inherits STATE
- City
- — inherits STATE
ZIP-level market 29061
- Home prices YoY
- -22.8%
- Active inventory
- 335
- Price-to-rent
- 9.1×
Monthly cashflow live
- Estimated rent
- $2,159 high interval (Pro) →
- Mortgage (P&I)
- −$1,232
- Tax est. 1.5%
- −$294 /mo · $3,525/yr
- Insurance
- −$98
- HOA
- −$40
- Vacancy / Maint / Mgmt
- −$453
- Net cashflow
- $42
Break-even live
Sensitivity live
| Price | -10% $204 | -5% $123 | +0% $42 | +5% $-40 | +10% $-121 |
|---|---|---|---|---|---|
| Rent | -10% $-129 | -5% $-44 | +0% $42 | +5% $127 | +10% $212 |
| Rate | -1.0pp $160 | -0.5pp $101 | base $42 | +0.5pp $-19 | +1.0pp $-81 |
UW: 25.0% down · 7.5% · 30yr · 1.5% tax · 5.0% vac · 8.0% maint · 8.0% mgmt
Financing live
Cash to close
- Down payment
- $58,750
- Closing costs
- $7,050
- Reserves months
- —
- Total cash needed
- —
Loan-product check · same deal, 3 products live
Conventional
25% down · 7.5% · 30yr
- Down + closing
- —
- Monthly P&I
- —
- Monthly cashflow
- —
- DSCR
- —
- Eligible?
- —
Personal DTI + credit; lowest rate.
DSCR
20% down · 8.5% · 30yr
- Down + closing
- —
- Monthly P&I
- —
- Monthly cashflow
- —
- DSCR
- —
- Eligible?
- —
No personal income docs; deal must DSCR.
Hard money
10% down · 12.0% · 12mo
- Down + closing
- —
- Monthly P&I
- —
- Monthly cashflow
- —
- DSCR
- —
- Eligible?
- —
Short-term bridge; refi at stabilization.
Rent comps 6 comps
| Address | Beds | Baths | Sqft | Rent | $/sqft | DOM | Units | Dist |
|---|---|---|---|---|---|---|---|---|
| 345 Bevington Brook Ln Hopkins, SC | 3.0 | 2.0 | 1475 | $2,195 | $1.49 | 25d | 1 | 0.13mi |
| 455 Hunters Crossing Dr Hopkins, SC | 3.0 | 2.0 | 1381 | $1,699 | $1.23 | 16d | 1 | 0.48mi |
| 1049 Crescent Moon Loop Hopkins, SC | 3.0 | 2.5 | 1650 | $2,100 | $1.27 | 16d | 1 | 0.88mi |
| 1912 Dominion Dr Columbia, SC | 4.0 | 2.0 | 1614 | $2,300 | $1.43 | 25d | 1 | 1.19mi |
| 2011 Dominion Dr Columbia, SC | 3.0 | 2.0 | 1625 | $1,595 | $0.98 | 25d | 1 | 1.26mi |
| 2705 Prince Charles Ct Columbia, SC | 4.0 | 2.0 | 1466 | $1,906 | $1.30 | 25d | 1 | 1.45mi |
HOA detail
- Monthly dues
- $40 · $480/yr
Listing history 2 events
-
2026-04-27status Pending
-
2026-04-27$235,000 Active
ⓘ Source: listings_history table (triggers on properties + properties_extension) + one-shot
backfill from property_details.listing_events for pre-trigger history.
Climate risk First Street
- Flood 1/10 Low FEMA zone X (unshaded) · 0% chance over 30 yrs
- Wildfire 3/10 Moderate
- Heat 6/10 Major 7 d/yr ≥108°F today · 16 d/yr by 30 yrs out
- Wind 8/10 Severe 80% chance of damaging wind over 30 yrs
- Air quality 3/10 Moderate 2 unhealthy d/yr today · 2 by 30 yrs out
Nearby sold comps map
Loading sold comps map…
Walkable amenities ~0.75 mi
Loading nearby amenities…
Taxation est. · year 1
- Rental income
- $25,908
- − Mortgage interest
- −$13,164
- − Property taxes
- −$3,525
- − Insurance
- −$1,175
- − Repairs & maintenance
- −$2,073
- − Management
- −$2,073
- − HOA
- −$480
- − Depreciation
- −$6,836
- Taxable loss
- −$3,417
- Est. tax savings @ 24.0%
- +$820
- After-tax cash flow
- $1,319/yr
For passive investors: Depreciation is non-cash, so a rental often shows a tax loss while cash-flowing — sheltering income. Rental losses are passive: they offset passive income freely, and up to $25,000/yr can offset ordinary (W-2) income if you actively participate and your MAGI is under $100k (phasing out to $0 by $150k); unused losses carry forward. On sale, claimed depreciation is recaptured at up to 25%, and gains may owe capital-gains tax (a 1031 exchange can defer both). Figures are a year-1 estimate at your 24.0% rate — not tax advice; consult a CPA.
Condition & rehab AI · 12 photos
This beautiful new construction ranch-style home in Hopkins, SC is move-in ready with good condition and minimal maintenance needs. It offers an open concept floorplan, quartz countertops, and hardwood floors. Consider painting the exterior siding and landscaping to further enhance its curb appeal and value.
Value-add opportunities
- Both Painting exterior siding — Enhances curb appeal and value
- Both Landscaping improvements — Enhances curb appeal and value
- Both Replace window treatments — Enhances curb appeal and value
Renovation cost estimate screening
Value-add ROI direction
- Both Painting exterior siding — Enhances curb appeal and value ↑
- Both Landscaping improvements — Enhances curb appeal and value ↑
- Both Replace window treatments — Enhances curb appeal and value ↑
ⓘ Cost ranges are severity-bucket heuristics (US national rule-of-thumb). Get contractor quotes + a written scope before underwriting a rehab budget.
Schools (NCES district)
- District
- Richland 01
- NCES district ID
- 4503360
- Math proficiency
- 26% ▼ -7.00%
- Reading proficiency
- 36% ▼ -5.00%
- Median HH income
- $38,931
- Composite
- 25.94/100
- National rank
- #7335
- State rank
- #54 of 80 in SC
Livability — Hopkins
- Score
- 59/100
- State rank
- #238
- US rank
- #19825
Category grades
Schools grade is shown separately in the Schools card above.
Census & demographics
- County
- Richland County · 389,530 people
- City population
- 12,538
- Metro
- Columbia, SC
- Population (ZIP)
- 12,538
- Household income
- $60,307
- Rent vs Own
- Severe rent burden
- 236.0
Population outlook (Richland County) Hauer SSP2
- Today (2025)
- 459,667 people
- By 2030
- 487,524 · +6.1%
- By 2040
- 542,035 · +17.9%
- By 2050
- 595,371 · +29.5%
- By 2075
- 732,998 · +59.5%
- By 2100
- 820,415 · +78.5%
Race, ethnicity, and origin ACS 2023
- Neighborhood character
- Predominantly Black (68%)
- Race & ethnicity
- Black 68% White 23% Two or more races 6% Hispanic / Latino 4%
- Common ancestry
- Italian 1% Lithuanian 1% Romanian 1%
- Foreign-born
- 3% · Canada
- Languages at home
- 96% English-only · Spanish 3%
Political lean MEDSL · Richland
- 2024 margin
- Solid D (+34.6) · D 66.4% · R 31.8% · Other 1.8%
- 2008→2024 swing
- +5.7pp toward D · 2008: 28.9pp · 2024: 34.6pp
- All cycles
- 2024: D+34.6 2020: D+38.3 2016: D+32.9 2012: D+33.3 2008: D+28.9
Not yet ingested
- Civics
- —
Market trends
- HPI YoY
- ▼ -57.44%
- Current HPI
- 194.8986
- Rent YoY
- —
- Metro
- Columbia, SC
- State GDP YoY
- ▲ 4.51%
- F500 in state
- 2
Industry mix (Fortune 500 HQ in SC)
| Industry | F500 HQs | Revenue |
|---|---|---|
| Packaging | 1 | $7B |
|
||
Price history
2 events — show timeline
- 2026-04-27 Pending — Consolidated MLS
- 2026-04-27 Listed $235,000 Consolidated MLS
Cash-flow waterfall
monthlySold comps — $/sqft
last 12 mo · ≤1 miLoading sold comps…