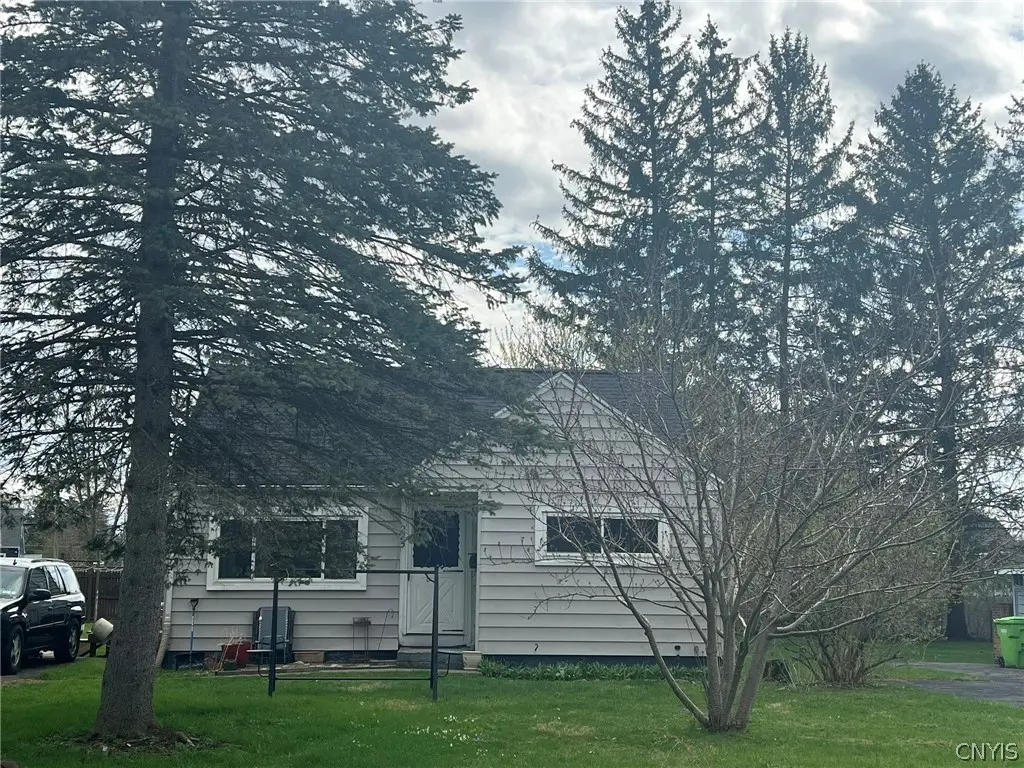
225 Ruhamah Ave · Nedrow, NY
Flood risk 1/10 · Minimal
- FEMA flood zone
- X (unshaded)
- Chance of flooding over 30 yrs
- 0.0%
- Est. flood insurance / yr
- $473 – $860
Fire risk 1/10 · Minimal
- Est. fire insurance / yr
- $691 – $1,283
Heat risk 3/10 · Minor
- Hot days now (above 93°F)
- 7 days/yr
- Hot days in 30 yrs
- 17 days/yr
Wind risk 1/10 · Minimal
- Chance of severe wind over 30 yrs
- 0.0%
Air-quality risk 2/10 · Minimal
- Unhealthy air days now
- 0 days/yr
- Unhealthy air days in 30 yrs
- 1 days/yr
Risk factors via First Street. Map © Google.
Why this score? — see what drove the A- grade
The composite is a weighted blend of 9 inputs, each scored 0–100. Each bar is that input's sub-score; the figure is the points it added to the 100-point composite (weight × sub-score).
- Cash flow +29.0/30.0
- ARV discount +11.6/15.0
- DSCR +10.0/10.0
- Appreciation +10.0/10.0
- 1% rule +9.0/10.0
- Schools +5.0/10.0
- Livability +3.6/5.0
- Rent growth +2.5/5.0
- Condition / age +2.5/5.0
$149,900
🖨 Deal sheet 📄 Offer letter ✓ Due diligence
Listing remarks
Multiple Offers Received. BEST and Highest OFFERS by Sunday by 6 PM on 4/26/2026. Great starter home with 3 bedrooms, Eat in Kitchen, Livingroom and basement has all the walls sheet rocked and ready to be finished by the next owner. Do a family room or sports room or office or what have you. Roof was new in 2018, windows in 2012, hot water tank in 2021 and so much more. Also located in the Onondaga school system! Large 68 x 136 lot and double wide driveway.
Key facts
- 9,248 sq ft lot
- Built 1951
- Listed 7 days
Neighborhood map
What this means for you Summary
Snapshot
- This is a 3-bed/1.0-bath single-family listed at $150k.
Deal economics
- At list price, monthly cash flow is $511 ($6k/yr) — positive.
- The deal already cash-flows at list — no discount required.
- Meets the 1% rule at list price ($2k rent vs $150k).
Location & tenants
- Location reads 71/100 on livability (#415 in NY) — a middle-class / working-renter tenant base. Strengths: cost of living A+, housing A+, health & safety A; Watch: employment C-, schools D, amenities F.
- Onondaga Central School District (rural): math 54% / reading 61% proficiency, ranked #261 of 590 in NY (top 44%) — acceptable for families but not a draw, mixed tenant base, ~2y average lease.
- Market conditions: 67 active listings in the ZIP; 1 comparable units currently listed for rent nearby; 616 units permitted in Onondaga County in 2024 (256 in 5+ unit buildings).
Forward outlook
- In year one you build about $16k of equity ($1k loan paydown + $15k appreciation (10.0% local appreciation)).
- Onondaga County population projected to shrink 9% by 2050 — rents likely to lag national; underwrite the cash flow, not the appreciation.
- At projected returns (10.0% appreciation + 3.0% rent growth), your $42k cash investment doubles in ~2 years — after that, you're playing with house money.
- By year 3, paydown + projected appreciation supports a ~$41k cash-out refi (75% LTV) — recoverable capital for the next deal without selling this one.
Negotiation context
- Only 7 days on market — expect competitive offers; lowballing is unlikely to land.
- Current owner paid $88k; list at $150k implies a 69% gain — meaningful room to come down on a strong offer.
Risks & watch-outs
- Watch-outs: built in 1951 — expect roof / HVAC / electrical / plumbing capex.
Questions for the listing agent
- Built in 1951 — when were the roof, HVAC, electrical panel, plumbing, and water heater last replaced?
- Is there a deadline driving the sale (1031 exchange, divorce, estate, relocation)? That informs how much negotiation room exists.
- Schools are D-rated, which usually means shorter tenancies and higher turnover. Who's the typical renter profile here, and what's been the actual vacancy rate?
- What's the average days-on-market for RENTAL listings here right now (not sales)? A rising rental-DOM trend means longer vacancies and softer asking-rent achievability than the comps imply.
- What's the recent tenant-quality profile in this submarket — average credit score on applications, eviction rate, late-payment / NSF rate, and stable-employment percentage? A property-management company in the area should have these aggregated.
- How much new for-sale + rental construction is in the pipeline within 1–3 miles? Heavy new supply typically softens prices + rents 12–24 months out; constrained supply supports both.
Investment metrics
- 1% rule
- 1.40% ✓
- Cap rate
- 10.38%
- Cash-on-cash
- 14.61%
- DSCR
- 1.65
- GRM
- 5.9
CMA / ARV
- ARV (on-the-fly)
- $164,736
- Comps found
- 12
Show comp detail 12 sales within ~0.75 mi
| Address | Dist | Beds/Ba | Sqft | Sold | Price | $/sf | Match |
|---|---|---|---|---|---|---|---|
| 225 Ruhamah Ave | 0.00mi | 3/1.0 | 1,056 (0%) | 1mo | $152,000 | $144 | 100 |
| 150 Everingham Rd | 0.16mi | 2/1.5 (-1) | 1,080 (+2%) | 5mo | $167,000 | $155 | 78 |
| 302 Everingham Rd | 0.08mi | 3/1.5 | 1,134 (+7%) | 7mo | $225,000 | $198 | 76 |
| 212 Ruhamah Ave | 0.07mi | 3/1.0 | 1,124 (+6%) | 15mo | $209,000 | $186 | 74 |
| 153 Everingham Rd | 0.14mi | 3/2.0 | 1,125 (+6%) | 10mo | $189,900 | $169 | 70 |
| 404 W Roswell Ave | 0.33mi | 3/1.0 | 974 (-8%) | 3mo | $60,000 | $62 | 70 |
| 102 Thompson Rd | 0.45mi | 3/1.5 | 1,032 (-2%) | 9mo | $170,000 | $165 | 66 |
| 106 Everingham Ct | 0.27mi | 3/1.0 | 966 (-8%) | 9mo | $183,000 | $189 | 66 |
| 108 Meredith Ave | 0.54mi | 2/1.0 (-1) | 1,080 (+2%) | 5mo | $157,000 | $145 | 62 |
| 313 Academy Pl | 0.74mi | 4/1.0 (+1) | 1,112 (+5%) | 2mo | $170,000 | $153 | 50 |
| 108 Norman Ave | 0.72mi | 4/1.0 (+1) | 1,112 (+5%) | 6mo | $174,000 | $156 | 48 |
| 219 Longmeadow Dr | 0.60mi | 3/2.0 | 1,200 (+14%) | 11mo | $180,000 | $150 | 36 |
Match score weights: distance 35% · size 25% · config 20% · recency 20%. Top-matched comps best support the ARV.
Projected returns pro-forma
10.0% appreciation · 3.0% rent growth · sell at horizon
- IRR
- 35.1%
- Equity multiple
- 3.72×
- Total profit
- $114,292
- Equity at exit
- $135,042
- IRR
- 30.2%
- Equity multiple
- 8.41×
- Total profit
- $311,173
- Equity at exit
- $291,223
Cash invested: $41,972 (down + closing). Projections, not guarantees.
Landlord ↔ Tenant lean methodology
- Overall (STATE)
- 15 Strongly Tenant-Friendly
- State New York
- 15 Strongly Tenant-Friendly · D+10
- County
- — inherits STATE
- City
- — inherits STATE
ZIP-level market 13205
- Home prices YoY
- 3.0%
- Active inventory
- 67
- Price-to-rent
- 5.9×
Monthly cashflow live
- Estimated rent
- $2,100 medium interval (Pro) →
- Mortgage (P&I)
- −$786
- Tax from tax record
- −$299 /mo · $3,592/yr
- Insurance
- −$62
- HOA
- −$0
- Vacancy / Maint / Mgmt
- −$441
- Net cashflow
- $511
Break-even live
UW: 25.0% down · 7.5% · 30yr · 1.5% tax · 5.0% vac · 8.0% maint · 8.0% mgmt
Financing live
Cash to close
- Down payment
- $37,475
- Closing costs
- $4,497
- Reserves months
- —
- Total cash needed
- —
Loan-product check · same deal, 3 products live
Conventional
25% down · 7.5% · 30yr
- Down + closing
- —
- Monthly P&I
- —
- Monthly cashflow
- —
- DSCR
- —
- Eligible?
- —
Personal DTI + credit; lowest rate.
DSCR
20% down · 8.5% · 30yr
- Down + closing
- —
- Monthly P&I
- —
- Monthly cashflow
- —
- DSCR
- —
- Eligible?
- —
No personal income docs; deal must DSCR.
Hard money
10% down · 12.0% · 12mo
- Down + closing
- —
- Monthly P&I
- —
- Monthly cashflow
- —
- DSCR
- —
- Eligible?
- —
Short-term bridge; refi at stabilization.
Rent comps 1 comps
| Address | Beds | Baths | Sqft | Rent | $/sqft | DOM | Units | Dist |
|---|---|---|---|---|---|---|---|---|
| 154 Seeley Ave Syracuse, NY | 4.0 | 1.0 | 1312 | $2,100 | $1.60 | 14d | 1 | 1.34mi |
Listing history 4 events
-
2026-04-27status Pending
-
2026-04-19$149,900 Active
-
2007-06-20soldstatus $88,500
-
1993-07-22soldstatus $57,500
ⓘ Source: listings_history table (triggers on properties + properties_extension) + one-shot
backfill from property_details.listing_events for pre-trigger history.
Tax reassessment forecast NY · Partial reset (capped growth)
- Current annual tax
- $3,592 · $299/mo
- Projected year-2 tax
- $3,592 · $299/mo
- Expected delta
- $0/yr ($0/mo · 0.0%)
ⓘ Screening estimate from a state-policy table — verify with the county assessor before closing.
Climate risk First Street
- Flood 1/10 Low FEMA zone X (unshaded) · 0% chance over 30 yrs
- Wildfire 1/10 Low
- Heat 3/10 Moderate 7 d/yr ≥93°F today · 17 d/yr by 30 yrs out
- Wind 1/10 Low 0% chance of damaging wind over 30 yrs
- Air quality 2/10 Low 0 unhealthy d/yr today · 1 by 30 yrs out
Nearby sold comps map
Loading sold comps map…
Walkable amenities ~0.75 mi
Loading nearby amenities…
Taxation est. · year 1
- Rental income
- $25,200
- − Mortgage interest
- −$8,397
- − Property taxes
- −$3,592
- − Insurance
- −$750
- − Repairs & maintenance
- −$2,016
- − Management
- −$2,016
- − Depreciation
- −$4,361
- Taxable income
- $4,069
- Est. tax owed @ 24.0%
- −$977
- After-tax cash flow
- $5,157/yr
For passive investors: Depreciation is non-cash, so a rental often shows a tax loss while cash-flowing — sheltering income. Rental losses are passive: they offset passive income freely, and up to $25,000/yr can offset ordinary (W-2) income if you actively participate and your MAGI is under $100k (phasing out to $0 by $150k); unused losses carry forward. On sale, claimed depreciation is recaptured at up to 25%, and gains may owe capital-gains tax (a 1031 exchange can defer both). Figures are a year-1 estimate at your 24.0% rate — not tax advice; consult a CPA.
Schools (NCES district)
- District
- Onondaga Central School District
- NCES district ID
- 3621810
- Math proficiency
- 54% ▼ -5.00%
- Reading proficiency
- 61% ▲ 16.00%
- Median HH income
- $60,148
- Composite
- 49.95/100
- National rank
- #1929
- State rank
- #261 of 590 in NY
Livability — Nedrow
- Score
- 71/100
- State rank
- #415
- US rank
- #7218
Category grades
Schools grade is shown separately in the Schools card above.
Census & demographics
- Census place
- Nedrow, NY
- Population (ZIP)
- 18,562
Population outlook (Onondaga County) Hauer SSP2
- Today (2025)
- 467,894 people
- By 2030
- 463,381 · -1.0%
- By 2040
- 447,697 · -4.3%
- By 2050
- 426,399 · -8.9%
- By 2075
- 373,661 · -20.1%
- By 2100
- 307,967 · -34.2%
Race, ethnicity, and origin ACS 2023
- Neighborhood character
- Diverse neighborhood (Simpson 0.67)
- Race & ethnicity
- Black 44% White 37% Two or more races 10% Hispanic / Latino 6% Asian 3%
- Hispanic origin (detail)
- Puerto Rican 4%
- Common ancestry
- Romanian 2% Italian 2% Swiss 1%
- Foreign-born
- 9% · Canada, China, Vietnam
- Languages at home
- 87% English-only · Spanish 5% Arabic 1% Other Indo-European 1%
Political lean MEDSL · Onondaga
- 2024 margin
- D (+17.3) · D 58.6% · R 41.4%
- 2008→2024 swing
- -3.0pp toward R · 2008: 20.3pp · 2024: 17.3pp
- All cycles
- 2024: D+17.3 2020: D+20.6 2016: D+12.8 2012: D+21.1 2008: D+20.3
Not yet ingested
- Civics
- —
Market trends
- HPI YoY
- ▲ 10.12%
- Current HPI
- 345.8854
- Rent YoY
- —
- Metro
- —
- State GDP YoY
- ▲ 2.60%
- F500 in state
- 92
Industry mix (Fortune 500 HQ in NY)
| Industry | F500 HQs | Revenue |
|---|---|---|
| Financial Services | 10 | $950B |
|
||
| Consumer Goods | 9 | $162B |
|
||
| Insurance | 4 | $225B |
|
||
| Telecommunications | 2 | $144B |
|
||
| Pharmaceuticals | 2 | $112B |
|
||
| Media / Entertainment | 2 | $69B |
|
||
Price history
+160.7% since first listed4 events — show timeline
- 2026-04-27 Pending — CNYIS
- 2026-04-19 Listed $149,900 CNYIS
- 2007-06-20 Sold (Public Records) $88,500 Public Records
- 1993-07-22 Sold (Public Records) $57,500 Public Records
Property tax history
+3.5%/yrLatest (2025): $3,592 · +1.7% YoY. Source: county tax records.
Cash-flow waterfall
monthlySold comps — $/sqft
last 12 mo · ≤1 miLoading sold comps…