 🏗️ New Construction
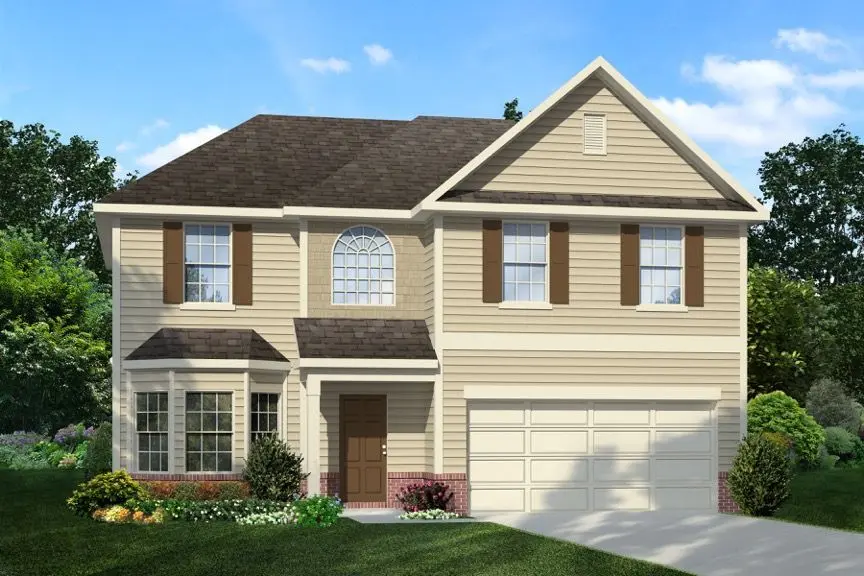
Chatman Plan · Walthourville, GA
Flood risk No data
- FEMA flood zone
- —
- Chance of flooding over 30 yrs
- —
- Est. flood insurance / yr
- —
Fire risk No data
- Est. fire insurance / yr
- —
Heat risk No data
- Hot days now (above threshold)
- —
- Hot days in 30 yrs
- —
Wind risk No data
- Chance of severe wind over 30 yrs
- —
Air-quality risk No data
- Unhealthy air days now
- —
- Unhealthy air days in 30 yrs
- —
Risk factors via First Street. Map © Google.
Why this score? — see what drove the D grade
The composite is a weighted blend of 9 inputs, each scored 0–100. Each bar is that input's sub-score; the figure is the points it added to the 100-point composite (weight × sub-score).
- Cash flow +11.2/30.0
- ARV discount +7.5/15.0
- Appreciation +5.1/10.0
- Condition / age +4.8/5.0
- 1% rule +3.4/10.0
- DSCR +3.3/10.0
- Livability +3.2/5.0
- Rent growth +2.5/5.0
- Schools +2.3/10.0
$285,900
🖨 Deal sheet (PDF) 📄 Offer letter ✓ Due diligence
Listing remarks MLS
The Chatman home is a standout in our collection, known for its popularity and functionality. This home boasts practical features such as an oversized pantry and a nearby storage closet for cleaning supplies. The galley kitchen seamlessly connects to the breakfast area and great room, which includes an electric fireplace. The adjoining dining room is perfect for hosting gatherings, complemented by an elegant bay window that adds a classic touch to the space. Upstairs, three additional bedrooms share a full bath and linen closet. The generous master suite features a vaulted ceiling, a cozy sitting nook, his & hers closets, a double vanity, and a garden tub. Relax in the spacious backyard, ideal for grilling or spending time with pets after a long day. Artistic renderings are for visual representation only. Actual floor plans, features, and inclusions may vary.
Key facts
- Vaulted ceiling
- Electric fireplace
- Oversized pantry
Tags
Neighborhood map
What this means for you Summary
Snapshot
- This is a 4-bed/2.5-bath single-family listed at $286k. Condition is rated excellent.
Deal economics
- At list price, monthly cash flow is $-111 ($-1k/yr) — negative.
- To cash-flow at today's rent, offer at most $278k (2.8% below list).
- To meet the 1% rule (rent ≥ 1% of price), the offer needs to be $247k (13.7% below list).
- Recommended offer: $247k (13.7% below list) — sets the bar for 1% rule.
Location & tenants
- Location reads 64/100 on livability (#255 in GA) — a middle-class / working-renter tenant base. Strengths: cost of living A+, housing A+, crime B; Watch: employment D, amenities F, commute F.
- Long County (rural): math 26% / reading 26% proficiency, ranked #115 of 174 in GA (top 66%) — low school quality limits family demand, transient renter base, plan for 1-2y turnover; 61% free/reduced lunch — lower-income household profile, screen leases tightly.
- Zoned schools: Smiley Elementary School (1,258 students, 67% FRL); Long County Middle School (math 21% / reading 27%, grade F, #311 of 470 statewide, top 68%, 945 students, 69% FRL); Long County High School (math 37% / reading 22%, grade F, #140 of 424 statewide, top 35%, 1,209 students, 70% FRL).
- Market conditions: 141 active listings in the ZIP; 2 comparable units currently listed for rent nearby; 298 units permitted in Long County in 2024 (0 in 5+ unit buildings).
- At $2,469/mo this rent would consume 45% of the median local household income ($65k/yr) (locally 121% of renters already pay >50% of income on rent) — very limited rent-growth headroom before tenants either downsize or default.
Forward outlook
- In year one you build about $2k of equity ($2k loan paydown + $457 appreciation (0.2% local appreciation)).
- Long County population projected at +72% by 2050 — long-run rental-demand tailwind backs the buy-and-hold thesis.
- By year 10, paydown + projected appreciation supports a ~$33k cash-out refi (75% LTV) — recoverable capital for the next deal without selling this one.
Negotiation context
- It's been on market 809 days — a 12% lower offer ($252k) is reasonable based on typical stale-listing flexibility.
Questions for the listing agent
- What do current leases actually rent for vs. the listed asking? Can we see a recent rent roll and the last 12 months of T-12 income?
- It's been on market 809 days. Have you received any prior offers? Is the seller open to a 14% concession, seller financing, or rate buy-down credit?
- What does the HOA fee cover, when was the last increase, and are there any pending special assessments or reserve-fund shortfalls?
- Why hasn't it sold? Are there any deal-killer items the seller is aware of (foundation, flood, title, zoning, code violations)?
- Is there a deadline driving the sale (1031 exchange, divorce, estate, relocation)? That informs how much negotiation room exists.
- Schools are F-rated, which usually means shorter tenancies and higher turnover. Who's the typical renter profile here, and what's been the actual vacancy rate?
- The area grade is low — what's the realistic commute time and amenity access for the typical tenant pool here? Any planned neighborhood developments (good or bad) we should know about?
- What's the average days-on-market for RENTAL listings here right now (not sales)? A rising rental-DOM trend means longer vacancies and softer asking-rent achievability than the comps imply.
- What's the recent tenant-quality profile in this submarket — average credit score on applications, eviction rate, late-payment / NSF rate, and stable-employment percentage? A property-management company in the area should have these aggregated.
- How much new for-sale + rental construction is in the pipeline within 1–3 miles? Heavy new supply typically softens prices + rents 12–24 months out; constrained supply supports both.
Investment metrics
- 1% rule
- 0.84% ✗
- Cap rate
- 5.84%
- Cash-on-cash
- -1.61%
- DSCR
- 0.93
- GRM
- 9.9
CMA / ARV
- ARV (median comp)
- $293,864
- List price
- $285,900
- Delta
- -2.71%
- Verdict
- FAIR
- Comps
- 20 within 1.0 mi
Show comp detail 12 sales within ~0.75 mi
| Address | Dist | Beds/Ba | Sqft | Sold | Price | $/sf | Match |
|---|---|---|---|---|---|---|---|
| 9979 Tibet Highway Hwy SE | 0.00mi | 4/2.0 | 1,926 (-4%) | 21mo | $296,975 | $154 | 74 |
| 9879 Tibet Highway Hwy SE | 0.00mi | 4/2.0 | 1,926 (-4%) | 21mo | $298,000 | $155 | 74 |
| 10033 Tibet Highway Hwy SE | 0.00mi | 4/2.0 | 1,926 (-4%) | 21mo | $297,925 | $155 | 74 |
| 10033 Tibet Hwy SE | 0.21mi | 4/2.0 | 1,926 (-4%) | 21mo | $297,925 | $155 | 64 |
| 9523 Tibet Highway Hwy SE | 0.00mi | 4/2.5 | 2,254 (+13%) | 19mo | $314,975 | $140 | 63 |
| 9979 Tibet Hwy SE | 0.26mi | 4/2.0 | 1,926 (-4%) | 21mo | $296,975 | $154 | 62 |
| 9829 Tibet Highway Hwy SE | 0.00mi | 4/2.5 | 2,254 (+13%) | 21mo | $309,475 | $137 | 62 |
| 9879 Tibet Hwy SE | 0.36mi | 4/2.0 | 1,926 (-4%) | 21mo | $298,000 | $155 | 57 |
| 9931 Tibet Highway Hwy SE | 0.00mi | 5/3.0 (+1) | 2,256 (+13%) | 21mo | $314,280 | $139 | 54 |
| 9829 Tibet Hwy SE | 0.41mi | 4/2.5 | 2,254 (+13%) | 21mo | $309,475 | $137 | 42 |
| 9931 Tibet Hwy SE | 0.30mi | 5/3.0 (+1) | 2,256 (+13%) | 21mo | $314,280 | $139 | 40 |
| 9523 Tibet Hwy SE | 0.70mi | 4/2.5 | 2,254 (+13%) | 19mo | $314,975 | $140 | 31 |
Match score weights: distance 35% · size 25% · config 20% · recency 20%. Top-matched comps best support the ARV.
Projected returns pro-forma
0.16% appreciation · 3.0% rent growth · sell at horizon
- IRR
- -3.4%
- Equity multiple
- 0.84×
- Total profit
- $-13,435
- Equity at exit
- $87,619
- IRR
- 2.3%
- Equity multiple
- 1.25×
- Total profit
- $20,453
- Equity at exit
- $107,168
Cash invested: $82,282 (down + closing). Projections, not guarantees.
Landlord ↔ Tenant lean methodology
- Overall (STATE)
- 90 Strongly Landlord-Friendly
- State Georgia
- 90 Strongly Landlord-Friendly · R+3
- County
- — inherits STATE
- City
- — inherits STATE
ZIP-level market 31301
- Home prices YoY
- 0.1%
- Active inventory
- 141
- Price-to-rent
- 9.7×
Monthly cashflow live
- Estimated rent
- $2,469 medium interval (Pro) →
- Mortgage (P&I)
- −$1,541
- Tax est. 1.5%
- −$367 /mo · $4,408/yr
- Insurance
- −$122
- HOA
- −$30
- Vacancy / Maint / Mgmt
- −$518
- Net cashflow
- $-111
Break-even live
Sensitivity live
| Price | -10% $92 | -5% $-9 | +0% $-111 | +5% $-212 | +10% $-314 |
|---|---|---|---|---|---|
| Rent | -10% $-306 | -5% $-208 | +0% $-111 | +5% $-13 | +10% $84 |
| Rate | -1.0pp $37 | -0.5pp $-36 | base $-111 | +0.5pp $-187 | +1.0pp $-264 |
UW: 25.0% down · 7.5% · 30yr · 1.5% tax · 5.0% vac · 8.0% maint · 8.0% mgmt
Financing live
Cash to close
- Down payment
- $73,466
- Closing costs
- $8,816
- Reserves months
- —
- Total cash needed
- —
Loan-product check · same deal, 3 products live
Conventional
25% down · 7.5% · 30yr
- Down + closing
- —
- Monthly P&I
- —
- Monthly cashflow
- —
- DSCR
- —
- Eligible?
- —
Personal DTI + credit; lowest rate.
DSCR
20% down · 8.5% · 30yr
- Down + closing
- —
- Monthly P&I
- —
- Monthly cashflow
- —
- DSCR
- —
- Eligible?
- —
No personal income docs; deal must DSCR.
Hard money
10% down · 12.0% · 12mo
- Down + closing
- —
- Monthly P&I
- —
- Monthly cashflow
- —
- DSCR
- —
- Eligible?
- —
Short-term bridge; refi at stabilization.
Rent comps 2 comps
| Address | Beds | Baths | Sqft | Rent | $/sqft | DOM | Units | Dist |
|---|---|---|---|---|---|---|---|---|
| 9635 Tibet Hwy SE Allenhurst, GA | 5.0 | 3.5 | 2400 | $2,600 | $1.08 | 45d | 1 | 0.59mi |
| 43 Sandy Run Rd SE Allenhurst, GA | 4.0 | 2.0 | 1450 | $1,800 | $1.24 | 45d | 1 | 0.66mi |
HOA detail
- Monthly dues
- $30 · $360/yr
- Likely covers
- electric
Listing history 20 events
-
2026-06-21days on market $285,900 Active 809 DOM
-
2026-06-19days on market $285,900 Active 807 DOM
-
2026-06-18days on market $285,900 Active 806 DOM
-
2026-06-17days on market $285,900 Active 805 DOM
-
2026-06-16days on market $285,900 Active 804 DOM
-
2026-06-15days on market $285,900 Active 803 DOM
-
2026-06-14days on market $285,900 Active 801 DOM
-
2026-06-13days on market $285,900 Active 800 DOM
-
2026-06-10days on market $285,900 Active 798 DOM
-
2026-06-09days on market $285,900 Active 797 DOM
-
2026-06-08days on market $285,900 Active 796 DOM
-
2026-06-07days on market $285,900 Active 795 DOM
-
2026-06-05days on market $285,900 Active 792 DOM
-
2026-06-03days on market $285,900 Active 791 DOM
-
2026-06-02days on market $285,900 Active 790 DOM
-
2026-06-01days on market $285,900 Active 789 DOM
-
2026-05-31days on market $285,900 Active 788 DOM
-
2026-05-30days on market $285,900 Active 787 DOM
-
2025-03-07price $285,900 877-char remark
Show marketing remark (877 chars)
The Chatman home is a standout in our collection, known for its popularity and functionality. This home boasts practical features such as an oversized pantry and a nearby storage closet for cleaning supplies. The galley kitchen seamlessly connects to the breakfast area and great room, which includes an electric fireplace. The adjoining dining room is perfect for hosting gatherings, complemented by an elegant bay window that adds a classic touch to the space. Upstairs, three additional bedrooms share a full bath and linen closet. The generous master suite features a vaulted ceiling, a cozy sitting nook, his & hers closets, a double vanity, and a garden tub. Relax in the spacious backyard, ideal for grilling or spending time with pets after a long day. Artistic renderings are for visual representation only. Actual floor plans, features, and inclusions may vary.
-
2024-04-03$272,900 Active 877-char remark
Show marketing remark (877 chars)
The Chatman home is a standout in our collection, known for its popularity and functionality. This home boasts practical features such as an oversized pantry and a nearby storage closet for cleaning supplies. The galley kitchen seamlessly connects to the breakfast area and great room, which includes an electric fireplace. The adjoining dining room is perfect for hosting gatherings, complemented by an elegant bay window that adds a classic touch to the space. Upstairs, three additional bedrooms share a full bath and linen closet. The generous master suite features a vaulted ceiling, a cozy sitting nook, his & hers closets, a double vanity, and a garden tub. Relax in the spacious backyard, ideal for grilling or spending time with pets after a long day. Artistic renderings are for visual representation only. Actual floor plans, features, and inclusions may vary.
ⓘ Source: listings_history table (triggers on properties + properties_extension) + one-shot
backfill from property_details.listing_events for pre-trigger history.
Nearby sold comps map
Loading sold comps map…
Walkable amenities ~0.75 mi
Loading nearby amenities…
Taxation est. · year 1
- Rental income
- $29,623
- − Mortgage interest
- −$16,461
- − Property taxes
- −$4,408
- − Insurance
- −$1,469
- − Repairs & maintenance
- −$2,370
- − Management
- −$2,370
- − HOA
- −$360
- − Depreciation
- −$8,549
- Taxable loss
- −$6,364
- Est. tax savings @ 24.0%
- +$1,527
- After-tax cash flow
- $200/yr
For passive investors: Depreciation is non-cash, so a rental often shows a tax loss while cash-flowing — sheltering income. Rental losses are passive: they offset passive income freely, and up to $25,000/yr can offset ordinary (W-2) income if you actively participate and your MAGI is under $100k (phasing out to $0 by $150k); unused losses carry forward. On sale, claimed depreciation is recaptured at up to 25%, and gains may owe capital-gains tax (a 1031 exchange can defer both). Figures are a year-1 estimate at your 24.0% rate — not tax advice; consult a CPA.
Condition & rehab AI · 12 photos
This home is in excellent condition with no visible repairs needed. It offers a great opportunity for a potential buyer or investor looking for a move-in-ready property with high resale and rental value.
Value-add opportunities
- Both Painting exterior and interior walls — Enhances curb appeal and interior aesthetics
- Both Landscaping and curb appeal improvements — Improves curb appeal and enhances property value
- Both Add a smart home system — Enhances home's marketability and adds value
Renovation cost estimate screening
Value-add ROI direction
- Both Painting exterior and interior walls — Enhances curb appeal and interior aesthetics ↑
- Both Landscaping and curb appeal improvements — Improves curb appeal and enhances property value ↑
- Both Add a smart home system — Enhances home's marketability and adds value ↑
ⓘ Cost ranges are severity-bucket heuristics (US national rule-of-thumb). Get contractor quotes + a written scope before underwriting a rehab budget.
Schools (NCES district)
- District
- Long County
- NCES district ID
- 1303360
- Math proficiency
- 26% ▼ -14.00%
- Reading proficiency
- 26% ▼ -13.00%
- Median HH income
- $45,958
- Composite
- 22.51/100
- National rank
- #8090
- State rank
- #115 of 174 in GA
Livability — Walthourville
- Score
- 64/100
- State rank
- #255
- US rank
- #14108
Category grades
Schools grade is shown separately in the Schools card above.
Census & demographics
- County
- Liberty County · 58,565 people
- City population
- 4,933
- Metro
- Hinesville, GA
- Population (ZIP)
- 4,933
- Household income
- $65,417
- Rent vs Own
- Severe rent burden
- 121.0
Population outlook (Long County) Hauer SSP2
- Today (2025)
- 24,669 people
- By 2030
- 28,223 · +14.4%
- By 2040
- 35,430 · +43.6%
- By 2050
- 42,403 · +71.9%
- By 2075
- 56,996 · +131.0%
- By 2100
- 64,185 · +160.2%
Race, ethnicity, and origin ACS 2023
- Neighborhood character
- Diverse neighborhood (Simpson 0.64)
- Race & ethnicity
- Black 51% White 31% Two or more races 15% Hispanic / Latino 9%
- Hispanic origin (detail)
- Mexican 2% Puerto Rican 7%
- Common ancestry
- Slovak 1% Lithuanian 1%
- Foreign-born
- 3% · Canada
- Languages at home
- 96% English-only · Spanish 2%
Political lean MEDSL · Long
- 2024 margin
- Strong R (+29.5) · D 35.1% · R 64.6%
- 2008→2024 swing
- -5.4pp toward R · 2008: -24.1pp · 2024: -29.5pp
- All cycles
- 2024: R+29.5 2020: R+26.4 2016: R+30.8 2012: R+22.9 2008: R+24.1
Not yet ingested
- Civics
- —
Market trends
- HPI YoY
- ▲ 0.16%
- Current HPI
- 187.7716
- Rent YoY
- —
- Metro
- Hinesville, GA
- State GDP YoY
- ▲ 2.66%
- F500 in state
- 28
Industry mix (Fortune 500 HQ in GA)
| Industry | F500 HQs | Revenue |
|---|---|---|
| Paper / Packaging | 2 | $29B |
|
||
| Retail | 1 | $160B |
|
||
| Transportation / Logistics | 1 | $91B |
|
||
| Airlines | 1 | $62B |
|
||
| Consumer Goods | 1 | $47B |
|
||
| Utilities | 1 | $25B |
|
||
Price history
+4.8% since first listed2 events — show timeline
- 2025-03-07 Price Changed $285,900 Zillow
- 2024-04-03 Listed $272,900 Zillow
Cash-flow waterfall
monthlySold comps — $/sqft
last 12 mo · ≤1 miLoading sold comps…