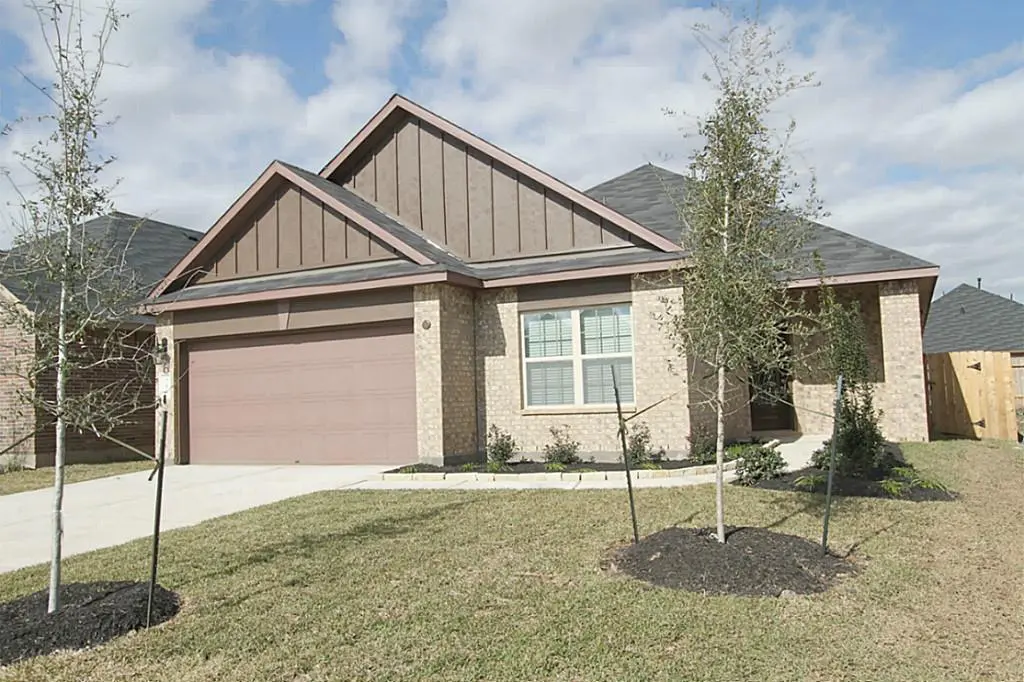
722 Mill Spring Ct · Rosenberg, TX
Flood risk 1/10 · Minimal
- FEMA flood zone
- X (unshaded)
- Chance of flooding over 30 yrs
- 0.0%
- Est. flood insurance / yr
- $507 – $1,088
Fire risk 1/10 · Minimal
- Est. fire insurance / yr
- $1,222 – $2,270
Heat risk 9/10 · Severe
- Hot days now (above 110°F)
- 7 days/yr
- Hot days in 30 yrs
- 24 days/yr
Wind risk 9/10 · Severe
- Chance of severe wind over 30 yrs
- 99.0%
Air-quality risk 2/10 · Minimal
- Unhealthy air days now
- 1 days/yr
- Unhealthy air days in 30 yrs
- 1 days/yr
Risk factors via First Street. Map © Google.
Why this score? — see what drove the D+ grade
The composite is a weighted blend of 9 inputs, each scored 0–100. Each bar is that input's sub-score; the figure is the points it added to the 100-point composite (weight × sub-score).
- Cash flow +15.9/30.0
- ARV discount +9.6/15.0
- 1% rule +5.5/10.0
- DSCR +4.9/10.0
- Schools +4.6/10.0
- Livability +3.1/5.0
- Condition / age +2.5/5.0
- Rent growth +2.0/5.0
- Appreciation +0.0/10.0
$315,000
🖨 Deal sheet 📄 Offer letter ✓ Due diligence
Listing remarks MLS
A spacious one story brick home. Open and spacious. Split bedrooms. Granite kitchen countertop. Tile in living areas. carpet in 4 bdrm. 2''blinds. Lead glass front door. Garage door opener. Gas range. large back yard.
Key facts
- Tile in living areas
- Large back yard
- Gas range
Tags
Neighborhood map
What this means for you Summary
Snapshot
- This is a 4-bed/2.0-bath single-family listed at $315k.
Deal economics
- At list price, monthly cash flow is $148 ($2k/yr) — positive.
- The deal already cash-flows at list — no discount required.
- Meets the 1% rule at list price ($3k rent vs $315k).
- Recommended offer: $287k (9.0% below list) — sets the bar for market timing.
- Cap rate 6.9% vs local median 3.4% in Rosenberg — top-decile yield for the area; either an underpriced asset or a hidden risk that comps aren't pricing in. Stress-test before assuming the spread holds.
Location & tenants
- Location reads 62/100 on livability (#922 in TX) — a middle-class / working-renter tenant base. Strengths: cost of living A+, housing A+, crime B; Watch: schools D-, amenities F, commute F.
- Lamar CISD (suburban): math 50% / reading 53% proficiency, ranked #116 of 826 in TX (top 14%) — acceptable for families but not a draw, mixed tenant base, ~2y average lease.
- Market conditions: Rents soft (-1.8%/yr); 1332 active listings in the ZIP; 2 comparable units currently listed for rent nearby; solid renter incomes; 12,093 units permitted in Fort Bend County in 2024 (815 in 5+ unit buildings).
- This rent runs 39% of the median local income ($102k/yr) — at the standard rent-burdened threshold; future hikes will face affordability resistance.
Forward outlook
- Local home prices are declining (-3.0%/yr); year-one equity from $2k of loan paydown is wiped out by about $9k of value loss. Plan a longer hold.
- Fort Bend County population projected at +75% by 2050 — long-run rental-demand tailwind backs the buy-and-hold thesis.
Negotiation context
- It's been on market 100 days — a 9% lower offer ($287k) is reasonable based on typical stale-listing flexibility.
Risks & watch-outs
- Climate carrying-cost: severe wind risk, 99% chance of damaging wind over 30y; extreme-heat days projected 7→24/yr by 2055 (HVAC capex compounding) — expect insurance premiums to compound above CPI over the hold.
Questions for the listing agent
- It's been on market 100 days. Have you received any prior offers? Is the seller open to a 9% concession, seller financing, or rate buy-down credit?
- What does the HOA fee cover, when was the last increase, and are there any pending special assessments or reserve-fund shortfalls?
- Why hasn't it sold? Are there any deal-killer items the seller is aware of (foundation, flood, title, zoning, code violations)?
- Is there a deadline driving the sale (1031 exchange, divorce, estate, relocation)? That informs how much negotiation room exists.
- Schools are D-rated, which usually means shorter tenancies and higher turnover. Who's the typical renter profile here, and what's been the actual vacancy rate?
- The area grade is low — what's the realistic commute time and amenity access for the typical tenant pool here? Any planned neighborhood developments (good or bad) we should know about?
- What's the average days-on-market for RENTAL listings here right now (not sales)? A rising rental-DOM trend means longer vacancies and softer asking-rent achievability than the comps imply.
- What's the recent tenant-quality profile in this submarket — average credit score on applications, eviction rate, late-payment / NSF rate, and stable-employment percentage? A property-management company in the area should have these aggregated.
- How much new for-sale + rental construction is in the pipeline within 1–3 miles? Heavy new supply typically softens prices + rents 12–24 months out; constrained supply supports both.
Investment metrics
- 1% rule
- 1.05% ✓
- Cap rate
- 6.86%
- Cash-on-cash
- 2.02%
- DSCR
- 1.09
- GRM
- 7.9
CMA / ARV
- ARV (median comp)
- $330,551
- List price
- $315,000
- Delta
- -4.70%
- Verdict
- FAIR
- Comps
- 20 within 1.0 mi
Show comp detail 12 sales within ~0.75 mi
| Address | Dist | Beds/Ba | Sqft | Sold | Price | $/sf | Match |
|---|---|---|---|---|---|---|---|
| 9202 Sorrell Hollow Ln | 0.31mi | 4/2.0 | 2,216 (+8%) | 8mo | $330,000 | $149 | 66 |
| 9210 Hemlock Dr | 0.60mi | 4/2.0 | 2,140 (+4%) | 2mo | $369,999 | $173 | 64 |
| 107 Angel Hollow Ln | 0.66mi | 3/2.0 (-1) | 2,050 (-0%) | 3mo | $345,000 | $168 | 61 |
| 831 Shenandoah Falls Ln | 0.62mi | 3/2.0 (-1) | 2,113 (+3%) | 3mo | $320,000 | $151 | 59 |
| 1203 Fill House Ct | 0.44mi | 4/2.0 | 1,840 (-10%) | 4mo | $364,000 | $198 | 59 |
| 523 Bonbrook Ln | 0.67mi | 4/2.0 | 2,131 (+4%) | 8mo | $329,990 | $155 | 56 |
| 8710 Snyder Farm Ln | 0.71mi | 4/2.0 | 2,131 (+4%) | 6mo | $349,000 | $164 | 55 |
| 8707 Rocky Knoll Ln | 0.57mi | 3/2.0 (-1) | 2,280 (+11%) | 2mo | $335,000 | $147 | 48 |
| 8715 Gladiolus Dr | 0.74mi | 4/2.0 | 2,210 (+8%) | 6mo | $369,900 | $167 | 47 |
| 410 N Iris Rose Ct | 0.57mi | 3/2.0 (-1) | 1,804 (-12%) | 3mo | $325,000 | $180 | 46 |
| 9207 Gilbert Hollow Dr | 0.63mi | 3/2.0 (-1) | 1,826 (-11%) | 2mo | $330,000 | $181 | 46 |
| 9007 Hemlock Dr | 0.69mi | 3/2.0 (-1) | 1,844 (-10%) | 6mo | $315,000 | $171 | 41 |
Match score weights: distance 35% · size 25% · config 20% · recency 20%. Top-matched comps best support the ARV.
Projected returns pro-forma
-3.0% appreciation · 0.0% rent growth · sell at horizon
- IRR
- -16.9%
- Equity multiple
- 0.42×
- Total profit
- $-51,075
- Equity at exit
- $46,968
- IRR
- -16.6%
- Equity multiple
- 0.22×
- Total profit
- $-68,897
- Equity at exit
- $27,235
Cash invested: $88,200 (down + closing). Projections, not guarantees.
Landlord ↔ Tenant lean methodology
- Overall (STATE)
- 87 Strongly Landlord-Friendly
- State Texas
- 87 Strongly Landlord-Friendly · R+5
- County
- — inherits STATE
- City
- — inherits STATE
ZIP-level market 77469
- Home prices YoY
- -25.1%
- Rents YoY
- -1.8%
- Active inventory
- 1332
- Price-to-rent
- 7.9×
Monthly cashflow live
- Estimated rent
- $3,313 medium interval (Pro) →
- Mortgage (P&I)
- −$1,652
- Tax from tax record
- −$616 /mo · $7,398/yr
- Insurance
- −$131
- HOA
- −$69
- Vacancy / Maint / Mgmt
- −$696
- Net cashflow
- $148
Break-even live
UW: 25.0% down · 7.5% · 30yr · 1.5% tax · 5.0% vac · 8.0% maint · 8.0% mgmt
Financing live
Cash to close
- Down payment
- $78,750
- Closing costs
- $9,450
- Reserves months
- —
- Total cash needed
- —
Loan-product check · same deal, 3 products live
Conventional
25% down · 7.5% · 30yr
- Down + closing
- —
- Monthly P&I
- —
- Monthly cashflow
- —
- DSCR
- —
- Eligible?
- —
Personal DTI + credit; lowest rate.
DSCR
20% down · 8.5% · 30yr
- Down + closing
- —
- Monthly P&I
- —
- Monthly cashflow
- —
- DSCR
- —
- Eligible?
- —
No personal income docs; deal must DSCR.
Hard money
10% down · 12.0% · 12mo
- Down + closing
- —
- Monthly P&I
- —
- Monthly cashflow
- —
- DSCR
- —
- Eligible?
- —
Short-term bridge; refi at stabilization.
Rent comps 2 comps
| Address | Beds | Baths | Sqft | Rent | $/sqft | DOM | Units | Dist |
|---|---|---|---|---|---|---|---|---|
| 615 Arbor Green Ln Rosenberg, TX | 4.0 | 3.0 | 2564 | $3,800 | $1.48 | 44d | 1 | 0.45mi |
| 2302 Grande Laurel Ct Richmond, TX | 4.0 | 3.5 | 2832 | $2,975 | $1.05 | 19d | 1 | 1.35mi |
HOA detail
- Monthly dues
- $69 · $828/yr
- Likely covers
- gas
Listing history 14 events
-
2026-06-18days on market $315,000 Active 100 DOM
-
2026-06-17days on market $315,000 Active 99 DOM
-
2026-06-16days on market $315,000 Active 98 DOM
-
2026-06-15days on market $315,000 Active 97 DOM
-
2026-06-13days on market $315,000 Active 95 DOM
-
2026-06-10days on market $315,000 Active 91 DOM
-
2026-06-08days on market $315,000 Active 90 DOM
-
2026-06-07days on market $315,000 Active 89 DOM
-
2026-06-04days on market $315,000 Active 86 DOM
-
2026-06-03days on market $315,000 Active 85 DOM
-
2026-06-02days on market $315,000 Active 84 DOM
-
2026-06-01days on market $315,000 Active 83 DOM
-
2026-05-31days on market $315,000 Active 82 DOM
-
2026-03-10$315,000 Active 217-char remark
Show marketing remark (217 chars)
A spacious one story brick home. Open and spacious. Split bedrooms. Granite kitchen countertop. Tile in living areas. carpet in 4 bdrm. 2''blinds. Lead glass front door. Garage door opener. Gas range. large back yard.
ⓘ Source: listings_history table (triggers on properties + properties_extension) + one-shot
backfill from property_details.listing_events for pre-trigger history.
Tax reassessment forecast TX · Resets to sale price
- Current annual tax
- $7,398 · $616/mo
- Projected year-2 tax
- $7,398 · $616/mo
- Expected delta
- $0/yr ($0/mo · 0.0%)
ⓘ Screening estimate from a state-policy table — verify with the county assessor before closing.
Climate risk First Street
- Flood 1/10 Low FEMA zone X (unshaded) · 0% chance over 30 yrs
- Wildfire 1/10 Low
- Heat 9/10 Extreme 7 d/yr ≥110°F today · 24 d/yr by 30 yrs out
- Wind 9/10 Extreme 99% chance of damaging wind over 30 yrs
- Air quality 2/10 Low 1 unhealthy d/yr today · 1 by 30 yrs out
Nearby sold comps map
Loading sold comps map…
Walkable amenities ~0.75 mi
Loading nearby amenities…
Taxation est. · year 1
- Rental income
- $39,751
- − Mortgage interest
- −$17,645
- − Property taxes
- −$7,398
- − Insurance
- −$1,575
- − Repairs & maintenance
- −$3,180
- − Management
- −$3,180
- − HOA
- −$828
- − Depreciation
- −$9,164
- Taxable loss
- −$3,218
- Est. tax savings @ 24.0%
- +$772
- After-tax cash flow
- $2,552/yr
For passive investors: Depreciation is non-cash, so a rental often shows a tax loss while cash-flowing — sheltering income. Rental losses are passive: they offset passive income freely, and up to $25,000/yr can offset ordinary (W-2) income if you actively participate and your MAGI is under $100k (phasing out to $0 by $150k); unused losses carry forward. On sale, claimed depreciation is recaptured at up to 25%, and gains may owe capital-gains tax (a 1031 exchange can defer both). Figures are a year-1 estimate at your 24.0% rate — not tax advice; consult a CPA.
Schools (NCES district)
- District
- Lamar CISD
- NCES district ID
- 4826580
- Math proficiency
- 50% ▼ -12.00%
- Reading proficiency
- 53% ▼ -4.00%
- Median HH income
- $75,213
- Composite
- 46.43/100
- National rank
- #2452
- State rank
- #116 of 826 in TX
Livability — Rosenberg
- Score
- 62/100
- State rank
- #922
- US rank
- #16414
Category grades
Schools grade is shown separately in the Schools card above.
Census & demographics
- County
- Fort Bend County · 836,777 people
- City population
- 115,151
- Metro
- Houston-The Woodlands-Sugar Land, TX
- Population (ZIP)
- 69,826
- Household income
- $102,125
- Rent vs Own
- Severe rent burden
- 1292.0
Population outlook (Fort Bend County) Hauer SSP2
- Today (2025)
- 1,004,526 people
- By 2030
- 1,153,104 · +14.8%
- By 2040
- 1,453,718 · +44.7%
- By 2050
- 1,753,781 · +74.6%
- By 2075
- 2,455,772 · +144.5%
- By 2100
- 2,930,528 · +191.7%
Race, ethnicity, and origin ACS 2023
- Neighborhood character
- Highly diverse neighborhood (Simpson 0.76)
- Race & ethnicity
- Hispanic / Latino 29% White 27% Black 25% Two or more races 15% Asian 15%
- Hispanic origin (detail)
- Mexican 21%
- Common ancestry
- Romanian 1% Lithuanian 1%
- Foreign-born
- 24% · Canada, Vietnam, China
- Languages at home
- 65% English-only · Spanish 17% Other Indo-European 7% Other Asian/Pacific 2%
Political lean MEDSL · Fort Bend
- 2024 margin
- Toss-up / Even · D 49.5% · R 47.9% · Other 2.6%
- 2008→2024 swing
- +4.0pp toward D · 2008: -2.4pp · 2024: 1.6pp
- All cycles
- 2024: D+1.6 2020: D+10.6 2016: D+6.6 2012: R+6.8 2008: R+2.4
Not yet ingested
- Civics
- —
Market trends
- HPI YoY
- ▼ -78.66%
- Current HPI
- 234.9892
- Rent YoY
- ▼ -1.81%
- Metro
- Houston-The Woodlands-Sugar Land, TX
- State GDP YoY
- ▲ 3.95%
- F500 in state
- 110
Industry mix (Fortune 500 HQ in TX)
| Industry | F500 HQs | Revenue |
|---|---|---|
| Energy | 16 | $1,198B |
|
||
| Technology | 5 | $198B |
|
||
| Engineering / Construction | 4 | $72B |
|
||
| Energy Services | 3 | $60B |
|
||
| Utilities | 3 | $41B |
|
||
| Healthcare | 2 | $330B |
|
||
Price history
1 event — show timeline
- 2026-03-10 Listed $315,000 HARMLS
Property tax history
+48.2%/yrLatest (2025): $7,398 · -0.7% YoY. Source: county tax records.
Cash-flow waterfall
monthlySold comps — $/sqft
last 12 mo · ≤1 miLoading sold comps…