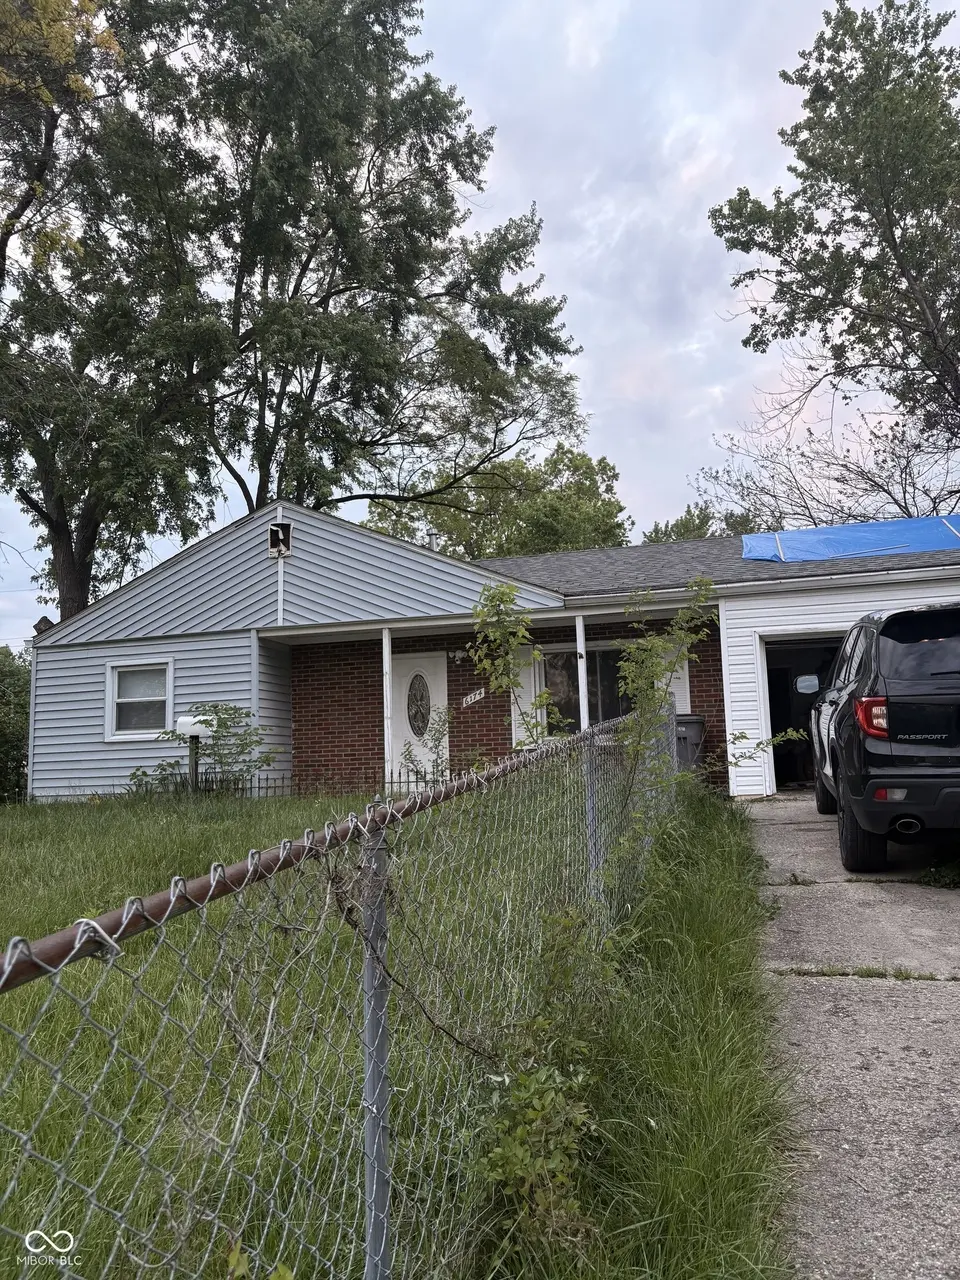
6174 Raleigh Dr · Indianapolis city (balance), IN
Flood risk 1/10 · Minimal
- FEMA flood zone
- X (unshaded)
- Chance of flooding over 30 yrs
- 0.0%
- Est. flood insurance / yr
- $507 – $1,088
Fire risk 1/10 · Minimal
- Est. fire insurance / yr
- $717 – $1,331
Heat risk 3/10 · Minor
- Hot days now (above 101°F)
- 7 days/yr
- Hot days in 30 yrs
- 17 days/yr
Wind risk 2/10 · Minimal
- Chance of severe wind over 30 yrs
- 1.0%
Air-quality risk 4/10 · Minor
- Unhealthy air days now
- 5 days/yr
- Unhealthy air days in 30 yrs
- 7 days/yr
Risk factors via First Street. Map © Google.
Why this score? — see what drove the B grade
The composite is a weighted blend of 9 inputs, each scored 0–100. Each bar is that input's sub-score; the figure is the points it added to the 100-point composite (weight × sub-score).
- Cash flow +30.0/30.0
- ARV discount +15.0/15.0
- 1% rule +10.0/10.0
- DSCR +10.0/10.0
- Rent growth +3.2/5.0
- Livability +2.5/5.0
- Condition / age +2.5/5.0
- Schools +1.4/10.0
- Appreciation +0.0/10.0
$64,900
🖨 Deal sheet 📄 Offer letter ✓ Due diligence
Listing remarks MLS
This house has had a major fire and is being sold "as is'. Great opportunity for a fixer upper. This home sold in 2024 as a total renovation.All appliances are "as is" Cash only offers.
Key facts
- 7,187 sq ft lot
- Garage
- Built 1948
Neighborhood map
What this means for you Summary
Snapshot
- This is a 2-bed/1.0-bath single-family listed at $65k.
Deal economics
- At list price, monthly cash flow is $336 ($4k/yr) — positive.
- The deal already cash-flows at list — no discount required.
- Meets the 1% rule at list price ($1k rent vs $65k).
- Cap rate 12.5% vs local median 4.4% in Indianapolis city (balance) — top-decile yield for the area; either an underpriced asset or a hidden risk that comps aren't pricing in. Stress-test before assuming the spread holds.
Location & tenants
- Location reads: area grade B — affects rentability + tenant quality, not the cash-flow math above.
- Indianapolis Public Schools (urban): math 14% / reading 20% proficiency, ranked #286 of 301 in IN (top 95%) — low school quality limits family demand, transient renter base, plan for 1-2y turnover; 77% free/reduced lunch — lower-income household profile, screen leases tightly.
- Market conditions: Rents rising (+2.6%/yr); 140 active listings in the ZIP; 33 comparable units currently listed for rent nearby; rentals at typical pace (median 24d on market — plan ~3-4 weeks tenant-placement turnaround); 1,906 units permitted in Marion County in 2024 (621 in 5+ unit buildings).
Forward outlook
- Local home prices are declining (-3.0%/yr); year-one equity from $449 of loan paydown is wiped out by about $2k of value loss. Plan a longer hold.
- Marion County population projected at +18% by 2050 — long-run rental-demand tailwind backs the buy-and-hold thesis.
- At projected returns (-3.0% appreciation + 2.6% rent growth), your $18k cash investment doubles in ~6 years — after that, you're playing with house money.
Negotiation context
- Only 6 days on market — expect competitive offers; lowballing is unlikely to land.
- 10 sale attempts since 19y ago with the ask held roughly flat each time — persistent listings suggest the price (not the market) is what's stuck; bring a comps-based counter.
Risks & watch-outs
- Watch-outs: built in 1948 — expect roof / HVAC / electrical / plumbing capex.
Questions for the listing agent
- Built in 1948 — when were the roof, HVAC, electrical panel, plumbing, and water heater last replaced?
- Is there a deadline driving the sale (1031 exchange, divorce, estate, relocation)? That informs how much negotiation room exists.
- What's the average days-on-market for RENTAL listings here right now (not sales)? A rising rental-DOM trend means longer vacancies and softer asking-rent achievability than the comps imply.
- What's the recent tenant-quality profile in this submarket — average credit score on applications, eviction rate, late-payment / NSF rate, and stable-employment percentage? A property-management company in the area should have these aggregated.
- How much new for-sale + rental construction is in the pipeline within 1–3 miles? Heavy new supply typically softens prices + rents 12–24 months out; constrained supply supports both.
Investment metrics
- 1% rule
- 1.58% ✓
- Cap rate
- 12.51%
- Cash-on-cash
- 22.19%
- DSCR
- 1.99
- GRM
- 5.3
CMA / ARV
- ARV (median comp)
- $114,596
- List price
- $64,900
- Delta
- -43.37%
- Verdict
- UNDERPRICED
- Comps
- 20 within 1.0 mi
Show comp detail 8 sales within ~0.75 mi
| Address | Dist | Beds/Ba | Sqft | Sold | Price | $/sf | Match |
|---|---|---|---|---|---|---|---|
| 6174 Raleigh Dr | 0.00mi | 3/1.0 (+1) | 1,149 (0%) | 1mo | $50,000 | $44 | 94 |
| 6231 E 25th St | 0.10mi | 3/2.0 (+1) | 1,152 (+0%) | 3mo | $150,000 | $130 | 83 |
| 6120 E 24th St | 0.14mi | 3/1.0 (+1) | 1,176 (+2%) | 10mo | $80,000 | $68 | 76 |
| 6250 E 25th St | 0.14mi | 3/1.0 (+1) | 1,212 (+6%) | 22mo | $131,500 | $108 | 61 |
| 2225 N Arlington Ave | 0.35mi | 3/1.0 (+1) | 1,220 (+6%) | 19mo | $129,000 | $106 | 52 |
| 5603 E 22nd St | 0.70mi | 2/1.0 | 1,016 (-12%) | 2mo | $170,000 | $167 | 47 |
| 2260 N Graham Ave | 0.57mi | 3/1.0 (+1) | 1,280 (+11%) | 10mo | $115,000 | $90 | 41 |
| 2331 N Graham Ave | 0.51mi | 3/2.0 (+1) | 1,248 (+9%) | 23mo | $230,000 | $184 | 34 |
Match score weights: distance 35% · size 25% · config 20% · recency 20%. Top-matched comps best support the ARV.
Projected returns pro-forma
-3.0% appreciation · 2.63% rent growth · sell at horizon
- IRR
- 14.5%
- Equity multiple
- 1.58×
- Total profit
- $10,541
- Equity at exit
- $9,677
- IRR
- 23.0%
- Equity multiple
- 2.94×
- Total profit
- $35,320
- Equity at exit
- $5,611
Cash invested: $18,172 (down + closing). Projections, not guarantees.
Landlord ↔ Tenant lean methodology
- Overall (STATE)
- 90 Strongly Landlord-Friendly
- State Indiana
- 90 Strongly Landlord-Friendly · R+11
- County
- — inherits STATE
- City
- — inherits STATE
ZIP-level market 46219
- Rents YoY
- 2.6%
- Active inventory
- 140
- Price-to-rent
- 5.3×
Monthly cashflow live
- Estimated rent
- $1,026 high interval (Pro) →
- Mortgage (P&I)
- −$340
- Tax from tax record
- −$107 /mo · $1,285/yr
- Insurance
- −$27
- HOA
- −$0
- Vacancy / Maint / Mgmt
- −$215
- Net cashflow
- $336
Break-even live
UW: 25.0% down · 7.5% · 30yr · 1.5% tax · 5.0% vac · 8.0% maint · 8.0% mgmt
Financing live
Cash to close
- Down payment
- $16,225
- Closing costs
- $1,947
- Reserves months
- —
- Total cash needed
- —
Loan-product check · same deal, 3 products live
Conventional
25% down · 7.5% · 30yr
- Down + closing
- —
- Monthly P&I
- —
- Monthly cashflow
- —
- DSCR
- —
- Eligible?
- —
Personal DTI + credit; lowest rate.
DSCR
20% down · 8.5% · 30yr
- Down + closing
- —
- Monthly P&I
- —
- Monthly cashflow
- —
- DSCR
- —
- Eligible?
- —
No personal income docs; deal must DSCR.
Hard money
10% down · 12.0% · 12mo
- Down + closing
- —
- Monthly P&I
- —
- Monthly cashflow
- —
- DSCR
- —
- Eligible?
- —
Short-term bridge; refi at stabilization.
Rent comps 33 comps
| Address | Beds | Baths | Sqft | Rent | $/sqft | DOM | Units | Dist |
|---|---|---|---|---|---|---|---|---|
| 6267 E 24th St Indianapolis, IN | 3.0 | 1.0 | 981 | $1,195 | $1.22 | 1d | 1 | 0.20mi |
| 2226 N Kenyon St Indianapolis, IN | 2.0 | 1.0 | 816 | $850 | $1.04 | 23d | 1 | 0.31mi |
| 6154 Commodore Dr Indianapolis, IN | 2.0 | 1.0 | 900 | $950 | $1.06 | 23d | 1 | 0.32mi |
| 6136 Nimitz Dr Indianapolis, IN | 2.0 | 1.0 | 864 | $799 | $0.92 | 20d | 1 | 0.33mi |
| 6120 Nimitz Dr Indianapolis, IN | 2.0 | 1.0 | 864 | $750 | $0.87 | 43d | 1 | 0.34mi |
| 6149 Commodore Dr Indianapolis, IN | 2.0 | 1.0 | 816 | $850 | $1.04 | 23d | 1 | 0.35mi |
| 5923 E 24th St Indianapolis, IN | 2.0 | 1.0 | 816 | $950 | $1.16 | 17d | 1 | 0.36mi |
| 6119 Nimitz Dr Indianapolis, IN | 3.0 | 1.0 | 816 | $850 | $1.04 | 23d | 1 | 0.37mi |
| 2419 N Bolton Ave Indianapolis, IN | 2.0 | 1.0 | 768 | $950 | $1.24 | 7d | 1 | 0.38mi |
| 6046 E 21st St Indianapolis, IN | 1.0–2.0 | 1.0 | 792 | $865 | $1.09 | 22d | 11 | 0.39mi |
| 2404 N Lesley Ave Indianapolis, IN | 2.0 | 1.0 | 763 | $850 | $1.11 | 43d | 1 | 0.63mi |
| 2304 N Ritter Ave Apt 9 Indianapolis, IN | 2.0 | 1.0 | 725 | $799 | $1.10 | 20d | 1 | 0.80mi |
| 2308 N Ritter Ave Apt 24 Indianapolis, IN | 2.0 | 1.0 | 725 | $825 | $1.14 | 20d | 1 | 0.80mi |
| 2302 N Ritter Ave Indianapolis, IN | 2.0 | 1.0 | 725 | $788 | $1.09 | 7d | 2 | 0.82mi |
| 2312 N Ritter Ave Apt 31 Indianapolis, IN | 2.0 | 1.0 | 725 | $825 | $1.14 | 22d | 1 | 0.84mi |
| 2703 Kristen Dr E Indianapolis, IN | 3.0 | 1.0 | 1155 | $1,700 | $1.47 | 43d | 1 | 0.88mi |
| 3070 N Layman Ave #1 Indianapolis, IN | 3.0 | 2.0 | 1480 | $1,700 | $1.15 | 43d | 1 | 0.97mi |
| 1424 N Campbell Ave Unit 1424 Indianapolis, IN | 1.0 | 1.0 | 750 | $905 | $1.21 | 23d | 1 | 1.09mi |
| 1424 N Campbell Ave Unit 1446 Indianapolis, IN | 1.0 | 1.0 | 800 | $920 | $1.15 | 23d | 1 | 1.09mi |
| 5322 E 19th Pl Indianapolis, IN | 2.0 | 1.0 | 720 | $945 | $1.31 | 43d | 1 | 1.13mi |
| 5242 E 20th Pl Indianapolis, IN | 2.0 | 1.0 | 720 | $1,050 | $1.46 | 7d | 1 | 1.15mi |
| 1742 N Whittier Pl Indianapolis, IN | 2.0 | 1.0 | 1440 | $995 | $0.69 | 10d | 1 | 1.15mi |
| 1702 N Ritter Ave Indianapolis, IN | 2.0 | 1.0 | 750 | $1,200 | $1.60 | 4d | 1 | 1.18mi |
| 1366 N Arlington Ave Indianapolis, IN | 2.0 | 1.0–1.5 | 885 | $1,074 | $1.21 | 3d | 10 | 1.18mi |
| 1213 Taylor Dr E Indianapolis, IN | 2.0 | 1.0 | 853 | $1,045 | $1.23 | 14d | 1 | 1.26mi |
| 5130 E 21st St Indianapolis, IN | 3.0 | 2.0 | 1188 | $1,500 | $1.26 | 23d | 1 | 1.27mi |
| 5130 E 21st St Indianapolis, IN | 3.0 | 2.0 | 1188 | $1,500 | $1.26 | 43d | 1 | 1.27mi |
| 5119 E 21st St Indianapolis, IN | 2.0 | 1.0 | 816 | $1,199 | $1.47 | 43d | 1 | 1.29mi |
| 3319 N Hawthorne Ln Indianapolis, IN | 3.0 | 1.0 | 1084 | $1,100 | $1.01 | 23d | 1 | 1.36mi |
| 6214 Eastridge Dr Indianapolis, IN | 2.0 | 1.0 | 798 | $1,000 | $1.25 | 43d | 1 | 1.37mi |
| 2194 N Riley Ave Indianapolis, IN | 3.0 | 1.0 | 1100 | $1,749 | $1.59 | 43d | 1 | 1.42mi |
| 6203 E 11th St Indianapolis, IN | 2.0 | 1.0 | 880 | $1,025 | $1.16 | 23d | 1 | 1.43mi |
| 3301 Mardenna Ave Indianapolis, IN | 3.0 | 1.0 | 925 | $1,200 | $1.30 | 43d | 1 | 1.48mi |
Listing history 28 events
-
2026-05-04status Pending 200-char remark
Show marketing remark (200 chars)
This house has had a major fire and is being sold "as is'. Great opportunity for a fixer upper. This home sold in 2024 as a total renovation.All appliances are "as is" Cash only offers.
-
2026-05-01status Active 200-char remark
Show marketing remark (200 chars)
This house has had a major fire and is being sold "as is'. Great opportunity for a fixer upper. This home sold in 2024 as a total renovation.All appliances are "as is" Cash only offers.
-
2026-04-02status Pending 200-char remark
Show marketing remark (200 chars)
This house has had a major fire and is being sold "as is'. Great opportunity for a fixer upper. This home sold in 2024 as a total renovation.All appliances are "as is" Cash only offers.
-
2026-04-02status Active 200-char remark
Show marketing remark (200 chars)
This house has had a major fire and is being sold "as is'. Great opportunity for a fixer upper. This home sold in 2024 as a total renovation.All appliances are "as is" Cash only offers.
-
2026-03-31status Pending 200-char remark
Show marketing remark (200 chars)
This house has had a major fire and is being sold "as is'. Great opportunity for a fixer upper. This home sold in 2024 as a total renovation.All appliances are "as is" Cash only offers.
-
2026-03-29$64,900 Active 200-char remark
Show marketing remark (200 chars)
This house has had a major fire and is being sold "as is'. Great opportunity for a fixer upper. This home sold in 2024 as a total renovation.All appliances are "as is" Cash only offers.
-
2024-11-15soldstatus $154,900 Closed 669-char remark
Show marketing remark (669 chars)
Welcome to your new home at 6174 Raleigh Drive in the heart of Indianapolis! This cozy 3-bedroom, 1-bathroom house has all the modern touches you'll love. Inside, you'll find fresh new carpet and a beautifully remodeled bathroom. The kitchen comes ready with an electric oven and refrigerator, making meal prep a breeze. Stay comfy year-round with central AC and forced air heating. Plus, there's plenty of space with a driveway and garage for your parking needs. A brand-new furnace was installed in June, so you're all set for efficient heating. This place is perfect for anyone looking for a relaxed and inviting spot to call home. Don't miss out on making it yours!
-
2024-11-12status Pending 669-char remark
Show marketing remark (669 chars)
Welcome to your new home at 6174 Raleigh Drive in the heart of Indianapolis! This cozy 3-bedroom, 1-bathroom house has all the modern touches you'll love. Inside, you'll find fresh new carpet and a beautifully remodeled bathroom. The kitchen comes ready with an electric oven and refrigerator, making meal prep a breeze. Stay comfy year-round with central AC and forced air heating. Plus, there's plenty of space with a driveway and garage for your parking needs. A brand-new furnace was installed in June, so you're all set for efficient heating. This place is perfect for anyone looking for a relaxed and inviting spot to call home. Don't miss out on making it yours!
-
2024-10-18$154,900 Active 669-char remark
Show marketing remark (669 chars)
Welcome to your new home at 6174 Raleigh Drive in the heart of Indianapolis! This cozy 3-bedroom, 1-bathroom house has all the modern touches you'll love. Inside, you'll find fresh new carpet and a beautifully remodeled bathroom. The kitchen comes ready with an electric oven and refrigerator, making meal prep a breeze. Stay comfy year-round with central AC and forced air heating. Plus, there's plenty of space with a driveway and garage for your parking needs. A brand-new furnace was installed in June, so you're all set for efficient heating. This place is perfect for anyone looking for a relaxed and inviting spot to call home. Don't miss out on making it yours!
-
2022-05-22price $1,050
-
2021-05-05soldstatus $68,750 Closed
-
2021-04-20status Pending
-
2021-04-16$80,000 Active
-
2019-07-31soldstatus $45,000 Sold
-
2019-07-02$51,500 Active
-
2019-07-02status Pending
-
2018-09-13soldstatus $34,000 Sold
-
2018-08-13status Pending
-
2018-08-07price $40,900
-
2018-06-08price $41,900
-
2018-06-01$45,900 Active
-
2010-03-18historical
-
2010-03-18soldstatus $18,100
-
2010-01-04$19,900
-
2008-03-19soldstatus $70,000
-
2007-08-23$80,000
-
2007-07-06soldstatus $25,000
-
2007-04-20$28,000
ⓘ Source: listings_history table (triggers on properties + properties_extension) + one-shot
backfill from property_details.listing_events for pre-trigger history.
Tax reassessment forecast IN · Partial reset (capped growth)
- Current annual tax
- $1,285 · $107/mo
- Projected year-2 tax
- $1,285 · $107/mo
- Expected delta
- $0/yr ($0/mo · 0.0%)
ⓘ Screening estimate from a state-policy table — verify with the county assessor before closing.
Climate risk First Street
- Flood 1/10 Low FEMA zone X (unshaded) · 0% chance over 30 yrs
- Wildfire 1/10 Low
- Heat 3/10 Moderate 7 d/yr ≥101°F today · 17 d/yr by 30 yrs out
- Wind 2/10 Low 100% chance of damaging wind over 30 yrs
- Air quality 4/10 Moderate 5 unhealthy d/yr today · 7 by 30 yrs out
Nearby sold comps map
Loading sold comps map…
Walkable amenities ~0.75 mi
Loading nearby amenities…
Taxation est. · year 1
- Rental income
- $12,313
- − Mortgage interest
- −$3,635
- − Property taxes
- −$1,285
- − Insurance
- −$324
- − Repairs & maintenance
- −$985
- − Management
- −$985
- − Depreciation
- −$1,888
- Taxable income
- $3,210
- Est. tax owed @ 24.0%
- −$770
- After-tax cash flow
- $3,263/yr
For passive investors: Depreciation is non-cash, so a rental often shows a tax loss while cash-flowing — sheltering income. Rental losses are passive: they offset passive income freely, and up to $25,000/yr can offset ordinary (W-2) income if you actively participate and your MAGI is under $100k (phasing out to $0 by $150k); unused losses carry forward. On sale, claimed depreciation is recaptured at up to 25%, and gains may owe capital-gains tax (a 1031 exchange can defer both). Figures are a year-1 estimate at your 24.0% rate — not tax advice; consult a CPA.
Schools (NCES district)
- District
- Indianapolis Public Schools
- NCES district ID
- 1804770
- Math proficiency
- 14% ▼ -7.00%
- Reading proficiency
- 20% ▼ -3.00%
- Median HH income
- $32,034
- Composite
- 13.69/100
- National rank
- #9499
- State rank
- #286 of 301 in IN
Livability — Indianapolis city (balance)
No livability data for this city. (Only ~50 U.S. cities are tracked.)
Census & demographics
- Census place
- Indianapolis city (balance), IN
- County
- Marion County · 998,460 people
- City population
- 881,119
- Metro
- Indianapolis-Carmel-Anderson, IN
- Population (ZIP)
- 38,855
- Household income
- $60,803
- Rent vs Own
- Severe rent burden
- 2191.0
Population outlook (Marion County) Hauer SSP2
- Today (2025)
- 1,025,572 people
- By 2030
- 1,065,727 · +3.9%
- By 2040
- 1,141,577 · +11.3%
- By 2050
- 1,208,920 · +17.9%
- By 2075
- 1,367,288 · +33.3%
- By 2100
- 1,438,201 · +40.2%
Race, ethnicity, and origin ACS 2023
- Neighborhood character
- Diverse neighborhood (Simpson 0.63)
- Race & ethnicity
- White 54% Black 22% Hispanic / Latino 18% Two or more races 9%
- Hispanic origin (detail)
- Mexican 10% Puerto Rican 1%
- Common ancestry
- Slovak 2% Romanian 2% Lithuanian 2%
- Foreign-born
- 10% · Canada
- Languages at home
- 85% English-only · Spanish 14%
Political lean MEDSL · Marion
- 2024 margin
- Strong D (+27.7) · D 63.0% · R 35.3% · Other 1.7%
- 2008→2024 swing
- -0.7pp no change · 2008: 28.4pp · 2024: 27.7pp
- All cycles
- 2024: D+27.7 2020: D+29.1 2016: D+22.8 2012: D+22.2 2008: D+28.4
Not yet ingested
- Civics
- —
Market trends
- HPI YoY
- ▼ -199.69%
- Current HPI
- 289.8788
- Rent YoY
- ▲ 2.63%
- Metro
- Indianapolis-Carmel-Anderson, IN
- State GDP YoY
- ▲ 2.90%
- F500 in state
- 18
Industry mix (Fortune 500 HQ in IN)
| Industry | F500 HQs | Revenue |
|---|---|---|
| Industrial Machinery | 2 | $37B |
|
||
| Healthcare | 1 | $177B |
|
||
| Pharmaceuticals | 1 | $45B |
|
||
| Metals / Steel | 1 | $18B |
|
||
| Agriculture | 1 | $17B |
|
||
| Packaging | 1 | $12B |
|
||
Price history
+131.8% since first listed28 events — show timeline
- 2026-05-04 Pending — MIBOR as Distributed by MLS Grid
- 2026-05-01 Relisted — MIBOR as Distributed by MLS Grid
- 2026-04-02 Pending — MIBOR as Distributed by MLS Grid
- 2026-04-02 Relisted — MIBOR as Distributed by MLS Grid
- 2026-03-31 Pending — MIBOR as Distributed by MLS Grid
- 2026-03-29 Listed $64,900 MIBOR as Distributed by MLS Grid
- 2024-11-15 Sold (MLS) $154,900 MIBOR as Distributed by MLS Grid
- 2024-11-12 Pending — MIBOR as Distributed by MLS Grid
- 2024-10-18 Listed $154,900 MIBOR as Distributed by MLS Grid
- 2022-05-22 Price Changed $1,050 RENT.
- 2021-05-05 Sold (MLS) $68,750 MIBOR as Distributed by MLS Grid
- 2021-04-20 Pending — MIBOR as Distributed by MLS Grid
- 2021-04-16 Listed $80,000 MIBOR as Distributed by MLS Grid
- 2019-07-31 Sold (MLS) $45,000 MIBOR as Distributed by MLS Grid
- 2019-07-02 Listed $51,500 MIBOR as Distributed by MLS Grid
- 2019-07-02 Pending — MIBOR as Distributed by MLS Grid
- 2018-09-13 Sold (MLS) $34,000 MIBOR as Distributed by MLS Grid
- 2018-08-13 Pending — MIBOR as Distributed by MLS Grid
- 2018-08-07 Price Changed $40,900 MIBOR as Distributed by MLS Grid
- 2018-06-08 Price Changed $41,900 MIBOR as Distributed by MLS Grid
- 2018-06-01 Listed $45,900 MIBOR as Distributed by MLS Grid
- 2010-03-18 Listing Removed — MIBOR as Distributed by MLS Grid
- 2010-03-18 Sold (MLS) $18,100 MIBOR as Distributed by MLS Grid
- 2010-01-04 Listed $19,900 MIBOR as Distributed by MLS Grid
- 2008-03-19 Sold (MLS) $70,000 MIBOR as Distributed by MLS Grid
- 2007-08-23 Listed $80,000 MIBOR as Distributed by MLS Grid
- 2007-07-06 Sold (MLS) $25,000 MIBOR as Distributed by MLS Grid
- 2007-04-20 Listed $28,000 MIBOR as Distributed by MLS Grid
Property tax history
+1.1%/yrLatest (2025): $1,285 · +166.2% YoY. Source: county tax records.
Cash-flow waterfall
monthlySold comps — $/sqft
last 12 mo · ≤1 miLoading sold comps…