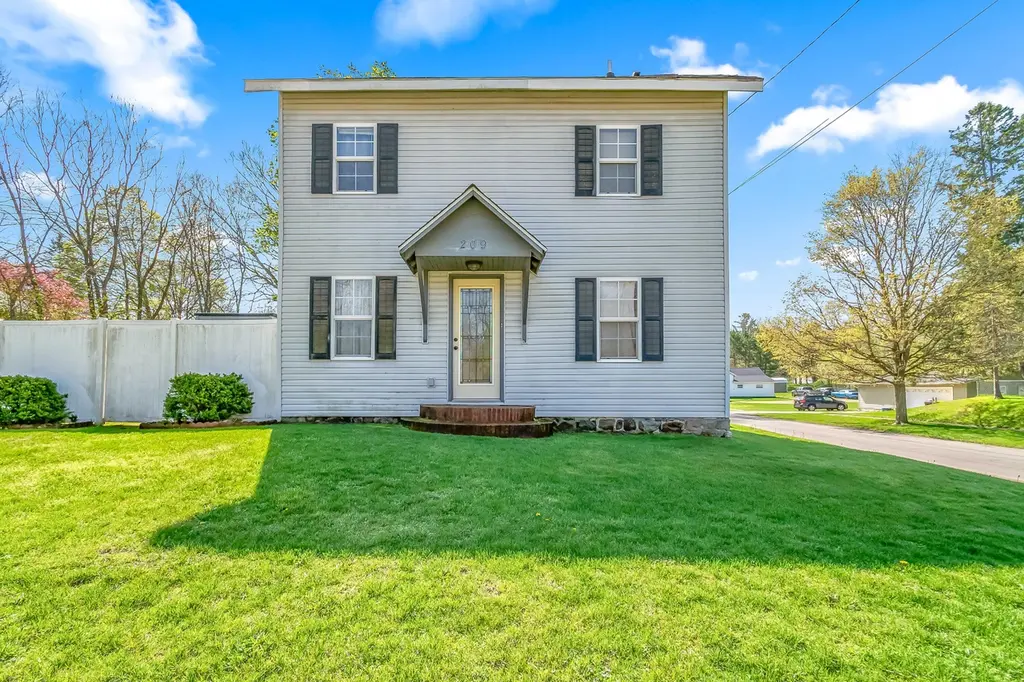
209 Saint Joseph St · Union City, MI
Flood risk 1/10 · Minimal
- FEMA flood zone
- X (unshaded)
- Chance of flooding over 30 yrs
- 0.0%
- Est. flood insurance / yr
- $473 – $860
Fire risk 1/10 · Minimal
- Est. fire insurance / yr
- $784 – $1,456
Heat risk 2/10 · Minimal
- Hot days now (above 98°F)
- 7 days/yr
- Hot days in 30 yrs
- 16 days/yr
Wind risk 2/10 · Minimal
- Chance of severe wind over 30 yrs
- —
Air-quality risk 2/10 · Minimal
- Unhealthy air days now
- 1 days/yr
- Unhealthy air days in 30 yrs
- 2 days/yr
Risk factors via First Street. Map © Google.
Why this score? — see what drove the D+ grade
The composite is a weighted blend of 9 inputs, each scored 0–100. Each bar is that input's sub-score; the figure is the points it added to the 100-point composite (weight × sub-score).
- Cash flow +22.9/30.0
- DSCR +7.4/10.0
- 1% rule +5.1/10.0
- Livability +3.5/5.0
- Schools +2.6/10.0
- Rent growth +2.5/5.0
- Condition / age +2.5/5.0
- ARV discount +0.0/15.0
- Appreciation +0.0/10.0
$190,000
🖨 Deal sheet 📄 Offer letter ✓ Due diligence
Listing remarks MLS
Welcome to this thoughtfully updated 3-bedroom, 2-bathroom home located in the heart of Union City. Offering a functional layout and move-in ready appeal, this home features main-floor laundry, a convenient mudroom, and tasteful updates throughout. The cozy covered back porch provides a great space for relaxing or entertaining, while the walkable location offers easy access to local schools, parks, downtown amenities, and everyday conveniences. Nearby outdoor recreation includes fishing, kayaking, boating, and walking trails around Union Lake and Riverview Park. Whether you're a first-time buyer, looking for more space, or searching for a home with small-town charm, this property offers comfort, convenience, and a great location.
Key facts
- Outdoor recreation
- Convenient mudroom
- Main-floor laundry
Tags
Property features AI
Exterior
- Utilities: Public water; Natural gas available and connected; Electricity available; Cable connected
- Home design: Traditional style single-family residence; Residential property
- Construction: Built in 1900; Vinyl siding; Shingle roof
- Exterior features: Corner lot; Paved road access
Interior
- Kitchen: Dishwasher; Microwave; Oven; Refrigerator
- Bedrooms: Primary bedroom; Bedroom 2; Bedroom 3
- Bathrooms: 2 full bathrooms; Primary bathroom
- Heating & cooling: Forced air heating; Has heating; Has cooling
- Interior features: Replacement windows; 8 total rooms; Michigan basement
- Laundry & utility: Washer; Dryer; Laundry room
Neighborhood map
What this means for you Summary
Snapshot
- This is a 3-bed/1.0-bath single-family listed at $190k.
Deal economics
- At list price, monthly cash flow is $335 ($4k/yr) — positive.
- The deal already cash-flows at list — no discount required.
- Meets the 1% rule at list price ($2k rent vs $190k).
Location & tenants
- Location reads 69/100 on livability (#339 in MI) — a middle-class / working-renter tenant base. Strengths: cost of living A+, housing A+, crime A-; Watch: amenities F, commute F, employment F.
- Union City Community Schools (rural): math 22% / reading 39% proficiency, ranked #354 of 540 in MI (top 66%) — families likely to look elsewhere, expect single-tenant / working-renter base with shorter leases.
- Market conditions: 33 active listings in the ZIP; 43 units permitted in Branch County in 2024 (0 in 5+ unit buildings).
Forward outlook
- Local home prices are declining (-3.0%/yr); year-one equity from $1k of loan paydown is wiped out by about $6k of value loss. Plan a longer hold.
- Branch County population projected at -18% by 2050 — secular population decline; favor cash flow + early exit over multi-decade hold.
Negotiation context
- Only 10 days on market — expect competitive offers; lowballing is unlikely to land.
- 23 sale attempts since 24y ago with the ask held roughly flat each time — persistent listings suggest the price (not the market) is what's stuck; bring a comps-based counter.
- Current owner paid $91k; list at $190k implies a 109% gain — meaningful room to come down on a strong offer.
Risks & watch-outs
- Watch-outs: built in 1900 — expect roof / HVAC / electrical / plumbing capex.
Questions for the listing agent
- Built in 1900 — when were the roof, HVAC, electrical panel, plumbing, and water heater last replaced?
- Is there a deadline driving the sale (1031 exchange, divorce, estate, relocation)? That informs how much negotiation room exists.
- The area grade is low — what's the realistic commute time and amenity access for the typical tenant pool here? Any planned neighborhood developments (good or bad) we should know about?
- What's the average days-on-market for RENTAL listings here right now (not sales)? A rising rental-DOM trend means longer vacancies and softer asking-rent achievability than the comps imply.
- What's the recent tenant-quality profile in this submarket — average credit score on applications, eviction rate, late-payment / NSF rate, and stable-employment percentage? A property-management company in the area should have these aggregated.
- How much new for-sale + rental construction is in the pipeline within 1–3 miles? Heavy new supply typically softens prices + rents 12–24 months out; constrained supply supports both.
Investment metrics
- 1% rule
- 1.01% ✓
- Cap rate
- 8.41%
- Cash-on-cash
- 7.56%
- DSCR
- 1.34
- GRM
- 8.3
CMA / ARV
- ARV (on-the-fly)
- $160,020
- Comps found
- 12
Show comp detail 12 sales within ~0.75 mi
| Address | Dist | Beds/Ba | Sqft | Sold | Price | $/sf | Match |
|---|---|---|---|---|---|---|---|
| 322 St Joseph St | 0.15mi | 3/1.0 | 1,350 (+7%) | 7mo | $145,000 | $107 | 75 |
| 520 S Broadway St | 0.43mi | 3/1.0 | 1,300 (+3%) | 2mo | $125,001 | $96 | 73 |
| 340 Woodruff St | 0.23mi | 2/1.0 (-1) | 1,140 (-10%) | 2mo | $140,000 | $123 | 67 |
| 321 E Fenton St | 0.18mi | 4/1.0 (+1) | 1,420 (+13%) | 1mo | $180,000 | $127 | 65 |
| 204 Crane St | 0.20mi | 3/1.5 | 1,110 (-12%) | 5mo | $191,000 | $172 | 65 |
| 434 Ann St | 0.41mi | 3/2.0 | 1,356 (+8%) | 2mo | $175,000 | $129 | 62 |
| 312 Lee St | 0.21mi | 2/1.0 (-1) | 1,178 (-6%) | 16mo | $134,000 | $114 | 61 |
| 636 Walnut Ln | 0.70mi | 3/1.5 | 1,250 (-1%) | 15mo | $223,000 | $178 | 51 |
| 421 Summit St | 0.48mi | 2/1.0 (-1) | 1,100 (-13%) | 1mo | $174,900 | $159 | 51 |
| 402 Division St | 0.55mi | 2/1.0 (-1) | 1,356 (+8%) | 10mo | $164,000 | $121 | 48 |
| 203 Barry St | 0.53mi | 3/1.0 | 1,350 (+7%) | 21mo | $140,000 | $104 | 46 |
| 609 Thomas St | 0.63mi | 4/1.0 (+1) | 1,300 (+3%) | 24mo | $183,000 | $141 | 41 |
Match score weights: distance 35% · size 25% · config 20% · recency 20%. Top-matched comps best support the ARV.
Projected returns pro-forma
-3.0% appreciation · 3.0% rent growth · sell at horizon
- IRR
- -4.8%
- Equity multiple
- 0.82×
- Total profit
- $-9,491
- Equity at exit
- $28,330
- IRR
- 4.9%
- Equity multiple
- 1.36×
- Total profit
- $19,001
- Equity at exit
- $16,428
Cash invested: $53,200 (down + closing). Projections, not guarantees.
Landlord ↔ Tenant lean methodology
- Overall (STATE)
- 62 Landlord-Friendly
- State Michigan
- 62 Landlord-Friendly · EVEN
- County
- — inherits STATE
- City
- — inherits STATE
ZIP-level market 49094
- Home prices YoY
- -28.8%
- Active inventory
- 33
- Price-to-rent
- 8.3×
Monthly cashflow live
- Estimated rent
- $1,910 medium interval (Pro) →
- Mortgage (P&I)
- −$996
- Tax from tax record
- −$98 /mo · $1,175/yr
- Insurance
- −$79
- HOA
- −$0
- Vacancy / Maint / Mgmt
- −$401
- Net cashflow
- $335
Break-even live
UW: 25.0% down · 7.5% · 30yr · 1.5% tax · 5.0% vac · 8.0% maint · 8.0% mgmt
Financing live
Cash to close
- Down payment
- $47,500
- Closing costs
- $5,700
- Reserves months
- —
- Total cash needed
- —
Loan-product check · same deal, 3 products live
Conventional
25% down · 7.5% · 30yr
- Down + closing
- —
- Monthly P&I
- —
- Monthly cashflow
- —
- DSCR
- —
- Eligible?
- —
Personal DTI + credit; lowest rate.
DSCR
20% down · 8.5% · 30yr
- Down + closing
- —
- Monthly P&I
- —
- Monthly cashflow
- —
- DSCR
- —
- Eligible?
- —
No personal income docs; deal must DSCR.
Hard money
10% down · 12.0% · 12mo
- Down + closing
- —
- Monthly P&I
- —
- Monthly cashflow
- —
- DSCR
- —
- Eligible?
- —
Short-term bridge; refi at stabilization.
Listing history 50 events
-
2026-05-31status $190,000 Pending 10 DOM
-
2026-05-31days on market $190,000 Active 10 DOM
-
2026-05-31days on market $190,000 Active 9 DOM
-
2026-05-21$190,000 Active 739-char remark
Show marketing remark (739 chars)
Welcome to this thoughtfully updated 3-bedroom, 2-bathroom home located in the heart of Union City. Offering a functional layout and move-in ready appeal, this home features main-floor laundry, a convenient mudroom, and tasteful updates throughout. The cozy covered back porch provides a great space for relaxing or entertaining, while the walkable location offers easy access to local schools, parks, downtown amenities, and everyday conveniences. Nearby outdoor recreation includes fishing, kayaking, boating, and walking trails around Union Lake and Riverview Park. Whether you're a first-time buyer, looking for more space, or searching for a home with small-town charm, this property offers comfort, convenience, and a great location.
-
2026-05-21$190,000 Active
Show marketing remark (739 chars)
Welcome to this thoughtfully updated 3-bedroom, 2-bathroom home located in the heart of Union City. Offering a functional layout and move-in ready appeal, this home features main-floor laundry, a convenient mudroom, and tasteful updates throughout. The cozy covered back porch provides a great space for relaxing or entertaining, while the walkable location offers easy access to local schools, parks, downtown amenities, and everyday conveniences. Nearby outdoor recreation includes fishing, kayaking, boating, and walking trails around Union Lake and Riverview Park. Whether you're a first-time buyer, looking for more space, or searching for a home with small-town charm, this property offers comfort, convenience, and a great location.
-
2020-08-25soldstatus $91,000
-
2020-08-17soldstatus $91,000
-
2020-08-17soldstatus $91,000 Sold
-
2020-08-17soldstatus $91,000
-
2020-07-06status Pending
-
2020-06-29$87,500
-
2020-06-29$87,500 Active
-
2020-06-29$87,500
-
2019-10-13historical
-
2019-10-12historical
-
2019-10-12historical
-
2019-09-19price $89,000
-
2019-06-18status Active
-
2019-06-03status Pending
-
2019-05-06status Active
-
2019-04-19status Pending
-
2019-04-12$89,000
-
2019-04-12$93,000 Active
-
2019-04-12$89,000
-
2017-12-27soldstatus $82,900
-
2017-11-28soldstatus $82,900
-
2017-11-28soldstatus $82,900 Sold
-
2017-10-26status Pending
-
2017-10-23$82,900 Active
-
2017-10-23$82,900
-
2014-11-07soldstatus $64,900
-
2014-11-03soldstatus $64,900
-
2014-11-03soldstatus $64,900
-
2014-09-25historical
-
2014-09-15historical
-
2014-09-05$69,900
-
2014-09-05$69,900
-
2009-09-25soldstatus $37,500
-
2009-09-25soldstatus $37,500
-
2009-06-18$44,900
-
2009-06-18$44,900
-
2007-02-27$88,000
-
2007-02-27$88,000
-
2003-12-31soldstatus $21,000
-
2003-12-31soldstatus $21,000
-
2003-12-31soldstatus $21,600
-
2003-09-03$32,500
-
2003-09-03$32,500
-
2002-07-01$32,500
ⓘ Source: listings_history table (triggers on properties + properties_extension) + one-shot
backfill from property_details.listing_events for pre-trigger history.
Tax reassessment forecast MI · Partial reset (capped growth)
- Current annual tax
- $1,175 · $98/mo
- Projected year-2 tax
- $2,051 · $171/mo
- Expected delta
- +$875/yr (+$73/mo · 74.5%)
ⓘ Screening estimate from a state-policy table — verify with the county assessor before closing.
Climate risk First Street
- Flood 1/10 Low FEMA zone X (unshaded) · 0% chance over 30 yrs
- Wildfire 1/10 Low
- Heat 2/10 Low 7 d/yr ≥98°F today · 16 d/yr by 30 yrs out
- Wind 2/10 Low
- Air quality 2/10 Low 1 unhealthy d/yr today · 2 by 30 yrs out
Nearby sold comps map
Loading sold comps map…
Walkable amenities ~0.75 mi
Loading nearby amenities…
Taxation est. · year 1
- Rental income
- $22,918
- − Mortgage interest
- −$10,643
- − Property taxes
- −$1,175
- − Insurance
- −$950
- − Repairs & maintenance
- −$1,833
- − Management
- −$1,833
- − Depreciation
- −$5,527
- Taxable income
- $956
- Est. tax owed @ 24.0%
- −$229
- After-tax cash flow
- $3,794/yr
For passive investors: Depreciation is non-cash, so a rental often shows a tax loss while cash-flowing — sheltering income. Rental losses are passive: they offset passive income freely, and up to $25,000/yr can offset ordinary (W-2) income if you actively participate and your MAGI is under $100k (phasing out to $0 by $150k); unused losses carry forward. On sale, claimed depreciation is recaptured at up to 25%, and gains may owe capital-gains tax (a 1031 exchange can defer both). Figures are a year-1 estimate at your 24.0% rate — not tax advice; consult a CPA.
Schools (NCES district)
- District
- Union City Community Schools
- NCES district ID
- 2634410
- Math proficiency
- 22% ▼ -9.00%
- Reading proficiency
- 39% ▼ -5.00%
- Median HH income
- $45,302
- Composite
- 26.1/100
- National rank
- #7288
- State rank
- #354 of 540 in MI
Livability — Union City
- Score
- 69/100
- State rank
- #339
- US rank
- #8478
Category grades
Schools grade is shown separately in the Schools card above.
Census & demographics
- Census place
- Union City, MI
- Population (ZIP)
- 3,755
Population outlook (Branch County) Hauer SSP2
- Today (2025)
- 41,079 people
- By 2030
- 39,622 · -3.5%
- By 2040
- 36,584 · -10.9%
- By 2050
- 33,462 · -18.5%
- By 2075
- 26,612 · -35.2%
- By 2100
- 18,580 · -54.8%
Race, ethnicity, and origin ACS 2023
- Neighborhood character
- Predominantly White (82%)
- Race & ethnicity
- White 82% Two or more races 13% Hispanic / Latino 6%
- Hispanic origin (detail)
- Mexican 5%
- Common ancestry
- Romanian 4% Italian 2% Slovak 2%
- Foreign-born
- 1%
- Languages at home
- 98% English-only · Spanish 1%
Political lean MEDSL · Branch
- 2024 margin
- Solid R (+42.4) · D 28.0% · R 70.4% · Other 1.6%
- 2008→2024 swing
- -36.2pp toward R · 2008: -6.1pp · 2024: -42.4pp
- All cycles
- 2024: R+42.4 2020: R+38.5 2016: R+38.1 2012: R+18.7 2008: R+6.1
Not yet ingested
- Civics
- —
Market trends
- HPI YoY
- ▼ -67.02%
- Current HPI
- 165.9347
- Rent YoY
- —
- Metro
- —
- State GDP YoY
- ▲ 1.37%
- F500 in state
- 28
Industry mix (Fortune 500 HQ in MI)
| Industry | F500 HQs | Revenue |
|---|---|---|
| Automotive Parts | 3 | $48B |
|
||
| Automotive | 2 | $372B |
|
||
| Chemicals | 1 | $45B |
|
||
| Automotive Retail | 1 | $29B |
|
||
| Healthcare / Medical Devices | 1 | $23B |
|
||
| Automotive Technology | 1 | $20B |
|
||
Price history
+484.6% since first listed48 events — show timeline
- 2026-05-21 Listed $190,000 SW Michigan MLS
- 2026-05-21 Listed $190,000 REALCOMP
- 2026-05-21 Listed $190,000 MiRealSource-MiMLS
- 2020-08-25 Sold (Public Records) $91,000 Public Records
- 2020-08-17 Sold (MLS) $91,000 MiRealSource-MiMLS
- 2020-08-17 Sold (MLS) $91,000 SW Michigan MLS
- 2020-08-17 Sold (MLS) $91,000 REALCOMP
- 2020-07-06 Pending — SW Michigan MLS
- 2020-06-29 Listed $87,500 MiRealSource-MiMLS
- 2020-06-29 Listed $87,500 SW Michigan MLS
- 2020-06-29 Listed $87,500 REALCOMP
- 2019-10-13 Listing Removed — SW Michigan MLS
- 2019-10-12 Listing Removed — MiRealSource-MiMLS
- 2019-10-12 Listing Removed — REALCOMP
- 2019-09-19 Price Changed $89,000 SW Michigan MLS
- 2019-06-18 Relisted — SW Michigan MLS
- 2019-06-03 Pending — SW Michigan MLS
- 2019-05-06 Relisted — SW Michigan MLS
- 2019-04-19 Pending — SW Michigan MLS
- 2019-04-12 Listed $89,000 MiRealSource-MiMLS
- 2019-04-12 Listed $93,000 SW Michigan MLS
- 2019-04-12 Listed $89,000 REALCOMP
- 2017-12-27 Sold (Public Records) $82,900 Public Records
- 2017-11-28 Sold (MLS) $82,900 SW Michigan MLS
- 2017-11-28 Sold (MLS) $82,900 REALCOMP
- 2017-10-26 Pending — SW Michigan MLS
- 2017-10-23 Listed $82,900 SW Michigan MLS
- 2017-10-23 Listed $82,900 REALCOMP
- 2014-11-07 Sold (Public Records) $64,900 Public Records
- 2014-11-03 Sold (MLS) $64,900 REALCOMP
- 2014-11-03 Sold (MLS) $64,900 SW Michigan MLS
- 2014-09-25 Listing Removed — SW Michigan MLS
- 2014-09-15 Listing Removed — SW Michigan MLS
- 2014-09-05 Listed $69,900 REALCOMP
- 2014-09-05 Listed $69,900 SW Michigan MLS
- 2009-09-25 Sold (MLS) $37,500 REALCOMP
- 2009-09-25 Sold (MLS) $37,500 SW Michigan MLS
- 2009-06-18 Listed $44,900 REALCOMP
- 2009-06-18 Listed $44,900 SW Michigan MLS
- 2007-02-27 Listed $88,000 REALCOMP
- 2007-02-27 Listed $88,000 SW Michigan MLS
- 2003-12-31 Sold (Public Records) $21,600 Public Records
- 2003-12-31 Sold (MLS) $21,000 REALCOMP
- 2003-12-31 Sold (MLS) $21,000 SW Michigan MLS
- 2003-09-03 Listed $32,500 REALCOMP
- 2003-09-03 Listed $32,500 SW Michigan MLS
- 2002-07-01 Listed $32,500 REALCOMP
- 2002-07-01 Listed $32,500 SW Michigan MLS
Property tax history
+75.4%/yrLatest (2024): $1,175 · +207.7% YoY. Source: county tax records.
Cash-flow waterfall
monthlySold comps — $/sqft
last 12 mo · ≤1 miLoading sold comps…