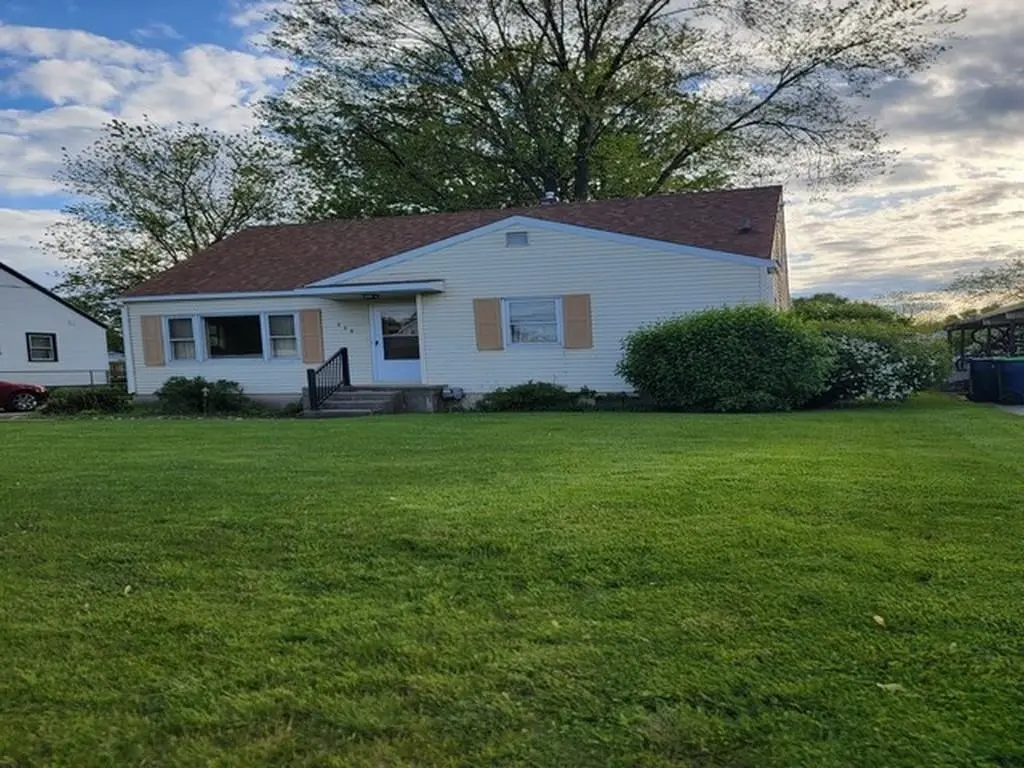
539 Dodson Ct · Bay City, MI
Flood risk 4/10 · Minor
- FEMA flood zone
- X (unshaded)
- Chance of flooding over 30 yrs
- 0.29%
- Est. flood insurance / yr
- $473 – $860
Fire risk 1/10 · Minimal
- Est. fire insurance / yr
- $784 – $1,456
Heat risk 3/10 · Minor
- Hot days now (above 97°F)
- 7 days/yr
- Hot days in 30 yrs
- 14 days/yr
Wind risk 1/10 · Minimal
- Chance of severe wind over 30 yrs
- —
Air-quality risk 2/10 · Minimal
- Unhealthy air days now
- 1 days/yr
- Unhealthy air days in 30 yrs
- 2 days/yr
Risk factors via First Street. Map © Google.
Why this score? — see what drove the B grade
The composite is a weighted blend of 9 inputs, each scored 0–100. Each bar is that input's sub-score; the figure is the points it added to the 100-point composite (weight × sub-score).
- Cash flow +30.0/30.0
- ARV discount +14.7/15.0
- DSCR +10.0/10.0
- 1% rule +8.8/10.0
- Livability +3.4/5.0
- Schools +2.8/10.0
- Rent growth +2.5/5.0
- Condition / age +2.5/5.0
- Appreciation +0.0/10.0
$104,900
🖨 Deal sheet 📄 Offer letter ✓ Due diligence
Listing remarks
Endless possibilities here with this South end charmer! 4 bedrooms, 2 of which are on main floor and 2 on second floor . Two baths, one each floor and a huge full basement! Great for hosting family or friends! Also features open kitchen/dining combo area with patio doors offering views to lovely backyard. Deck on back for outdoor relaxation. Hurry on this one and fire up that grill in your own backyard this summer!
Key facts
- Patio doors
- Lovely backyard
- Deck on back
Tags
Property features AI
Finance
- Other: Lot size approximately 0.13 acres (frontage ~59')
- Financial info: No investor or rental income details provided
- HOA & community: No HOA information provided
Exterior
- Parking: No parking details provided
- Security: No security features provided
- Utilities: Public water; Public sanitary sewer; Natural gas service; Gas water heater
- Home design: Residential property; 1 1/2-story structure; Built in 1962; Frontage on a road
- Construction: Aluminum construction; Basement foundation; Year built: 1962
- Exterior features: Aluminum exterior; Paved street frontage
Interior
- Kitchen: Main-level kitchen (10 x 9) with vinyl flooring
- Bedrooms: Bedroom 1 on the first floor (12 x 9) with carpet; Bedroom 2 on the first floor (12 x 10) with carpet; Bedroom 3 on the second floor (approx. 9') with vinyl flooring; Bedroom 4 on the second floor (13 x 11) with vinyl flooring
- Flooring: Carpet in living areas and dining room; Vinyl in kitchen, some bedrooms and bathrooms
- Bathrooms: 2 full bathrooms; Main-level bathroom about 8 x 5 with vinyl flooring; Second-level bathroom with vinyl flooring
- Heating & cooling: Forced air heating; Natural gas fuel; Gas water heater
- Interior features: Total of 9 rooms; Basement present
- Laundry & utility: No separate laundry details provided
Neighborhood map
What this means for you Summary
Snapshot
- This is a 4-bed/1.0-bath single-family listed at $105k.
Deal economics
- At list price, monthly cash flow is $434 ($5k/yr) — positive.
- The deal already cash-flows at list — no discount required.
- Meets the 1% rule at list price ($1k rent vs $105k).
- Cap rate 11.3% vs local median 5.5% in Bay City — top-decile yield for the area; either an underpriced asset or a hidden risk that comps aren't pricing in. Stress-test before assuming the spread holds.
Location & tenants
- Location reads 68/100 on livability (#360 in MI) — a middle-class / working-renter tenant base. Strengths: cost of living A+, housing A+, health & safety A+; Watch: schools D+, amenities D, crime F.
- Bay City School District (urban): math 27% / reading 40% proficiency, ranked #317 of 540 in MI (top 59%) — families likely to look elsewhere, expect single-tenant / working-renter base with shorter leases.
- Market conditions: 148 active listings in the ZIP; 39 units permitted in Bay County in 2024 (0 in 5+ unit buildings).
- This rent runs 34% of the median local income ($51k/yr) — at the standard rent-burdened threshold; future hikes will face affordability resistance.
Forward outlook
- Local home prices are declining (-3.0%/yr); year-one equity from $725 of loan paydown is wiped out by about $3k of value loss. Plan a longer hold.
- Bay County population projected at -21% by 2050 — secular population decline; favor cash flow + early exit over multi-decade hold.
- At projected returns (-3.0% appreciation + 3.0% rent growth), your $29k cash investment doubles in ~7 years — after that, you're playing with house money.
Negotiation context
- Only 12 days on market — expect competitive offers; lowballing is unlikely to land.
Questions for the listing agent
- Built in 1962 — when were the roof, HVAC, electrical panel, plumbing, and water heater last replaced?
- Is there a deadline driving the sale (1031 exchange, divorce, estate, relocation)? That informs how much negotiation room exists.
- Schools are D-rated, which usually means shorter tenancies and higher turnover. Who's the typical renter profile here, and what's been the actual vacancy rate?
- Crime grade is F in this area — have there been break-ins, vandalism, or insurance claims at this property in the last 3 years? What carrier currently insures it and at what premium?
- What's the average days-on-market for RENTAL listings here right now (not sales)? A rising rental-DOM trend means longer vacancies and softer asking-rent achievability than the comps imply.
- What's the recent tenant-quality profile in this submarket — average credit score on applications, eviction rate, late-payment / NSF rate, and stable-employment percentage? A property-management company in the area should have these aggregated.
- How much new for-sale + rental construction is in the pipeline within 1–3 miles? Heavy new supply typically softens prices + rents 12–24 months out; constrained supply supports both.
Investment metrics
- 1% rule
- 1.38% ✓
- Cap rate
- 11.26%
- Cash-on-cash
- 17.74%
- DSCR
- 1.79
- GRM
- 6.1
CMA / ARV
- ARV (on-the-fly)
- $124,936
- Comps found
- 12
Show comp detail 12 sales within ~0.75 mi
| Address | Dist | Beds/Ba | Sqft | Sold | Price | $/sf | Match |
|---|---|---|---|---|---|---|---|
| 1423 Stanton St | 0.47mi | 3/1.0 (-1) | 1,310 (-4%) | 2mo | $113,650 | $87 | 66 |
| 1510 Stanton St | 0.43mi | 3/1.0 (-1) | 1,380 (+2%) | 10mo | $133,000 | $96 | 64 |
| 1713 Marsac St | 0.39mi | 3/2.0 (-1) | 1,325 (-2%) | 8mo | $120,000 | $91 | 62 |
| 500 38th St | 0.16mi | 3/2.0 (-1) | 1,200 (-12%) | 4mo | $78,000 | $65 | 61 |
| 1118 Cass Ave | 0.45mi | 3/1.0 (-1) | 1,398 (+3%) | 14mo | $111,000 | $79 | 57 |
| 1300 Lisk Dr | 0.47mi | 3/2.0 (-1) | 1,432 (+5%) | 11mo | $169,000 | $118 | 51 |
| 2501 S Jefferson St | 0.60mi | 4/1.0 | 1,252 (-8%) | 12mo | $115,600 | $92 | 48 |
| 2764 Sandra St | 0.61mi | 3/1.0 (-1) | 1,448 (+7%) | 10mo | $155,000 | $107 | 47 |
| 1500 Wilson St | 0.56mi | 4/2.0 | 1,160 (-15%) | 0mo | $175,000 | $151 | 45 |
| 2505 Garfield Ave | 0.50mi | 3/2.0 (-1) | 1,232 (-9%) | 10mo | $113,000 | $92 | 44 |
| 1617 Broadway St | 0.73mi | 3/1.0 (-1) | 1,267 (-7%) | 7mo | $70,000 | $55 | 44 |
| 2511 Garfield Ave | 0.48mi | 3/1.0 (-1) | 1,200 (-12%) | 13mo | $39,350 | $33 | 43 |
Match score weights: distance 35% · size 25% · config 20% · recency 20%. Top-matched comps best support the ARV.
Projected returns pro-forma
-3.0% appreciation · 3.0% rent growth · sell at horizon
- IRR
- 9.2%
- Equity multiple
- 1.36×
- Total profit
- $10,663
- Equity at exit
- $15,641
- IRR
- 18.4%
- Equity multiple
- 2.53×
- Total profit
- $44,932
- Equity at exit
- $9,070
Cash invested: $29,372 (down + closing). Projections, not guarantees.
Landlord ↔ Tenant lean methodology
- Overall (STATE)
- 62 Landlord-Friendly
- State Michigan
- 62 Landlord-Friendly · EVEN
- County
- — inherits STATE
- City
- — inherits STATE
ZIP-level market 48708
- Home prices YoY
- -30.9%
- Active inventory
- 148
- Price-to-rent
- 6.1×
Monthly cashflow live
- Estimated rent
- $1,444 medium interval (Pro) →
- Mortgage (P&I)
- −$550
- Tax from tax record
- −$113 /mo · $1,353/yr
- Insurance
- −$44
- HOA
- −$0
- Vacancy / Maint / Mgmt
- −$303
- Net cashflow
- $434
Break-even live
UW: 25.0% down · 7.5% · 30yr · 1.5% tax · 5.0% vac · 8.0% maint · 8.0% mgmt
Financing live
Cash to close
- Down payment
- $26,225
- Closing costs
- $3,147
- Reserves months
- —
- Total cash needed
- —
Loan-product check · same deal, 3 products live
Conventional
25% down · 7.5% · 30yr
- Down + closing
- —
- Monthly P&I
- —
- Monthly cashflow
- —
- DSCR
- —
- Eligible?
- —
Personal DTI + credit; lowest rate.
DSCR
20% down · 8.5% · 30yr
- Down + closing
- —
- Monthly P&I
- —
- Monthly cashflow
- —
- DSCR
- —
- Eligible?
- —
No personal income docs; deal must DSCR.
Hard money
10% down · 12.0% · 12mo
- Down + closing
- —
- Monthly P&I
- —
- Monthly cashflow
- —
- DSCR
- —
- Eligible?
- —
Short-term bridge; refi at stabilization.
Listing history 7 events
-
2026-06-05status $104,900 Pending 12 DOM
-
2026-06-03days on market $104,900 Active 12 DOM
-
2026-06-02days on market $104,900 Active 11 DOM
-
2026-06-01days on market $104,900 Active 10 DOM
-
2026-05-31days on market $104,900 Active 9 DOM
-
2026-05-30days on market $104,900 Active 8 DOM
-
2026-05-22$104,900 Active
ⓘ Source: listings_history table (triggers on properties + properties_extension) + one-shot
backfill from property_details.listing_events for pre-trigger history.
Tax reassessment forecast MI · Partial reset (capped growth)
- Current annual tax
- $1,353 · $113/mo
- Projected year-2 tax
- $1,484 · $124/mo
- Expected delta
- +$131/yr (+$11/mo · 9.7%)
ⓘ Screening estimate from a state-policy table — verify with the county assessor before closing.
Climate risk First Street
- Flood 4/10 Moderate FEMA zone X (unshaded) · 29% chance over 30 yrs
- Wildfire 1/10 Low
- Heat 3/10 Moderate 7 d/yr ≥97°F today · 14 d/yr by 30 yrs out
- Wind 1/10 Low
- Air quality 2/10 Low 1 unhealthy d/yr today · 2 by 30 yrs out
Nearby sold comps map
Loading sold comps map…
Walkable amenities ~0.75 mi
Loading nearby amenities…
Taxation est. · year 1
- Rental income
- $17,327
- − Mortgage interest
- −$5,876
- − Property taxes
- −$1,353
- − Insurance
- −$524
- − Repairs & maintenance
- −$1,386
- − Management
- −$1,386
- − Depreciation
- −$3,052
- Taxable income
- $3,750
- Est. tax owed @ 24.0%
- −$900
- After-tax cash flow
- $4,310/yr
For passive investors: Depreciation is non-cash, so a rental often shows a tax loss while cash-flowing — sheltering income. Rental losses are passive: they offset passive income freely, and up to $25,000/yr can offset ordinary (W-2) income if you actively participate and your MAGI is under $100k (phasing out to $0 by $150k); unused losses carry forward. On sale, claimed depreciation is recaptured at up to 25%, and gains may owe capital-gains tax (a 1031 exchange can defer both). Figures are a year-1 estimate at your 24.0% rate — not tax advice; consult a CPA.
Schools (NCES district)
- District
- Bay City School District
- NCES district ID
- 2604260
- Math proficiency
- 27% ▼ -8.00%
- Reading proficiency
- 40% ▼ -4.00%
- Median HH income
- $43,833
- Composite
- 28.47/100
- National rank
- #6743
- State rank
- #317 of 540 in MI
Livability — Bay City
- Score
- 68/100
- State rank
- #360
- US rank
- #8912
Category grades
Schools grade is shown separately in the Schools card above.
Census & demographics
- Census place
- Bay City, MI
- County
- Bay County · 36,975 people
- City population
- 25,635
- Metro
- Bay City, MI
- Population (ZIP)
- 25,635
- Household income
- $50,518
- Rent vs Own
- Severe rent burden
- 528.0
Population outlook (Bay County) Hauer SSP2
- Today (2025)
- 101,476 people
- By 2030
- 98,152 · -3.3%
- By 2040
- 89,711 · -11.6%
- By 2050
- 80,614 · -20.6%
- By 2075
- 60,544 · -40.3%
- By 2100
- 41,603 · -59.0%
Race, ethnicity, and origin ACS 2023
- Neighborhood character
- Predominantly White (81%)
- Race & ethnicity
- White 81% Hispanic / Latino 11% Two or more races 10% Black 3%
- Hispanic origin (detail)
- Mexican 9%
- Common ancestry
- Romanian 17% Lithuanian 7% Slovak 2%
- Foreign-born
- 2% · Canada, South Korea
- Languages at home
- 96% English-only · Spanish 2% German/W. Germanic 1%
Political lean MEDSL · Bay
- 2024 margin
- R (+14.7) · D 42.0% · R 56.7% · Other 1.3%
- 2008→2024 swing
- -30.0pp toward R · 2008: 15.3pp · 2024: -14.7pp
- All cycles
- 2024: R+14.7 2020: R+11.6 2016: R+12.6 2012: D+6.0 2008: D+15.3
Not yet ingested
- Civics
- —
Market trends
- HPI YoY
- ▼ -82.21%
- Current HPI
- 183.5774
- Rent YoY
- —
- Metro
- Bay City, MI
- State GDP YoY
- ▲ 1.37%
- F500 in state
- 28
Industry mix (Fortune 500 HQ in MI)
| Industry | F500 HQs | Revenue |
|---|---|---|
| Automotive Parts | 3 | $48B |
|
||
| Automotive | 2 | $372B |
|
||
| Chemicals | 1 | $45B |
|
||
| Automotive Retail | 1 | $29B |
|
||
| Healthcare / Medical Devices | 1 | $23B |
|
||
| Automotive Technology | 1 | $20B |
|
||
Price history
1 event — show timeline
- 2026-05-22 Listed $104,900 MiRealSource-MiMLS
Property tax history
+0.3%/yrLatest (2025): $1,353 · -15.2% YoY. Source: county tax records.
Cash-flow waterfall
monthlySold comps — $/sqft
last 12 mo · ≤1 miLoading sold comps…