42 Mill Creek Rd · Vincentown, NJ
Flood risk 10/10 · Severe
- FEMA flood zone
- X (unshaded)
- Chance of flooding over 30 yrs
- 0.99%
- Est. flood insurance / yr
- $507 – $1,088
Fire risk 3/10 · Minor
- Est. fire insurance / yr
- $526 – $976
Heat risk 6/10 · Moderate
- Hot days now (above 103°F)
- 7 days/yr
- Hot days in 30 yrs
- 14 days/yr
Wind risk 6/10 · Moderate
- Chance of severe wind over 30 yrs
- 52.0%
Air-quality risk 4/10 · Minor
- Unhealthy air days now
- 5 days/yr
- Unhealthy air days in 30 yrs
- 7 days/yr
Risk factors via First Street. Map © Google.
Why this score? — see what drove the B- grade
The composite is a weighted blend of 9 inputs, each scored 0–100. Each bar is that input's sub-score; the figure is the points it added to the 100-point composite (weight × sub-score).
- Cash flow +30.0/30.0
- 1% rule +10.0/10.0
- DSCR +10.0/10.0
- ARV discount +7.5/15.0
- Schools +3.4/10.0
- Rent growth +2.9/5.0
- Livability +2.5/5.0
- Condition / age +2.5/5.0
- Appreciation +0.0/10.0
$89,000
🖨 Deal sheet 📄 Offer letter ✓ Due diligence
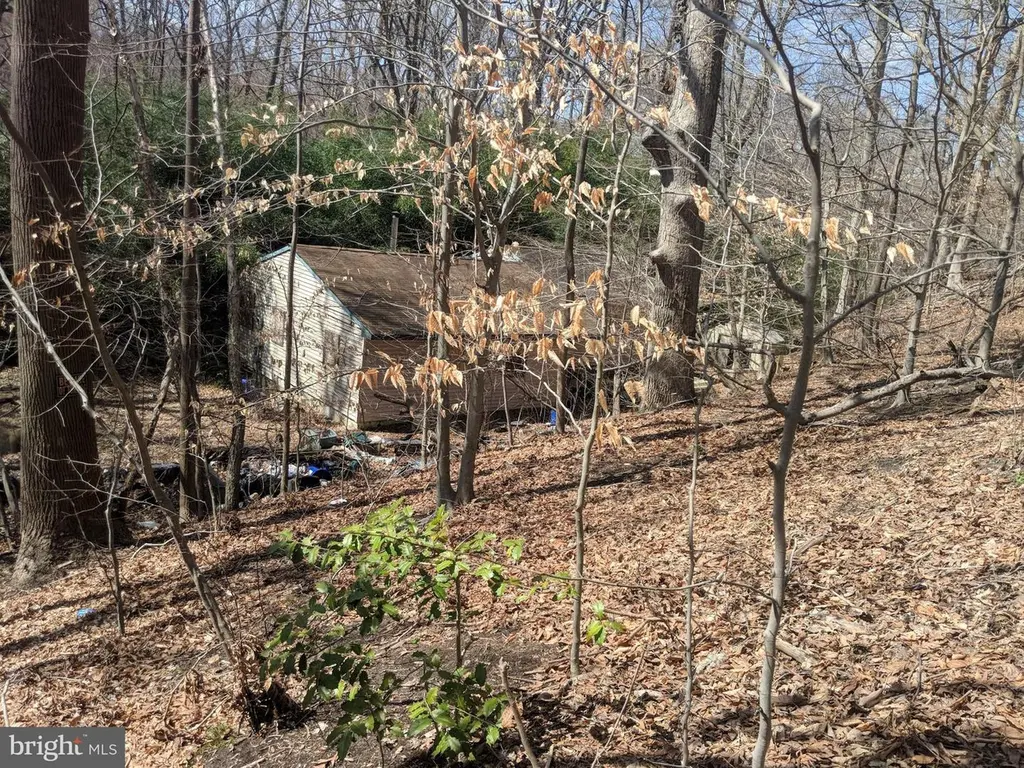
Listing remarks
Location is truly unique and extraordinary: extremely rare 148 linear ft of private frontage the Rancocas Creek. If you love nature, this property is perfect for you. Located in one of the most tranquil locations in New Jersey in the woods near Rancocas Creek. The deck overlooking Rancocas Creek is your perfect spot for watching the river flow while enjoying your morning coffee. A paradise for kayak / canoe enthusiasts. Convenient access to i-95. Travel time to NYC is under 1 hour 30 min. Property needs extensive renovation. Currently, it is unoccupied and not a livable condition. Escape to the Water’s Edge. Rare opportunity to own a home featuring 148 ft of pristine creek frontage.
Key facts
- 0.72 acre lot
- 3 parking spots
- Built 1950
Property features AI
Finance
- Financial info: Ownership is fee simple
Exterior
- Parking: Off-street parking for three vehicles (total of three garage/parking spaces listed)
- Home design: Detached structure
- Construction: Frame construction; Other-type foundation; Above-grade and below-grade structures noted; Finished area above grade recorded by assessor
- Exterior features: Waterfront property on Rancocas Creek; Water access suitable for canoe/kayak; Water frontage approximately 50 feet; Navigable creek
Interior
- Bedrooms: Three bedrooms on the main level
- Bathrooms: One full bathroom (one full on main level)
- Interior features: No basement; Living area measured by assessor
Neighborhood map
What this means for you Summary
Snapshot
- This is a 3-bed/1.0-bath single-family listed at $89k.
Deal economics
- At list price, monthly cash flow is $1k ($14k/yr) — positive.
- The deal already cash-flows at list — no discount required.
- Meets the 1% rule at list price ($3k rent vs $89k).
- Recommended offer: $86k (3.0% below list) — sets the bar for market timing.
- Cap rate 22.5% vs local median 4.5% in Vincentown — top-decile yield for the area; either an underpriced asset or a hidden risk that comps aren't pricing in. Stress-test before assuming the spread holds.
Location & tenants
- Location reads: area grade B — affects rentability + tenant quality, not the cash-flow math above.
- Rancocas Valley Regional High School District (suburban): math 29% / reading 49% proficiency, ranked #236 of 472 in NJ (top 50%) — families likely to look elsewhere, expect single-tenant / working-renter base with shorter leases.
- Market conditions: Rents rising (+1.4%/yr); 134 active listings in the ZIP; 8 comparable units currently listed for rent nearby; rentals leasing fast (median 1d on market — plan ~1-2 weeks tenant-placement turnaround); solid renter incomes; 2,161 units permitted in Burlington County in 2024 (988 in 5+ unit buildings).
Forward outlook
- Local home prices are declining (-3.0%/yr); year-one equity from $615 of loan paydown is wiped out by about $3k of value loss. Plan a longer hold.
- Burlington County population projected to shrink 5% by 2050 — rents likely to lag national; underwrite the cash flow, not the appreciation.
- At projected returns (-3.0% appreciation + 1.4% rent growth), your $25k cash investment doubles in ~3 years — after that, you're playing with house money.
Negotiation context
- It's been on market 52 days — a 3% lower offer ($86k) is reasonable based on typical stale-listing flexibility.
Risks & watch-outs
- Watch-outs: property tax is 4.6% of price; flood insurance adds $66/mo; built in 1950 — expect roof / HVAC / electrical / plumbing capex.
- Climate carrying-cost: severe flood risk; major wind risk, 52% chance of damaging wind over 30y; extreme-heat days projected 7→14/yr by 2055 (HVAC capex compounding) — expect insurance premiums to compound above CPI over the hold.
Questions for the listing agent
- It's been on market 52 days. Have you received any prior offers? Is the seller open to a 3% concession, seller financing, or rate buy-down credit?
- Built in 1950 — when were the roof, HVAC, electrical panel, plumbing, and water heater last replaced?
- Property tax is high relative to price — has the assessment been appealed recently, and will the sale trigger a re-assessment?
- What's the actual annual flood-insurance premium (NFIP or private), and is the property in a SFHA with mandatory coverage?
- Is there a deadline driving the sale (1031 exchange, divorce, estate, relocation)? That informs how much negotiation room exists.
- What's the average days-on-market for RENTAL listings here right now (not sales)? A rising rental-DOM trend means longer vacancies and softer asking-rent achievability than the comps imply.
- What's the recent tenant-quality profile in this submarket — average credit score on applications, eviction rate, late-payment / NSF rate, and stable-employment percentage? A property-management company in the area should have these aggregated.
- How much new for-sale + rental construction is in the pipeline within 1–3 miles? Heavy new supply typically softens prices + rents 12–24 months out; constrained supply supports both.
Investment metrics
- 1% rule
- 2.92% ✓
- Cap rate
- 22.54%
- Cash-on-cash
- 58.02%
- DSCR
- 3.58
- GRM
- 2.9
CMA / ARV
- ARV (on-the-fly)
- $379,848
- Comps found
- 9
Show comp detail 9 sales within ~0.75 mi
| Address | Dist | Beds/Ba | Sqft | Sold | Price | $/sf | Match |
|---|---|---|---|---|---|---|---|
| 5 Cypress | 0.55mi | 3/1.5 | 1,257 (-3%) | 10mo | $421,000 | $335 | 60 |
| 14 Willowbrook Way | 0.47mi | 3/1.5 | 1,257 (-3%) | 20mo | $420,000 | $334 | 55 |
| 9 Willowbrook | 0.50mi | 3/1.5 | 1,445 (+12%) | 8mo | $475,000 | $329 | 48 |
| 1 Surrey Ct | 0.56mi | 3/2.5 | 1,376 (+6%) | 11mo | $380,000 | $276 | 47 |
| 18 Kingsley | 0.68mi | 3/2.5 | 1,376 (+6%) | 6mo | $405,000 | $294 | 46 |
| 1 Kent Ct | 0.60mi | 3/2.5 | 1,376 (+6%) | 12mo | $413,000 | $300 | 45 |
| 12 Kingsley Rd | 0.72mi | 3/2.5 | 1,376 (+6%) | 6mo | $388,000 | $282 | 45 |
| 12 Nottingham Way | 0.67mi | 3/2.5 | 1,376 (+6%) | 10mo | $405,000 | $294 | 44 |
| 9 Suffolk Ct | 0.67mi | 3/2.0 | 1,392 (+8%) | 22mo | $388,000 | $279 | 34 |
Match score weights: distance 35% · size 25% · config 20% · recency 20%. Top-matched comps best support the ARV.
Projected returns pro-forma
-3.0% appreciation · 1.42% rent growth · sell at horizon
- IRR
- 51.0%
- Equity multiple
- 3.18×
- Total profit
- $54,246
- Equity at exit
- $13,270
- IRR
- 55.7%
- Equity multiple
- 6.03×
- Total profit
- $125,354
- Equity at exit
- $7,695
Cash invested: $24,920 (down + closing). Projections, not guarantees.
Landlord ↔ Tenant lean methodology
- Overall (STATE)
- 21 Tenant-Leaning
- State New Jersey
- 21 Tenant-Leaning · D+6
- County
- — inherits STATE
- City
- — inherits STATE
ZIP-level market 08060
- Home prices YoY
- -34.5%
- Rents YoY
- 1.4%
- Active inventory
- 134
- Price-to-rent
- 2.9×
Monthly cashflow live
- Estimated rent
- $2,596 high interval (Pro) →
- Mortgage (P&I)
- −$467
- Tax from tax record
- −$342 /mo · $4,102/yr
- Insurance
- −$37
- Flood insurance flood zone
- −$66 /mo · $798/yr
- HOA
- −$0
- Vacancy / Maint / Mgmt
- −$545
- Net cashflow
- $1,138
Break-even live
UW: 25.0% down · 7.5% · 30yr · 1.5% tax · 5.0% vac · 8.0% maint · 8.0% mgmt
Financing live
Cash to close
- Down payment
- $22,250
- Closing costs
- $2,670
- Reserves months
- —
- Total cash needed
- —
Loan-product check · same deal, 3 products live
Conventional
25% down · 7.5% · 30yr
- Down + closing
- —
- Monthly P&I
- —
- Monthly cashflow
- —
- DSCR
- —
- Eligible?
- —
Personal DTI + credit; lowest rate.
DSCR
20% down · 8.5% · 30yr
- Down + closing
- —
- Monthly P&I
- —
- Monthly cashflow
- —
- DSCR
- —
- Eligible?
- —
No personal income docs; deal must DSCR.
Hard money
10% down · 12.0% · 12mo
- Down + closing
- —
- Monthly P&I
- —
- Monthly cashflow
- —
- DSCR
- —
- Eligible?
- —
Short-term bridge; refi at stabilization.
Rent comps 8 comps
| Address | Beds | Baths | Sqft | Rent | $/sqft | DOM | Units | Dist |
|---|---|---|---|---|---|---|---|---|
| 100 Dorchester Dr Lumberton, NJ | 1.0–2.0 | 1.0–2.0 | 1057 | $3,195 | $3.02 | 1d | 22 | 0.74mi |
| 1401 Windmill Way Lumberton, NJ | 1.0–2.0 | 1.0–2.0 | 947 | $2,315 | $2.44 | 1d | 29 | 1.09mi |
| 102 Star Dr Mount Holly, NJ | 2.0 | 2.0 | 1300 | $2,460 | $1.89 | 1d | 1 | 1.25mi |
| 92 Ginger Dr Lumberton, NJ | 3.0 | 2.5 | 1540 | $2,650 | $1.72 | 20d | 1 | 1.32mi |
| 209 Mill St Mount Holly, NJ | 3.0 | 1.5 | 1274 | $2,400 | $1.88 | 1d | 1 | 1.46mi |
| 12000 Hamilton Way Eastampton Township, NJ | 1.0–2.0 | 1.0–2.5 | 1100 | $2,894 | $2.63 | 1d | 10 | 1.48mi |
| 3a Hunter Cir Eastampton Township, NJ | 1.0–2.0 | 1.0–1.5 | 865 | $2,255 | $2.61 | 1d | 25 | 1.49mi |
| 5 Mulberry Ct Lumberton, NJ | 3.0 | 1.5 | 1244 | $2,200 | $1.77 | 1d | 1 | 1.49mi |
Listing history 15 events
-
2026-06-18days on market $89,000 Active 52 DOM
-
2026-06-17days on market $89,000 Active 51 DOM
-
2026-06-16days on market $89,000 Active 50 DOM
-
2026-06-15days on market $89,000 Active 49 DOM
-
2026-06-13days on market $89,000 Active 47 DOM
-
2026-06-13days on market $89,000 Active 46 DOM
-
2026-06-09days on market $89,000 Active 43 DOM
-
2026-06-08days on market $89,000 Active 42 DOM
-
2026-06-07days on market $89,000 Active 41 DOM
-
2026-06-04days on market $89,000 Active 38 DOM
-
2026-06-03days on market $89,000 Active 37 DOM
-
2026-06-02days on market $89,000 Active 36 DOM
-
2026-06-01days on market $89,000 Active 35 DOM
-
2026-05-31days on market $89,000 Active 34 DOM
-
2026-04-27$89,000 Active
ⓘ Source: listings_history table (triggers on properties + properties_extension) + one-shot
backfill from property_details.listing_events for pre-trigger history.
Tax reassessment forecast NJ · Partial reset (capped growth)
- Current annual tax
- $4,102 · $342/mo
- Projected year-2 tax
- $4,102 · $342/mo
- Expected delta
- $0/yr ($0/mo · 0.0%)
ⓘ Screening estimate from a state-policy table — verify with the county assessor before closing.
Climate risk First Street
- Flood 10/10 Extreme FEMA zone X (unshaded) · 99% chance over 30 yrs
- Wildfire 3/10 Moderate
- Heat 6/10 Major 7 d/yr ≥103°F today · 14 d/yr by 30 yrs out
- Wind 6/10 Major 52% chance of damaging wind over 30 yrs
- Air quality 4/10 Moderate 5 unhealthy d/yr today · 7 by 30 yrs out
Nearby sold comps map
Loading sold comps map…
Walkable amenities ~0.75 mi
Loading nearby amenities…
Taxation est. · year 1
- Rental income
- $31,147
- − Mortgage interest
- −$4,985
- − Property taxes
- −$4,102
- − Insurance
- −$1,242
- − Repairs & maintenance
- −$2,492
- − Management
- −$2,492
- − Depreciation
- −$2,589
- Taxable income
- $13,245
- Est. tax owed @ 24.0%
- −$3,179
- After-tax cash flow
- $10,483/yr
For passive investors: Depreciation is non-cash, so a rental often shows a tax loss while cash-flowing — sheltering income. Rental losses are passive: they offset passive income freely, and up to $25,000/yr can offset ordinary (W-2) income if you actively participate and your MAGI is under $100k (phasing out to $0 by $150k); unused losses carry forward. On sale, claimed depreciation is recaptured at up to 25%, and gains may owe capital-gains tax (a 1031 exchange can defer both). Figures are a year-1 estimate at your 24.0% rate — not tax advice; consult a CPA.
Schools (NCES district)
- District
- Rancocas Valley Regional High School District
- NCES district ID
- 3413620
- Math proficiency
- 29% ▼ -18.00%
- Reading proficiency
- 49% ▼ -4.00%
- Median HH income
- $58,992
- Composite
- 34.45/100
- National rank
- #5195
- State rank
- #236 of 472 in NJ
Livability — Vincentown
No livability data for this city. (Only ~50 U.S. cities are tracked.)
Census & demographics
- County
- Burlington County · 323,710 people
- Metro
- Philadelphia-Camden-Wilmington, PA-NJ-DE-MD
- Population (ZIP)
- 25,835
- Household income
- $109,292
- Rent vs Own
- Severe rent burden
- 562.0
Population outlook (Burlington County) Hauer SSP2
- Today (2025)
- 453,425 people
- By 2030
- 452,359 · -0.2%
- By 2040
- 445,033 · -1.9%
- By 2050
- 431,760 · -4.8%
- By 2075
- 406,277 · -10.4%
- By 2100
- 364,732 · -19.6%
Race, ethnicity, and origin ACS 2023
- Neighborhood character
- Diverse neighborhood (Simpson 0.68)
- Race & ethnicity
- White 49% Black 25% Two or more races 15% Hispanic / Latino 13% Asian 4%
- Hispanic origin (detail)
- Mexican 2% Puerto Rican 7%
- Common ancestry
- Romanian 4% Lithuanian 2% Italian 1%
- Foreign-born
- 11% · Canada, Dominican Republic, China
- Languages at home
- 87% English-only · Spanish 7% Other Indo-European 2% French/Haitian/Cajun 1%
Political lean MEDSL · Burlington
- 2024 margin
- D (+16.6) · D 57.6% · R 41.0% · Other 1.3%
- 2008→2024 swing
- -2.0pp toward R · 2008: 18.6pp · 2024: 16.6pp
- All cycles
- 2024: D+16.6 2020: D+19.5 2016: D+14.8 2012: D+18.7 2008: D+18.6
Not yet ingested
- Civics
- —
Market trends
- HPI YoY
- ▼ -156.50%
- Current HPI
- 296.564
- Rent YoY
- ▲ 1.42%
- Metro
- Philadelphia-Camden-Wilmington, PA-NJ-DE-MD
- State GDP YoY
- ▲ 2.05%
- F500 in state
- 34
Industry mix (Fortune 500 HQ in NJ)
| Industry | F500 HQs | Revenue |
|---|---|---|
| Consumer Goods | 3 | $31B |
|
||
| Pharmaceuticals | 2 | $153B |
|
||
| Technology | 2 | $21B |
|
||
| Insurance | 2 | $20B |
|
||
| Healthcare | 2 | $19B |
|
||
| Financial Services | 1 | $70B |
|
||
Price history
1 event — show timeline
- 2026-04-27 Listed $89,000 BRIGHT MLS
Property tax history
+1.0%/yrLatest (2025): $4,102 · +10.5% YoY. Source: county tax records.
Cash-flow waterfall
monthlySold comps — $/sqft
last 12 mo · ≤1 miLoading sold comps…