 Fourplex
6001 07 Tullis Dr · New Orleans, LA
Flood risk 9/10 · Severe
- FEMA flood zone
- AE
- Chance of flooding over 30 yrs
- 0.76%
- Est. flood insurance / yr
- $1,737 – $8,500
Fire risk 3/10 · Minor
- Est. fire insurance / yr
- $1,269 – $2,357
Heat risk 10/10 · Severe
- Hot days now (above 108°F)
- 7 days/yr
- Hot days in 30 yrs
- 22 days/yr
Wind risk 10/10 · Severe
- Chance of severe wind over 30 yrs
- 99.0%
Air-quality risk 2/10 · Minimal
- Unhealthy air days now
- 2 days/yr
- Unhealthy air days in 30 yrs
- 2 days/yr
Risk factors via First Street. Map © Google.
Why this score? — see what drove the C+ grade
The composite is a weighted blend of 9 inputs, each scored 0–100. Each bar is that input's sub-score; the figure is the points it added to the 100-point composite (weight × sub-score).
- Cash flow +30.0/30.0
- DSCR +10.0/10.0
- 1% rule +8.3/10.0
- ARV discount +4.5/15.0
- Livability +4.0/5.0
- Condition / age +2.5/5.0
- Schools +1.6/10.0
- Rent growth +0.2/5.0
- Appreciation +0.0/10.0
$429,900
🖨 Deal sheet 📄 Offer letter ✓ Due diligence
Multi-family units
County records classify this as Multi-Family (2-4 Unit). Listing-text estimate: 4 units. confirmed
Listing remarks MLS
Calling all Investors!!! 4-Plex located in Algiers, the Westbank of New Orleans! Each unit is 3 bedroom, 2 full bathrooms, and two stories. Currently 3 of 4 units are leased and collecting $4,456 in total rents. Each unit includes Range/Oven and Refrigerator, and Washer/Dryer Hookups. Each unit is separately metered for Electric and water utilities. Great investment opportunity or chance to live in one unit, and rent the other 3! Great location for commuting, quick access to the GNO or Belle Chasse.
Key facts
- 4-plex
- Washer/dryer hookups
- Leased units
Tags
Property features AI
Finance
- Other: Tenants pay electricity and water
- Financial info: Four-unit investment property; Reported rents for units include $1,500, $1,606, and $1,350 (other unit rent shown in data as actual/total where provided)
Exterior
- Parking: Off-street parking
- Utilities: Public water; Public sewer
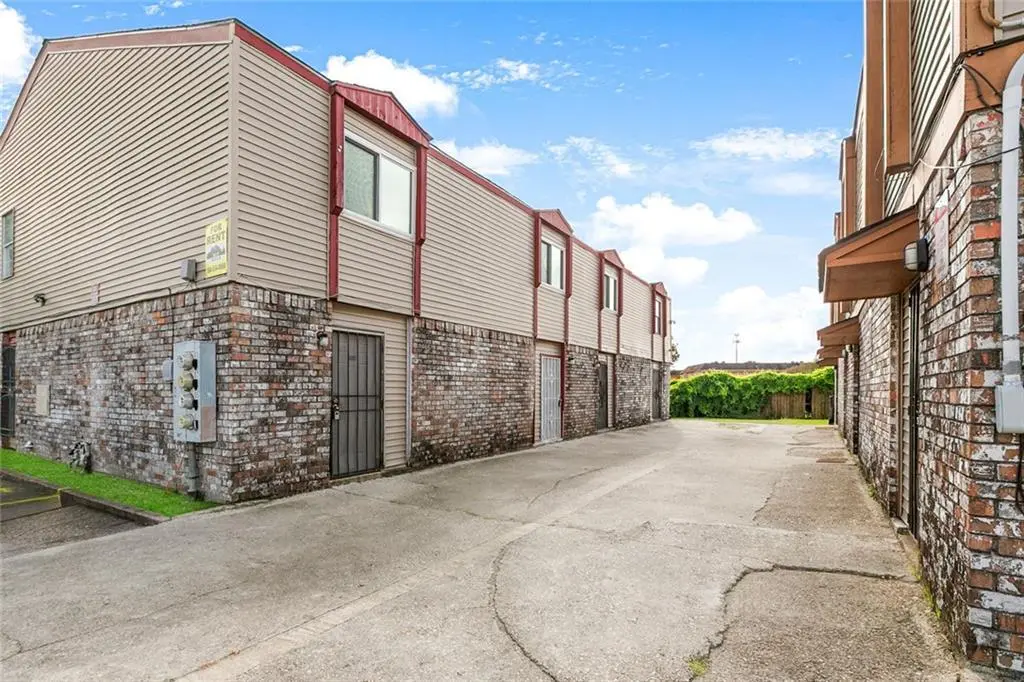
- Home design: Two-story multifamily building
- Construction: Brick and wood siding exterior; Shingle roof; Slab foundation; Built with average condition
- Exterior features: City lot with rectangular dimensions (approximately 60 x 132); Balcony
Interior
- Bedrooms: Four 3-bedroom units (unit numbers 6001, 6003, 6005, 6007)
- Bathrooms: Eight full bathrooms (each unit has 2 full bathrooms)
- Heating & cooling: Central heating; Central air conditioning
- Interior features: Balcony
Neighborhood map
What this means for you Summary
Snapshot
- This is a 4 × 3-bed/2.0-bath units multifamily listed at $430k.
Deal economics
- At list price, monthly cash flow is $1k ($17k/yr) — positive. Per door: $355/mo.
- The deal already cash-flows at list — no discount required.
- Meets the 1% rule at list price ($6k rent vs $430k).
- Cap rate 11.4% vs local median 4.4% in New Orleans — top-decile yield for the area; either an underpriced asset or a hidden risk that comps aren't pricing in. Stress-test before assuming the spread holds.
Location & tenants
- Location reads 81/100 on livability (#3 in LA, #1,383 nationally) — a professional / high-income tenant draw. Strengths: amenities A+, commute A+, health & safety A+; Watch: crime C-, employment D.
- Orleans Parish (urban): math 11% / reading 27% proficiency, ranked #69 of 98 in LA (top 70%) — low school quality limits family demand, transient renter base, plan for 1-2y turnover; 68% free/reduced lunch — lower-income household profile, screen leases tightly.
- Market conditions: Rents falling (-9.2%/yr); 274 active listings in the ZIP; 710 units permitted in Orleans Parish in 2024 (244 in 5+ unit buildings).
- At $5,708/mo this rent would consume 110% of the median local household income ($62k/yr) (locally 707% of renters already pay >50% of income on rent) — very limited rent-growth headroom before tenants either downsize or default.
Forward outlook
- Local home prices are declining (-3.0%/yr); year-one equity from $3k of loan paydown is wiped out by about $13k of value loss. Plan a longer hold.
- Orleans County population projected at +61% by 2050 — long-run rental-demand tailwind backs the buy-and-hold thesis.
Negotiation context
- Only 1 days on market — expect competitive offers; lowballing is unlikely to land.
- 9 sale attempts since 8y ago with the ask held roughly flat each time — persistent listings suggest the price (not the market) is what's stuck; bring a comps-based counter.
- Current owner paid $262k; list at $430k implies a 64% gain — meaningful room to come down on a strong offer.
Risks & watch-outs
- Watch-outs: flood insurance adds $427/mo.
- Climate carrying-cost: in FEMA flood zone AE (mandatory federal flood insurance); severe wind risk, 99% chance of damaging wind over 30y; extreme-heat days projected 7→22/yr by 2055 (HVAC capex compounding) — expect insurance premiums to compound above CPI over the hold.
Questions for the listing agent
- Can we see the unit-by-unit rent roll, current vacancy, and any below-market leases? What's the average tenancy length?
- What capital expenditures (roof, boiler, parking lot, exteriors) have been made in the last 5 years, and what's planned in the next 2?
- Built in 1970 — when were the roof, HVAC, electrical panel, plumbing, and water heater last replaced?
- What's the actual annual flood-insurance premium (NFIP or private), and is the property in a SFHA with mandatory coverage?
- Is there a deadline driving the sale (1031 exchange, divorce, estate, relocation)? That informs how much negotiation room exists.
- What's the average days-on-market for RENTAL listings here right now (not sales)? A rising rental-DOM trend means longer vacancies and softer asking-rent achievability than the comps imply.
- What's the recent tenant-quality profile in this submarket — average credit score on applications, eviction rate, late-payment / NSF rate, and stable-employment percentage? A property-management company in the area should have these aggregated.
- How much new apartment / multifamily construction is in the pipeline within 1–3 miles? Heavy new supply (>2% of stock underway) typically softens rents 12–24 months out; light construction supports rent growth.
Investment metrics
- 1% rule
- 1.33% ✓
- Cap rate
- 11.44%
- Cash-on-cash
- 18.40%
- DSCR
- 1.82
- GRM
- 6.3
CMA / ARV
- ARV (median comp)
- $403,130
- List price
- $429,900
- Delta
- 6.64%
- Verdict
- FAIR
- Comps
- 11 within 2.0 mi
Projected returns pro-forma
-3.0% appreciation · 0.0% rent growth · sell at horizon
- IRR
- 0.9%
- Equity multiple
- 1.03×
- Total profit
- $4,130
- Equity at exit
- $64,099
- IRR
- 7.2%
- Equity multiple
- 1.46×
- Total profit
- $55,952
- Equity at exit
- $37,170
Cash invested: $120,372 (down + closing). Projections, not guarantees.
Landlord ↔ Tenant lean methodology
- Overall (STATE)
- 90 Strongly Landlord-Friendly
- State Louisiana
- 90 Strongly Landlord-Friendly · R+12
- County
- — inherits STATE
- City
- — inherits STATE
ZIP-level market 70131
- Home prices YoY
- -12.0%
- Rents YoY
- -9.2%
- Active inventory
- 274
- Price-to-rent
- 25.1×
Monthly cashflow live
- Estimated rent
- $5,708 high interval (Pro) →
- Mortgage (P&I)
- −$2,254
- Tax from tax record
- −$230 /mo · $2,766/yr
- Insurance
- −$179
- Flood insurance flood zone
- −$427 /mo · $5,118/yr
- HOA
- −$0
- Vacancy / Maint / Mgmt
- −$1,199
- Net cashflow
- $1,419
Break-even live
4-unit breakdown (identical units grouped — click to expand)
| Units | Beds | Baths | Est. rent |
|---|---|---|---|
| 4× units | 3 | 2 | $5,708 |
| #1 | 3 | 2 | $1,427 |
| #2 | 3 | 2 | $1,427 |
| #3 | 3 | 2 | $1,427 |
| #4 | 3 | 2 | $1,427 |
| Total (4 units) | $5,708 | ||
UW: 25.0% down · 7.5% · 30yr · 1.5% tax · 5.0% vac · 8.0% maint · 8.0% mgmt
Financing live
Cash to close
- Down payment
- $107,475
- Closing costs
- $12,897
- Reserves months
- —
- Total cash needed
- —
Loan-product check · same deal, 3 products live
Conventional
25% down · 7.5% · 30yr
- Down + closing
- —
- Monthly P&I
- —
- Monthly cashflow
- —
- DSCR
- —
- Eligible?
- —
Personal DTI + credit; lowest rate.
DSCR
20% down · 8.5% · 30yr
- Down + closing
- —
- Monthly P&I
- —
- Monthly cashflow
- —
- DSCR
- —
- Eligible?
- —
No personal income docs; deal must DSCR.
Hard money
10% down · 12.0% · 12mo
- Down + closing
- —
- Monthly P&I
- —
- Monthly cashflow
- —
- DSCR
- —
- Eligible?
- —
Short-term bridge; refi at stabilization.
Listing history 32 events
-
2026-06-17days on market $429,900 Active 1 DOM
Show marketing remark (504 chars)
Calling all Investors!!! 4-Plex located in Algiers, the Westbank of New Orleans! Each unit is 3 bedroom, 2 full bathrooms, and two stories. Currently 3 of 4 units are leased and collecting $4,456 in total rents. Each unit includes Range/Oven and Refrigerator, and Washer/Dryer Hookups. Each unit is separately metered for Electric and water utilities. Great investment opportunity or chance to live in one unit, and rent the other 3! Great location for commuting, quick access to the GNO or Belle Chasse.
-
2026-06-16days on market $429,900 Active 61 DOM
-
2026-06-15days on market $429,900 Active 60 DOM
-
2026-06-13days on market $429,900 Active 58 DOM
-
2026-06-10days on market $429,900 Active 55 DOM
-
2026-06-09days on market $429,900 Active 54 DOM
-
2026-06-08days on market $429,900 Active 53 DOM
-
2026-06-07days on market $429,900 Active 52 DOM
-
2026-06-05days on market $429,900 Active 49 DOM
-
2026-06-03days on market $429,900 Active 48 DOM
-
2026-06-02days on market $429,900 Active 47 DOM
-
2026-06-01days on market $429,900 Active 46 DOM
-
2026-05-31days on market $429,900 Active 45 DOM
-
2026-04-16$429,900 Active 504-char remark
-
2026-04-16$429,900 Active 505-char remark
-
2026-03-24price $429,900
-
2026-03-24price $429,900
-
2025-12-03price $440,000
-
2025-12-03price $440,000
-
2025-10-15$450,000 Active
-
2019-08-30soldstatus $261,750
-
2019-08-29soldstatus $164,000 Closed
-
2019-07-31status Pending
-
2019-07-17$179,000 Active
-
2019-07-17$179,000
-
2019-02-28price $184,000
-
2018-11-15$184,000
-
2018-10-05historical
-
2018-08-30$197,000 Active
-
2018-08-30$197,000
-
1996-10-21soldstatus $65,250
-
1995-05-19soldstatus $115,000
ⓘ Source: listings_history table (triggers on properties + properties_extension) + one-shot
backfill from property_details.listing_events for pre-trigger history.
Tax reassessment forecast LA · Resets to sale price
- Current annual tax
- $2,766 · $230/mo
- Projected year-2 tax
- $2,766 · $230/mo
- Expected delta
- $0/yr ($0/mo · 0.0%)
ⓘ Screening estimate from a state-policy table — verify with the county assessor before closing.
Climate risk First Street
- Flood 9/10 Extreme FEMA zone AE · 76% chance over 30 yrs
- Wildfire 3/10 Moderate
- Heat 10/10 Extreme 7 d/yr ≥108°F today · 22 d/yr by 30 yrs out
- Wind 10/10 Extreme 99% chance of damaging wind over 30 yrs
- Air quality 2/10 Low 2 unhealthy d/yr today · 2 by 30 yrs out
Nearby sold comps map
Loading sold comps map…
Walkable amenities ~0.75 mi
Loading nearby amenities…
Taxation est. · year 1
- Rental income
- $68,496
- − Mortgage interest
- −$24,081
- − Property taxes
- −$2,766
- − Insurance
- −$7,268
- − Repairs & maintenance
- −$5,480
- − Management
- −$5,480
- − Depreciation
- −$12,506
- Taxable income
- $10,916
- Est. tax owed @ 24.0%
- −$2,620
- After-tax cash flow
- $14,405/yr
For passive investors: Depreciation is non-cash, so a rental often shows a tax loss while cash-flowing — sheltering income. Rental losses are passive: they offset passive income freely, and up to $25,000/yr can offset ordinary (W-2) income if you actively participate and your MAGI is under $100k (phasing out to $0 by $150k); unused losses carry forward. On sale, claimed depreciation is recaptured at up to 25%, and gains may owe capital-gains tax (a 1031 exchange can defer both). Figures are a year-1 estimate at your 24.0% rate — not tax advice; consult a CPA.
Schools (NCES district)
- District
- Orleans Parish
- NCES district ID
- 2201170
- Math proficiency
- 11% ▼ -52.00%
- Reading proficiency
- 27% ▼ -46.00%
- Median HH income
- $37,011
- Composite
- 15.78/100
- National rank
- #9271
- State rank
- #69 of 98 in LA
Livability — New Orleans
- Score
- 81/100
- State rank
- #3
- US rank
- #1383
Category grades
Schools grade is shown separately in the Schools card above.
Census & demographics
- Census place
- New Orleans, LA
- County
- Orleans Parish · 338,817 people
- City population
- 338,817
- Metro
- New Orleans-Metairie, LA
- Population (ZIP)
- 25,151
- Household income
- $62,389
- Rent vs Own
- Severe rent burden
- 707.0
Population outlook (Orleans County) Hauer SSP2
- Today (2025)
- 513,025 people
- By 2030
- 575,781 · +12.2%
- By 2040
- 700,174 · +36.5%
- By 2050
- 826,541 · +61.1%
- By 2075
- 1,123,374 · +119.0%
- By 2100
- 1,355,609 · +164.2%
Race, ethnicity, and origin ACS 2023
- Neighborhood character
- Diverse neighborhood (Simpson 0.57)
- Race & ethnicity
- Black 62% White 20% Hispanic / Latino 11% Two or more races 6% Asian 4%
- Hispanic origin (detail)
- Mexican 2% Dominican 2%
- Common ancestry
- Lithuanian 4% Hispanic 1%
- Foreign-born
- 8% · Canada, Vietnam, China
- Languages at home
- 86% English-only · Spanish 9% Vietnamese 2% French/Haitian/Cajun 1%
Political lean MEDSL · Orleans
- 2024 margin
- Solid D (+67.0) · D 82.2% · R 15.2% · Other 2.7%
- 2008→2024 swing
- +6.7pp toward D · 2008: 60.3pp · 2024: 67.0pp
- All cycles
- 2024: D+67.0 2020: D+68.2 2016: D+66.2 2012: D+62.5 2008: D+60.3
Not yet ingested
- Civics
- —
Market trends
- HPI YoY
- ▼ -28.08%
- Current HPI
- 206.7552
- Rent YoY
- ▼ -9.23%
- Metro
- New Orleans-Metairie, LA
- State GDP YoY
- ▲ 3.29%
- F500 in state
- 10
Industry mix (Fortune 500 HQ in LA)
| Industry | F500 HQs | Revenue |
|---|---|---|
| Telecommunications | 2 | $23B |
|
||
| Utilities | 1 | $12B |
|
||
| Wholesale / Distribution | 1 | $5B |
|
||
| Advertising | 1 | $2B |
|
||
Price history
+273.8% since first listed20 events — show timeline
- 2026-06-17 Listed $429,900 GSREIN
- 2026-06-17 Listed $429,900 AcadianaMLS
- 2026-04-16 Listed $429,900 AcadianaMLS
- 2026-03-24 Price Changed $429,900 AcadianaMLS
- 2026-03-24 Price Changed $429,900 GSREIN
- 2025-12-03 Price Changed $440,000 AcadianaMLS
- 2025-12-03 Price Changed $440,000 GSREIN
- 2025-10-15 Listed $450,000 AcadianaMLS
- 2019-08-30 Sold (Public Records) $261,750 Public Records
- 2019-08-29 Sold (MLS) $164,000 GSREIN
- 2019-07-31 Pending — GSREIN
- 2019-07-17 Listed $179,000 AcadianaMLS
- 2019-07-17 Listed $179,000 GSREIN
- 2019-02-28 Price Changed $184,000 GSREIN
- 2018-11-15 Listed $184,000 AcadianaMLS
- 2018-10-05 Listing Removed — GSREIN
- 2018-08-30 Listed $197,000 AcadianaMLS
- 2018-08-30 Listed $197,000 GSREIN
- 1996-10-21 Sold (Public Records) $65,250 Public Records
- 1995-05-19 Sold (Public Records) $115,000 Public Records
Property tax history
+0.9%/yrLatest (2026): $2,766 · +0.0% YoY. Source: county tax records.
Cash-flow waterfall
monthlySold comps — $/sqft
last 12 mo · ≤1 miLoading sold comps…