59 Powder Rd · Wellsville, MO
Flood risk 1/10 · Minimal
- FEMA flood zone
- X (unshaded)
- Chance of flooding over 30 yrs
- 0.0%
- Est. flood insurance / yr
- $473 – $860
Fire risk 3/10 · Minor
- Est. fire insurance / yr
- $1,054 – $1,958
Heat risk 3/10 · Minor
- Hot days now (above 108°F)
- 7 days/yr
- Hot days in 30 yrs
- 19 days/yr
Wind risk 2/10 · Minimal
- Chance of severe wind over 30 yrs
- 1.0%
Air-quality risk 1/10 · Minimal
- Unhealthy air days now
- 0 days/yr
- Unhealthy air days in 30 yrs
- 0 days/yr
Risk factors via First Street. Map © Google.
Why this score? — see what drove the B+ grade
The composite is a weighted blend of 9 inputs, each scored 0–100. Each bar is that input's sub-score; the figure is the points it added to the 100-point composite (weight × sub-score).
- Cash flow +30.0/30.0
- 1% rule +10.0/10.0
- DSCR +10.0/10.0
- ARV discount +7.5/15.0
- Appreciation +6.9/10.0
- Livability +3.2/5.0
- Schools +3.0/10.0
- Rent growth +2.5/5.0
- Condition / age +2.5/5.0
$65,000
🖨 Deal sheet 📄 Offer letter ✓ Due diligence
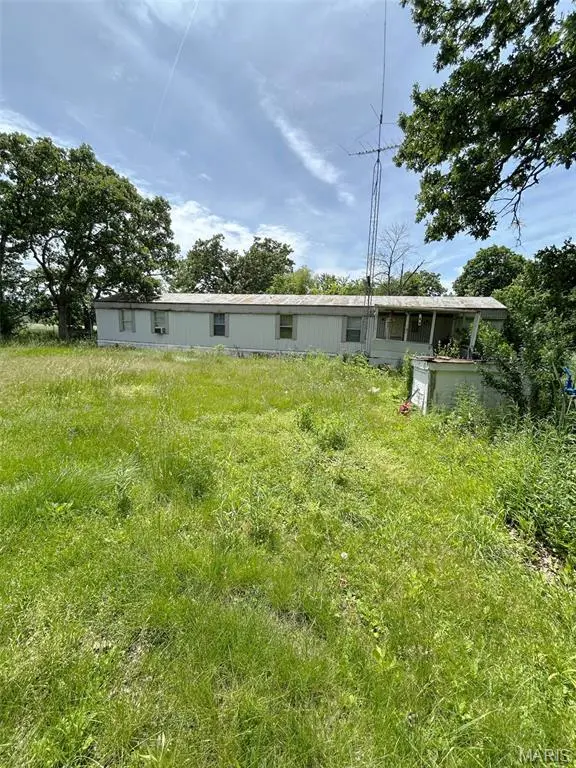
Listing remarks
Tucked away at the end of a gravel road, this 1.84 acre property offers the kind of privacy that's becoming increasingly difficult to find. The mobile home features a comfortable, livable interior and provides an affordable opportunity for full-time living, a weekend retreat, or a property to make your own over time. The long, secluded parcel offers room for outdoor activities, gardening, hobby projects, or simply enjoying a peaceful setting away from traffic and neighbors. Several outbuildings provide additional storage space for tools, equipment, and recreational items. The property is currently served by a deep well, lagoon, and leach field, with county water available nearby for future
Key facts
- Deep well
- 1.84 acre property
- Long secluded parcel
Tags
Property features AI
Exterior
- Parking: Three total parking spaces; One-car garage; Two-space carport
- Utilities: Public water; Lagoon sewer; Single-phase electric service; Electricity connected
- Home design: Residential mobile home; One level
- Construction: Construction materials: Unknown
- Exterior features: Rectangular lot; Approximately 1.84 acre lot
Interior
- Bedrooms: Three bedrooms, all on the main level
- Bathrooms: Two full bathrooms
- Heating & cooling: Electric heating; Wall/window air conditioning units
- Interior features: Seven total rooms
Neighborhood map
What this means for you Summary
Snapshot
- This is a 3-bed/2.0-bath other listed at $65k.
Deal economics
- At list price, monthly cash flow is $484 ($6k/yr) — positive.
- The deal already cash-flows at list — no discount required.
- Meets the 1% rule at list price ($1k rent vs $65k).
Location & tenants
- Location reads 65/100 on livability (#275 in MO) — a middle-class / working-renter tenant base. Strengths: crime A+, cost of living A+, housing A+; Watch: employment C-, amenities F, commute F.
- Wellsville Middletown R-I (rural): math 25% / reading 40% proficiency, ranked #433 of 535 in MO (top 81%) — families likely to look elsewhere, expect single-tenant / working-renter base with shorter leases.
- Zoned schools: Wellsville-Middletown Elem. (math 37% / reading 27%, grade F, #761 of 1,115 statewide, top 72%, 148 students, 60% FRL); Wellsville-Middletown Hs (math 37% / reading 42%, grade F, #247 of 521 statewide, top 55%, 163 students, 53% FRL).
- Market conditions: 10 active listings in the ZIP; 47 units permitted in Montgomery County in 2024 (0 in 5+ unit buildings).
Forward outlook
- In year one you build about $3k of equity ($449 loan paydown + $2k appreciation (3.9% local appreciation)).
- Montgomery County population projected at -31% by 2050 — secular population decline; favor cash flow + early exit over multi-decade hold.
- At projected returns (3.9% appreciation + 3.0% rent growth), your $18k cash investment doubles in ~3 years — after that, you're playing with house money.
Negotiation context
- Only 13 days on market — expect competitive offers; lowballing is unlikely to land.
Questions for the listing agent
- Is there a deadline driving the sale (1031 exchange, divorce, estate, relocation)? That informs how much negotiation room exists.
- Schools are F-rated, which usually means shorter tenancies and higher turnover. Who's the typical renter profile here, and what's been the actual vacancy rate?
- What's the average days-on-market for RENTAL listings here right now (not sales)? A rising rental-DOM trend means longer vacancies and softer asking-rent achievability than the comps imply.
- What's the recent tenant-quality profile in this submarket — average credit score on applications, eviction rate, late-payment / NSF rate, and stable-employment percentage? A property-management company in the area should have these aggregated.
- How much new for-sale + rental construction is in the pipeline within 1–3 miles? Heavy new supply typically softens prices + rents 12–24 months out; constrained supply supports both.
Investment metrics
- 1% rule
- 1.72% ✓
- Cap rate
- 15.23%
- Cash-on-cash
- 31.92%
- DSCR
- 2.42
- GRM
- 4.9
CMA / ARV
No comps found within radius.
Projected returns pro-forma
3.85% appreciation · 3.0% rent growth · sell at horizon
- IRR
- 39.1%
- Equity multiple
- 3.29×
- Total profit
- $41,608
- Equity at exit
- $32,371
- IRR
- 38.2%
- Equity multiple
- 6.57×
- Total profit
- $101,367
- Equity at exit
- $52,483
Cash invested: $18,200 (down + closing). Projections, not guarantees.
Landlord ↔ Tenant lean methodology
- Overall (STATE)
- 81 Strongly Landlord-Friendly
- State Missouri
- 81 Strongly Landlord-Friendly · R+10
- County
- — inherits STATE
- City
- — inherits STATE
ZIP-level market 63384
- Home prices YoY
- 2.8%
- Active inventory
- 10
- Price-to-rent
- 4.9×
Monthly cashflow live
- Estimated rent
- $1,116 medium interval (Pro) →
- Mortgage (P&I)
- −$341
- Tax from tax record
- −$29 /mo · $352/yr
- Insurance
- −$27
- HOA
- −$0
- Vacancy / Maint / Mgmt
- −$234
- Net cashflow
- $484
Break-even live
UW: 25.0% down · 7.5% · 30yr · 1.5% tax · 5.0% vac · 8.0% maint · 8.0% mgmt
Financing live
Cash to close
- Down payment
- $16,250
- Closing costs
- $1,950
- Reserves months
- —
- Total cash needed
- —
Loan-product check · same deal, 3 products live
Conventional
25% down · 7.5% · 30yr
- Down + closing
- —
- Monthly P&I
- —
- Monthly cashflow
- —
- DSCR
- —
- Eligible?
- —
Personal DTI + credit; lowest rate.
DSCR
20% down · 8.5% · 30yr
- Down + closing
- —
- Monthly P&I
- —
- Monthly cashflow
- —
- DSCR
- —
- Eligible?
- —
No personal income docs; deal must DSCR.
Hard money
10% down · 12.0% · 12mo
- Down + closing
- —
- Monthly P&I
- —
- Monthly cashflow
- —
- DSCR
- —
- Eligible?
- —
Short-term bridge; refi at stabilization.
Listing history 10 events
-
2026-06-18days on market $65,000 Active 13 DOM
-
2026-06-17days on market $65,000 Active 12 DOM
-
2026-06-16days on market $65,000 Active 11 DOM
-
2026-06-15days on market $65,000 Active 10 DOM
-
2026-06-13days on market $65,000 Active 8 DOM
-
2026-06-12days on market $65,000 Active 7 DOM
-
2026-06-09days on market $65,000 Active 4 DOM
-
2026-06-08days on market $65,000 Active 3 DOM
-
2026-06-07remarks 699-char remark
-
2026-06-07$65,000 Active 2 DOM
ⓘ Source: listings_history table (triggers on properties + properties_extension) + one-shot
backfill from property_details.listing_events for pre-trigger history.
Tax reassessment forecast MO · Resets to sale price
- Current annual tax
- $352 · $29/mo
- Projected year-2 tax
- $630 · $53/mo
- Expected delta
- +$278/yr (+$23/mo · 79.1%)
ⓘ Screening estimate from a state-policy table — verify with the county assessor before closing.
Climate risk First Street
- Flood 1/10 Low FEMA zone X (unshaded) · 0% chance over 30 yrs
- Wildfire 3/10 Moderate
- Heat 3/10 Moderate 7 d/yr ≥108°F today · 19 d/yr by 30 yrs out
- Wind 2/10 Low 100% chance of damaging wind over 30 yrs
- Air quality 1/10 Low 0 unhealthy d/yr today · 0 by 30 yrs out
Nearby sold comps map
Loading sold comps map…
Walkable amenities ~0.75 mi
Loading nearby amenities…
Taxation est. · year 1
- Rental income
- $13,389
- − Mortgage interest
- −$3,641
- − Property taxes
- −$352
- − Insurance
- −$325
- − Repairs & maintenance
- −$1,071
- − Management
- −$1,071
- − Depreciation
- −$1,891
- Taxable income
- $5,038
- Est. tax owed @ 24.0%
- −$1,209
- After-tax cash flow
- $4,601/yr
For passive investors: Depreciation is non-cash, so a rental often shows a tax loss while cash-flowing — sheltering income. Rental losses are passive: they offset passive income freely, and up to $25,000/yr can offset ordinary (W-2) income if you actively participate and your MAGI is under $100k (phasing out to $0 by $150k); unused losses carry forward. On sale, claimed depreciation is recaptured at up to 25%, and gains may owe capital-gains tax (a 1031 exchange can defer both). Figures are a year-1 estimate at your 24.0% rate — not tax advice; consult a CPA.
Schools (NCES district)
- District
- Wellsville Middletown R-I
- NCES district ID
- 2931620
- Math proficiency
- 25% ▼ -15.00%
- Reading proficiency
- 40% ▼ -5.00%
- Median HH income
- $38,226
- Composite
- 29.86/100
- National rank
- #11693
- State rank
- #433 of 535 in MO
Livability — Wellsville
- Score
- 65/100
- State rank
- #275
- US rank
- #12860
Category grades
Schools grade is shown separately in the Schools card above.
Census & demographics
- Population (ZIP)
- 2,148
Population outlook (Montgomery County) Hauer SSP2
- Today (2025)
- 10,582 people
- By 2030
- 9,897 · -6.5%
- By 2040
- 8,556 · -19.1%
- By 2050
- 7,293 · -31.1%
- By 2075
- 4,998 · -52.8%
- By 2100
- 3,204 · -69.7%
Race, ethnicity, and origin ACS 2023
- Neighborhood character
- Predominantly White (93%)
- Race & ethnicity
- White 93% Two or more races 6%
- Common ancestry
- Slovak 3%
- Languages at home
- 97% English-only · German/W. Germanic 2% French/Haitian/Cajun 1%
Political lean MEDSL · Montgomery
- 2024 margin
- Solid R (+60.1) · D 19.5% · R 79.7%
- 2008→2024 swing
- -41.7pp toward R · 2008: -18.5pp · 2024: -60.1pp
- All cycles
- 2024: R+60.1 2020: R+56.4 2016: R+55.4 2012: R+33.0 2008: R+18.5
Not yet ingested
- Civics
- —
Market trends
- HPI YoY
- ▲ 3.85%
- Current HPI
- 143.7565
- Rent YoY
- —
- Metro
- —
- State GDP YoY
- ▲ 1.84%
- F500 in state
- 20
Industry mix (Fortune 500 HQ in MO)
| Industry | F500 HQs | Revenue |
|---|---|---|
| Healthcare | 1 | $163B |
|
||
| Insurance | 1 | $21B |
|
||
| Industrial Technology | 1 | $17B |
|
||
| Retail | 1 | $16B |
|
||
| Industrial Distribution | 1 | $10B |
|
||
| Utilities | 1 | $9B |
|
||
Price history
1 event — show timeline
- 2026-06-05 Listed $65,000 MARIS as Distributed by MLS Grid
Property tax history
-0.8%/yrLatest (2025): $352 · -2.5% YoY. Source: county tax records.
Cash-flow waterfall
monthlySold comps — $/sqft
last 12 mo · ≤1 miLoading sold comps…