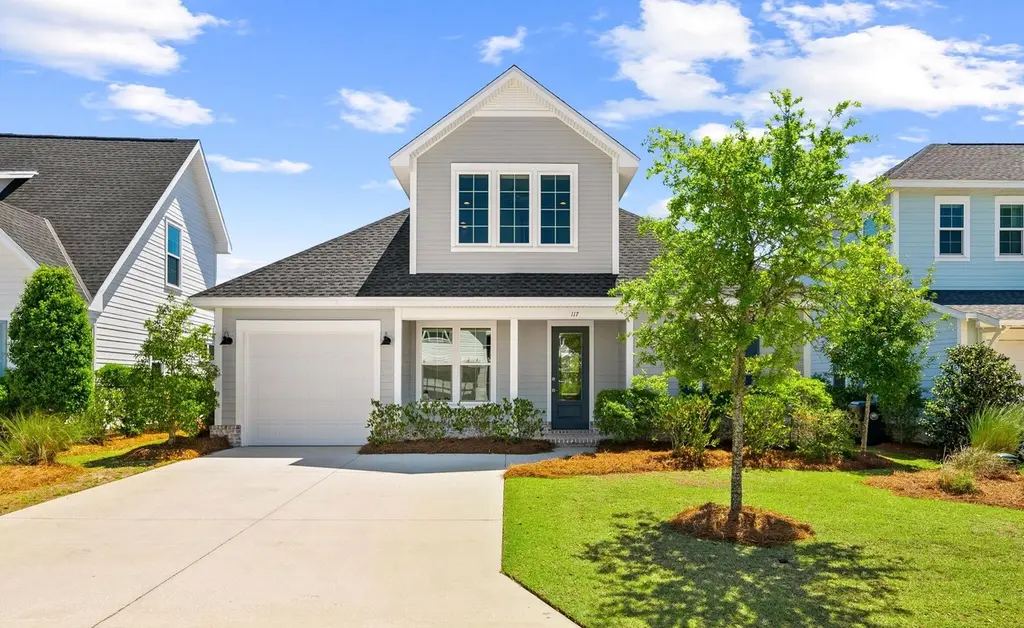
117 Roundwood Dr · Laguna Beach, FL
Flood risk 1/10 · Minimal
- FEMA flood zone
- X (unshaded)
- Chance of flooding over 30 yrs
- 0.0%
- Est. flood insurance / yr
- $507 – $1,088
Fire risk 6/10 · Moderate
- Est. fire insurance / yr
- $947 – $1,759
Heat risk 10/10 · Severe
- Hot days now (above 105°F)
- 7 days/yr
- Hot days in 30 yrs
- 21 days/yr
Wind risk 10/10 · Severe
- Chance of severe wind over 30 yrs
- 99.0%
Air-quality risk 2/10 · Minimal
- Unhealthy air days now
- 1 days/yr
- Unhealthy air days in 30 yrs
- 1 days/yr
Risk factors via First Street. Map © Google.
Why this score? — see what drove the D grade
The composite is a weighted blend of 9 inputs, each scored 0–100. Each bar is that input's sub-score; the figure is the points it added to the 100-point composite (weight × sub-score).
- ARV discount +10.5/15.0
- Cash flow +7.5/30.0
- Appreciation +7.0/10.0
- Schools +5.2/10.0
- Livability +3.7/5.0
- Rent growth +2.5/5.0
- Condition / age +2.5/5.0
- 1% rule +1.9/10.0
- DSCR +1.6/10.0
$649,900
🖨 Deal sheet (PDF) 📄 Offer letter ✓ Due diligence
Listing remarks
Welcome to Watersound Origins ''Coastal Cottage'', where charm & comfort come together. The only 2-story design of its kind in the Stillwater B community, thoughtfully crafted with 2-bdrms on the 1st flr + a 2nd-Master configuration encompassing the entire 2nd flr, offering flexibility & comfort across 3-bedrooms and 3-full baths. Perfectly sized--not too big and not too small, it's just right--featuring a 1-car garage, large, rear screened porch, & a spacious fenced-in backyard. Enjoy the Town Center w/ Publix, Starbucks and the resort-style amenities: pool, fitness center, Lake Powell access, golf, tennis, and miles of scenic walking/biking trails, all just minutes to the
Key facts
- Two-story design
- Lake powell access
- 4,680 sq ft lot
Tags
Property features AI
Finance
- HOA & community: Homeowners association with management; Association fees cover land recreation, recreational facilities and master association services; Community amenities include pool, clubhouse/community room, exercise room, playground, BBQ area, pavilion/gazebo, dock, fishing, golf, and pickleball; Short-term rentals not allowed
Exterior
- Parking: Attached garage (1-car)
- Utilities: Public water; Public sewer; Electric service; Natural gas available; Phone and TV cable
- Home design: Florida Cottage style; 2 stories; Built in 2021; Private road frontage; Interior lot with covenants and restrictions
- Construction: Brick and cement fiberboard siding; Shake roof; County records for building area
- Exterior features: Private yard; Sprinkler system; Screened porch; Community pool
Interior
- Kitchen: Dishwasher; Disposal; Microwave; Refrigerator; Pantry
- Bedrooms: 3 bedrooms total; Primary suite(s) on first and second floors; Primary bedroom with walk-in closet
- Flooring: Vinyl flooring
- Bathrooms: 3 full bathrooms; Primary bathroom with shower (no tub)
- Heating & cooling: Central air conditioning; Ceiling fans; Natural gas heating
- Interior features: Breakfast bar; Crown molding; Recessed lighting; Pantry; Built-in shelving; Window treatments; Unfurnished
- Laundry & utility: Washer; Dryer; Gas water heater
Neighborhood map
What this means for you Summary
Snapshot
- This is a 3-bed/3.0-bath single-family listed at $650k.
Deal economics
- At list price, monthly cash flow is $-811 ($-10k/yr) — negative.
- To cash-flow at today's rent, offer at most $507k (22.0% below list).
- To meet the 1% rule (rent ≥ 1% of price), the offer needs to be $445k (31.5% below list).
- Recommended offer: $445k (31.5% below list) — sets the bar for 1% rule.
- Cap rate 4.8% vs local median 0.9% in Laguna Beach — top-decile yield for the area; either an underpriced asset or a hidden risk that comps aren't pricing in. Stress-test before assuming the spread holds.
Location & tenants
- Location reads 74/100 on livability (#283 in FL, #4,522 nationally) — a middle-class / working-renter tenant base. Strengths: crime A+, housing A+, employment A; Watch: amenities F.
- Walton (rural): math 62% / reading 61% proficiency, ranked #10 of 73 in FL (top 14%) — acceptable for families but not a draw, mixed tenant base, ~2y average lease.
- Zoned schools: Dune Lakes Elementary School (math 74% / reading 68%, grade A-, #320 of 2,144 statewide, top 15%, 928 students, 24% FRL); Emerald Coast Middle School (math 70% / reading 65%, grade A-, #77 of 571 statewide, top 14%, 868 students, 24% FRL); South Walton High School (math 61% / reading 73%, grade B, #69 of 667 statewide, top 11%, 1,235 students, 20% FRL) — zoned schools average 22% FRL vs 48% district-wide (26 pts lower); this property's tenant base skews higher-income than the district average.
- Market conditions: 723 active listings in the ZIP; 11 comparable units currently listed for rent nearby; rentals at typical pace (median 23d on market — plan ~3-4 weeks tenant-placement turnaround); high-income renter base; 2,883 units permitted in Walton County in 2024 (1,322 in 5+ unit buildings).
- This rent runs 37% of the median local income ($146k/yr) — at the standard rent-burdened threshold; future hikes will face affordability resistance.
Forward outlook
- In year one you build about $31k of equity ($4k loan paydown + $26k appreciation (4.1% local appreciation)).
- Walton County population projected at +46% by 2050 — long-run rental-demand tailwind backs the buy-and-hold thesis.
- By year 2, paydown + projected appreciation supports a ~$50k cash-out refi (75% LTV) — recoverable capital for the next deal without selling this one.
Negotiation context
- It's been on market 71 days — a 6% lower offer ($611k) is reasonable based on typical stale-listing flexibility.
- 3 sale attempts with the ask held roughly flat each time — persistent listings suggest the price (not the market) is what's stuck; bring a comps-based counter.
Risks & watch-outs
- Climate carrying-cost: severe wind risk, 99% chance of damaging wind over 30y; major wildfire risk; extreme-heat days projected 7→21/yr by 2055 (HVAC capex compounding) — expect insurance premiums to compound above CPI over the hold.
Questions for the listing agent
- What do current leases actually rent for vs. the listed asking? Can we see a recent rent roll and the last 12 months of T-12 income?
- It's been on market 71 days. Have you received any prior offers? Is the seller open to a 31% concession, seller financing, or rate buy-down credit?
- What does the HOA fee cover, when was the last increase, and are there any pending special assessments or reserve-fund shortfalls?
- Why hasn't it sold? Are there any deal-killer items the seller is aware of (foundation, flood, title, zoning, code violations)?
- Is there a deadline driving the sale (1031 exchange, divorce, estate, relocation)? That informs how much negotiation room exists.
- Schools are F-rated, which usually means shorter tenancies and higher turnover. Who's the typical renter profile here, and what's been the actual vacancy rate?
- The area grade is low — what's the realistic commute time and amenity access for the typical tenant pool here? Any planned neighborhood developments (good or bad) we should know about?
- What's the average days-on-market for RENTAL listings here right now (not sales)? A rising rental-DOM trend means longer vacancies and softer asking-rent achievability than the comps imply.
- What's the recent tenant-quality profile in this submarket — average credit score on applications, eviction rate, late-payment / NSF rate, and stable-employment percentage? A property-management company in the area should have these aggregated.
- How much new for-sale + rental construction is in the pipeline within 1–3 miles? Heavy new supply typically softens prices + rents 12–24 months out; constrained supply supports both.
Investment metrics
- 1% rule
- 0.69% ✗
- Cap rate
- 4.80%
- Cash-on-cash
- -5.35%
- DSCR
- 0.76
- GRM
- 12.2
CMA / ARV
- ARV (on-the-fly)
- $696,198
- Comps found
- 12
Show comp detail 12 sales within ~0.75 mi
| Address | Dist | Beds/Ba | Sqft | Sold | Price | $/sf | Match |
|---|---|---|---|---|---|---|---|
| 63 Windrow Way | 0.13mi | 3/2.0 | 1,725 (-2%) | 0mo | $650,000 | $377 | 86 |
| 304 Windrow Way | 0.11mi | 4/3.5 (+1) | 1,832 (+4%) | 4mo | $678,000 | $370 | 79 |
| 128 Ravine Rd | 0.46mi | 3/2.0 | 1,715 (-3%) | 1mo | $650,000 | $379 | 69 |
| 81 Windrow Way | 0.12mi | 3/2.0 | 1,550 (-12%) | 1mo | $589,999 | $381 | 69 |
| 91 Catface Dr | 0.20mi | 3/3.0 | 2,030 (+15%) | 1mo | $820,000 | $404 | 65 |
| 1545 Pathways Dr | 0.38mi | 2/2.0 (-1) | 1,674 (-5%) | 1mo | $651,500 | $389 | 64 |
| 253 Windrow Way | 0.16mi | 3/2.5 | 2,026 (+15%) | 3mo | $715,000 | $353 | 63 |
| 1659 Pathways Dr | 0.51mi | 3/2.0 | 1,674 (-5%) | 1mo | $659,990 | $394 | 63 |
| 102 Firefly Way | 0.41mi | 3/3.0 | 1,944 (+10%) | 3mo | $835,000 | $430 | 62 |
| 77 Cannonball Ln Lot (174) | 0.49mi | 3/3.0 | 1,950 (+10%) | 4mo | $797,000 | $409 | 56 |
| 131 Cannonball Ln | 0.52mi | 3/3.0 | 1,990 (+13%) | 5mo | $850,000 | $427 | 50 |
| 1886 Pathways Dr | 0.66mi | 3/2.0 | 1,960 (+11%) | 3mo | $892,500 | $455 | 45 |
Match score weights: distance 35% · size 25% · config 20% · recency 20%. Top-matched comps best support the ARV.
Projected returns pro-forma
4.06% appreciation · 3.0% rent growth · sell at horizon
- IRR
- 5.7%
- Equity multiple
- 1.35×
- Total profit
- $63,917
- Equity at exit
- $331,896
- IRR
- 8.3%
- Equity multiple
- 2.41×
- Total profit
- $255,940
- Equity at exit
- $544,757
Cash invested: $181,972 (down + closing). Projections, not guarantees.
Landlord ↔ Tenant lean methodology
- Overall (STATE)
- 87 Strongly Landlord-Friendly
- State Florida
- 87 Strongly Landlord-Friendly · R+3
- County
- — inherits STATE
- City
- — inherits STATE
ZIP-level market 32461
- Home prices YoY
- 1.2%
- Active inventory
- 723
- Price-to-rent
- 12.2×
Monthly cashflow live
- Estimated rent
- $4,453 high interval (Pro) →
- Mortgage (P&I)
- −$3,408
- Tax from tax record
- −$416 /mo · $4,987/yr
- Insurance
- −$271
- HOA
- −$234
- Vacancy / Maint / Mgmt
- −$935
- Net cashflow
- $-811
Break-even live
Sensitivity live
| Price | -10% $-443 | -5% $-627 | +0% $-811 | +5% $-995 | +10% $-1,179 |
|---|---|---|---|---|---|
| Rent | -10% $-1,162 | -5% $-987 | +0% $-811 | +5% $-635 | +10% $-459 |
| Rate | -1.0pp $-483 | -0.5pp $-645 | base $-811 | +0.5pp $-979 | +1.0pp $-1,150 |
UW: 25.0% down · 7.5% · 30yr · 1.5% tax · 5.0% vac · 8.0% maint · 8.0% mgmt
Financing live
Cash to close
- Down payment
- $162,475
- Closing costs
- $19,497
- Reserves months
- —
- Total cash needed
- —
Loan-product check · same deal, 3 products live
Conventional
25% down · 7.5% · 30yr
- Down + closing
- —
- Monthly P&I
- —
- Monthly cashflow
- —
- DSCR
- —
- Eligible?
- —
Personal DTI + credit; lowest rate.
DSCR
20% down · 8.5% · 30yr
- Down + closing
- —
- Monthly P&I
- —
- Monthly cashflow
- —
- DSCR
- —
- Eligible?
- —
No personal income docs; deal must DSCR.
Hard money
10% down · 12.0% · 12mo
- Down + closing
- —
- Monthly P&I
- —
- Monthly cashflow
- —
- DSCR
- —
- Eligible?
- —
Short-term bridge; refi at stabilization.
Rent comps 11 comps
| Address | Beds | Baths | Sqft | Rent | $/sqft | DOM | Units | Dist |
|---|---|---|---|---|---|---|---|---|
| 263 Windrow Way Inlet Beach, FL | 4.0 | 3.5 | 2352 | $5,200 | $2.21 | 23d | 1 | 0.14mi |
| 48 E Lafayette Rd Inlet Beach, FL | 3.0 | 2.0 | 1700 | $3,700 | $2.18 | 15d | 1 | 0.53mi |
| 117 River Rise Way Inlet Beach, FL | 2.0 | 2.0 | 1952 | $4,950 | $2.54 | 15d | 1 | 0.75mi |
| 7 Barbados Ln Inlet Beach, FL | 3.0 | 2.5 | 1563 | $2,900 | $1.86 | 23d | 1 | 1.21mi |
| 7 Barbados Ln Inlet Beach, FL | 3.0 | 2.5 | 1563 | $2,900 | $1.86 | 15d | 1 | 1.21mi |
| 104 Sandpine Loop Inlet Beach, FL | 4.0 | 3.0 | 1884 | $3,400 | $1.80 | 23d | 1 | 1.24mi |
| 122 Sandpine Loop Inlet Beach, FL | 4.0 | 2.5 | 1934 | $3,000 | $1.55 | 23d | 1 | 1.26mi |
| 24 Beach View Dr Unit 1447117P Inlet Beach, FL | 4.0 | 3.0 | 2303 | $4,469 | $1.94 | 23d | 1 | 1.35mi |
| 17 Sunset Key Ct Unit 1447176P Inlet Beach, FL | 4.0 | 3.0 | 2088 | $2,962 | $1.42 | 23d | 1 | 1.37mi |
| 323 Suwannee Dr Inlet Beach, FL | 2.0 | 2.0 | 1442 | $3,500 | $2.43 | 15d | 1 | 1.46mi |
| 323 Suwannee Dr Unit 72A Inlet Beach, FL | 2.0 | 2.0 | 1442 | $4,000 | $2.77 | 23d | 1 | 1.47mi |
HOA detail
- Monthly dues
- $234 · $2,808/yr
- Likely covers
- waterpoolgym
Listing history 21 events
-
2026-06-21days on market $649,900 Active 71 DOM
-
2026-06-18days on market $649,900 Active 68 DOM
-
2026-06-17days on market $649,900 Active 67 DOM
-
2026-06-16days on market $649,900 Active 66 DOM
-
2026-06-15days on market $649,900 Active 65 DOM
-
2026-06-14days on market $649,900 Active 63 DOM
-
2026-06-13days on market $649,900 Active 62 DOM
-
2026-06-10days on market $649,900 Active 60 DOM
-
2026-06-09days on market $649,900 Active 59 DOM
-
2026-06-08days on market $649,900 Active 58 DOM
-
2026-06-07days on market $649,900 Active 57 DOM
-
2026-06-05days on market $649,900 Active 54 DOM
-
2026-06-03days on market $649,900 Active 53 DOM
-
2026-06-03days on market $649,900 Active 52 DOM
-
2026-06-01days on market $649,900 Active 51 DOM
-
2026-05-31days on market $649,900 Active 50 DOM
-
2026-05-30days on market $649,900 Active 49 DOM
-
2026-04-11$649,900 Active
-
2026-04-02$4,500
-
2026-04-02historical $4,500
-
2026-02-13$4,500
ⓘ Source: listings_history table (triggers on properties + properties_extension) + one-shot
backfill from property_details.listing_events for pre-trigger history.
Tax reassessment forecast FL · Resets to sale price
- Current annual tax
- $4,987 · $416/mo
- Projected year-2 tax
- $5,394 · $450/mo
- Expected delta
- +$407/yr (+$34/mo · 8.2%)
ⓘ Screening estimate from a state-policy table — verify with the county assessor before closing.
Climate risk First Street
- Flood 1/10 Low FEMA zone X (unshaded) · 0% chance over 30 yrs
- Wildfire 6/10 Major
- Heat 10/10 Extreme 7 d/yr ≥105°F today · 21 d/yr by 30 yrs out
- Wind 10/10 Extreme 99% chance of damaging wind over 30 yrs
- Air quality 2/10 Low 1 unhealthy d/yr today · 1 by 30 yrs out
Nearby sold comps map
Loading sold comps map…
Walkable amenities ~0.75 mi
Loading nearby amenities…
Taxation est. · year 1
- Rental income
- $53,435
- − Mortgage interest
- −$36,405
- − Property taxes
- −$4,987
- − Insurance
- −$3,250
- − Repairs & maintenance
- −$4,275
- − Management
- −$4,275
- − HOA
- −$2,808
- − Depreciation
- −$18,906
- Taxable loss
- −$21,469
- Est. tax savings @ 24.0%
- +$5,153
- After-tax cash flow
- $-4,575/yr
For passive investors: Depreciation is non-cash, so a rental often shows a tax loss while cash-flowing — sheltering income. Rental losses are passive: they offset passive income freely, and up to $25,000/yr can offset ordinary (W-2) income if you actively participate and your MAGI is under $100k (phasing out to $0 by $150k); unused losses carry forward. On sale, claimed depreciation is recaptured at up to 25%, and gains may owe capital-gains tax (a 1031 exchange can defer both). Figures are a year-1 estimate at your 24.0% rate — not tax advice; consult a CPA.
Schools (NCES district)
- District
- Walton
- NCES district ID
- 1201980
- Math proficiency
- 62% ▼ -4.00%
- Reading proficiency
- 61% ▼ -2.00%
- Median HH income
- $46,794
- Composite
- 52.03/100
- National rank
- #1634
- State rank
- #10 of 73 in FL
Livability — Laguna Beach
- Score
- 74/100
- State rank
- #283
- US rank
- #4522
Category grades
Schools grade is shown separately in the Schools card above.
Census & demographics
- County
- Walton County · 70,839 people
- Metro
- Crestview-Fort Walton Beach-Destin, FL
- Population (ZIP)
- 3,757
- Household income
- $145,706
- Rent vs Own
- Severe rent burden
- 67.0
Population outlook (Walton County) Hauer SSP2
- Today (2025)
- 80,014 people
- By 2030
- 88,120 · +10.1%
- By 2040
- 103,537 · +29.4%
- By 2050
- 117,034 · +46.3%
- By 2075
- 143,901 · +79.8%
- By 2100
- 155,138 · +93.9%
Race, ethnicity, and origin ACS 2023
- Neighborhood character
- Predominantly White (90%)
- Race & ethnicity
- White 90% Two or more races 6% Hispanic / Latino 3% Black 2% Asian 1%
- Common ancestry
- Slovak 4% Lithuanian 4% Portuguese 3%
- Foreign-born
- 8% · Canada
- Languages at home
- 94% English-only · Spanish 5% Other Asian/Pacific 1% Russian/Polish/Slavic 1%
Political lean MEDSL · Walton
- 2024 margin
- Solid R (+57.8) · D 20.7% · R 78.6%
- 2008→2024 swing
- -12.0pp toward R · 2008: -45.8pp · 2024: -57.8pp
- All cycles
- 2024: R+57.8 2020: R+51.7 2016: R+56.1 2012: R+52.0 2008: R+45.8
Not yet ingested
- Civics
- —
Market trends
- HPI YoY
- ▲ 4.06%
- Current HPI
- 346.4019
- Rent YoY
- —
- Metro
- Crestview-Fort Walton Beach-Destin, FL
- State GDP YoY
- ▲ 3.28%
- F500 in state
- 36
Industry mix (Fortune 500 HQ in FL)
| Industry | F500 HQs | Revenue |
|---|---|---|
| Industrial Technology | 2 | $29B |
|
||
| Insurance | 2 | $17B |
|
||
| Retail | 1 | $60B |
|
||
| Technology Distribution | 1 | $58B |
|
||
| Homebuilding | 1 | $35B |
|
||
| Technology Manufacturing | 1 | $35B |
|
||
Price history
+14342.2% since first listed4 events — show timeline
- 2026-04-11 Listed $649,900 ECAR
- 2026-04-02 Listed for Rent $4,500 ECAR
- 2026-04-02 Rental Removed $4,500 ECAR
- 2026-02-13 Listed for Rent $4,500 ECAR
Property tax history
+45.0%/yrLatest (2025): $4,987 · -5.7% YoY. Source: county tax records.
Cash-flow waterfall
monthlySold comps — $/sqft
last 12 mo · ≤1 miLoading sold comps…