 🏗️ New Construction
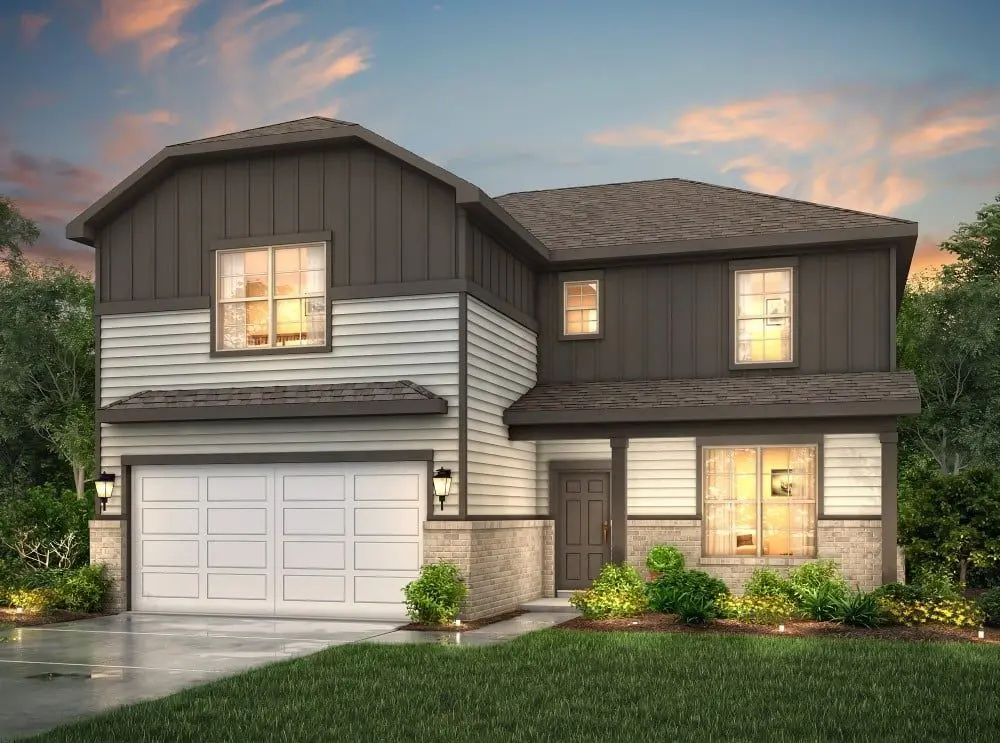
24742 Zinnia Blossom Dr · Montgomery, TX
Flood risk 1/10 · Minimal
- FEMA flood zone
- X (unshaded)
- Chance of flooding over 30 yrs
- 0.0%
- Est. flood insurance / yr
- $507 – $1,088
Fire risk 5/10 · Moderate
- Est. fire insurance / yr
- $1,222 – $2,270
Heat risk 8/10 · Major
- Hot days now (above 112°F)
- 7 days/yr
- Hot days in 30 yrs
- 24 days/yr
Wind risk 8/10 · Major
- Chance of severe wind over 30 yrs
- 99.0%
Air-quality risk 2/10 · Minimal
- Unhealthy air days now
- 1 days/yr
- Unhealthy air days in 30 yrs
- 2 days/yr
Risk factors via First Street. Map © Google.
Why this score? — see what drove the F grade
The composite is a weighted blend of 9 inputs, each scored 0–100. Each bar is that input's sub-score; the figure is the points it added to the 100-point composite (weight × sub-score).
- ARV discount +7.5/15.0
- Schools +5.4/10.0
- Cash flow +4.6/30.0
- Livability +3.5/5.0
- Rent growth +2.6/5.0
- Condition / age +2.5/5.0
- 1% rule +0.7/10.0
- DSCR +0.0/10.0
- Appreciation +0.0/10.0
$352,900
🖨 Deal sheet (PDF) 📄 Offer letter ✓ Due diligence
Listing remarks
With over 3,000 square feet, the Sinclair boasts abundant space for private living and entertaining. This plan welcomes you with a charming columned front porch, leading you into a welcoming foyer. Directly off the foyer, a secluded study boasts a walk-in closet. Beyond the foyer, you'll love an open-concept living area that features an inviting kitchen—boasting a center island and corner pantry—an elegant dining area and a spacious great room. Anchoring the home, a convenient downstairs primary suite features its own attached bath and an expansive walk-in closet. Additional main-floor highlights include a valet entry off the 2-bay garage and a patio off the dining area. On the
Key facts
- Secluded study
- Corner pantry
- Columned front porch
Tags
Property features AI
Finance
- HOA & community: Community association managed by Inframark; Annual association fee of $550; Community pool
Exterior
- Parking: Attached 2-car garage
- Utilities: Public water; Public sewer
- Home design: Residential property; Under construction (new construction); Slab foundation; Composition roof
- Construction: Brick and cement siding exterior; Built in 2026
- Exterior features: Deck; Porch; Patio; Private yard; Subdivision lot
Interior
- Kitchen: Dishwasher; Gas oven; Microwave; ENERGY STAR qualified appliances
- Bedrooms: Primary bedroom on first floor; Additional bedrooms on second floor (3); Office on first floor; Total rooms: 6; Game room on second floor
- Flooring: Carpet; Plank; Tile; Vinyl
- Bathrooms: 3 full bathrooms; 1 half bathroom
- Heating & cooling: Central heating (gas); Central air (electric)
- Interior features: Breakfast bar; Kitchen island; Kitchen/family room combo; Primary bathroom; Pantry; Quartz counters; Tub/shower combination; Ceiling fans; Loft; Programmable thermostat; Low emissivity windows
- Laundry & utility: Gas dryer hookup; Tankless water heater
Neighborhood map
What this means for you Summary
Snapshot
- This is a 4-bed/3.5-bath land listed at $353k.
Deal economics
- At list price, monthly cash flow is $-1k ($-13k/yr) — negative.
- To cash-flow at today's rent, offer at most $269k (23.8% below list).
- To meet the 1% rule (rent ≥ 1% of price), the offer needs to be $241k (31.7% below list).
- Recommended offer: $241k (31.7% below list) — sets the bar for 1% rule.
- Cap rate 3.3% vs local median 2.0% in Montgomery — top-decile yield for the area; either an underpriced asset or a hidden risk that comps aren't pricing in. Stress-test before assuming the spread holds.
Location & tenants
- Location reads 70/100 on livability (#372 in TX) — a middle-class / working-renter tenant base. Strengths: crime A+, employment A+, housing A+; Watch: amenities F, commute F, health & safety F.
- Montgomery ISD (rural): math 63% / reading 57% proficiency, ranked #49 of 826 in TX (top 6%) — acceptable for families but not a draw, mixed tenant base, ~2y average lease.
- Zoned schools: Lone Star El (math 57% / reading 61%, grade B-, #455 of 4,322 statewide, top 11%, 766 students, 16% FRL); Montgomery J H (math 68% / reading 54%, grade B+, #145 of 1,662 statewide, top 9%, 1,045 students, 30% FRL); Lake Creek H S (math 53% / reading 68%, grade C+, #268 of 1,632 statewide, top 17%, 1,649 students, 23% FRL) — zoned schools at 23% FRL track the district average.
- Market conditions: Rents flat; 2304 active listings in the ZIP; high-income renter base; 13,259 units permitted in Montgomery County in 2024 (1,402 in 5+ unit buildings).
Forward outlook
- Local home prices are declining (-3.0%/yr); year-one equity from $3k of loan paydown is wiped out by about $13k of value loss. Plan a longer hold.
- Montgomery County population projected at +65% by 2050 — long-run rental-demand tailwind backs the buy-and-hold thesis.
Negotiation context
- It's been on market 35 days — a 3% lower offer ($342k) is reasonable based on typical stale-listing flexibility.
Risks & watch-outs
- Climate carrying-cost: severe wind risk, 99% chance of damaging wind over 30y; moderate wildfire risk; extreme-heat days projected 7→24/yr by 2055 (HVAC capex compounding) — expect insurance premiums to compound above CPI over the hold.
Questions for the listing agent
- What do current leases actually rent for vs. the listed asking? Can we see a recent rent roll and the last 12 months of T-12 income?
- It's been on market 35 days. Have you received any prior offers? Is the seller open to a 32% concession, seller financing, or rate buy-down credit?
- What does the HOA fee cover, when was the last increase, and are there any pending special assessments or reserve-fund shortfalls?
- Is there a deadline driving the sale (1031 exchange, divorce, estate, relocation)? That informs how much negotiation room exists.
- Schools are B-rated — typically a magnet for longer-tenancy family renters. What's the average tenant stay here, and is there a school-zone premium baked into asking?
- The area grade is low — what's the realistic commute time and amenity access for the typical tenant pool here? Any planned neighborhood developments (good or bad) we should know about?
- What's the average days-on-market for RENTAL listings here right now (not sales)? A rising rental-DOM trend means longer vacancies and softer asking-rent achievability than the comps imply.
- What's the recent tenant-quality profile in this submarket — average credit score on applications, eviction rate, late-payment / NSF rate, and stable-employment percentage? A property-management company in the area should have these aggregated.
- How much new for-sale + rental construction is in the pipeline within 1–3 miles? Heavy new supply typically softens prices + rents 12–24 months out; constrained supply supports both.
Investment metrics
- 1% rule
- 0.57% ✗
- Cap rate
- 3.28%
- Cash-on-cash
- -10.76%
- DSCR
- 0.52
- GRM
- 14.6
CMA / ARV
- ARV (median comp)
- $422,211
- List price
- $352,900
- Delta
- -16.42%
- Verdict
- UNDERPRICED
- Comps
- 4 within 1.0 mi
Projected returns pro-forma
-3.0% appreciation · 0.4% rent growth · sell at horizon
- IRR
- -38.7%
- Equity multiple
- -0.20×
- Total profit
- $-142,031
- Equity at exit
- $62,953
- IRR
- -79.0%
- Equity multiple
- -0.98×
- Total profit
- $-234,310
- Equity at exit
- $36,505
Cash invested: $118,219 (down + closing). Projections, not guarantees.
Landlord ↔ Tenant lean methodology
- Overall (STATE)
- 87 Strongly Landlord-Friendly
- State Texas
- 87 Strongly Landlord-Friendly · R+5
- County
- — inherits STATE
- City
- — inherits STATE
ZIP-level market 77316
- Home prices YoY
- -10.7%
- Rents YoY
- 0.4%
- Active inventory
- 2304
- Price-to-rent
- 12.2×
Monthly cashflow live
- Estimated rent
- $2,409 medium interval (Pro) →
- Mortgage (P&I)
- −$2,214
- Tax est. 1.5%
- −$528 /mo · $6,333/yr
- Insurance
- −$176
- HOA
- −$46
- Lot rent
- −$0
- Vacancy / Maint / Mgmt
- −$506
- Net cashflow
- $-1,060
Break-even live
Sensitivity live
| Price | -10% $-769 | -5% $-914 | +0% $-1,060 | +5% $-1,206 | +10% $-1,352 |
|---|---|---|---|---|---|
| Rent | -10% $-1,251 | -5% $-1,156 | +0% $-1,060 | +5% $-965 | +10% $-870 |
| Rate | -1.0pp $-848 | -0.5pp $-953 | base $-1,060 | +0.5pp $-1,170 | +1.0pp $-1,281 |
UW: 25.0% down · 7.5% · 30yr · 1.5% tax · 5.0% vac · 8.0% maint · 8.0% mgmt
Financing live
Cash to close
- Down payment
- $105,553
- Closing costs
- $12,666
- Reserves months
- —
- Total cash needed
- —
Loan-product check · same deal, 3 products live
Conventional
25% down · 7.5% · 30yr
- Down + closing
- —
- Monthly P&I
- —
- Monthly cashflow
- —
- DSCR
- —
- Eligible?
- —
Personal DTI + credit; lowest rate.
DSCR
20% down · 8.5% · 30yr
- Down + closing
- —
- Monthly P&I
- —
- Monthly cashflow
- —
- DSCR
- —
- Eligible?
- —
No personal income docs; deal must DSCR.
Hard money
10% down · 12.0% · 12mo
- Down + closing
- —
- Monthly P&I
- —
- Monthly cashflow
- —
- DSCR
- —
- Eligible?
- —
Short-term bridge; refi at stabilization.
HOA detail
- Monthly dues
- $46 · $552/yr
Listing history 18 events
-
2026-06-22days on market $352,900 Active 35 DOM
-
2026-06-21days on market $352,900 Active 34 DOM
-
2026-06-18days on market $352,900 Active 31 DOM
-
2026-06-17days on market $352,900 Active 30 DOM
-
2026-06-16days on market $352,900 Active 29 DOM
-
2026-06-15days on market $352,900 Active 28 DOM
-
2026-06-13days on market $352,900 Active 26 DOM
-
2026-06-13days on market $352,900 Active 25 DOM
-
2026-06-09days on market $352,900 Active 22 DOM
-
2026-06-08days on market $352,900 Active 21 DOM
-
2026-06-07days on market $352,900 Active 20 DOM
-
2026-06-04days on market $352,900 Active 17 DOM
-
2026-06-03days on market $352,900 Active 16 DOM
-
2026-06-02days on market $352,900 Active 15 DOM
-
2026-06-01days on market $352,900 Active 14 DOM
-
2026-05-31days on market $352,900 Active 13 DOM
-
2026-05-18$352,900 Active 835-char remark
-
2026-04-29$352,900 Active 793-char remark
ⓘ Source: listings_history table (triggers on properties + properties_extension) + one-shot
backfill from property_details.listing_events for pre-trigger history.
Climate risk First Street
- Flood 1/10 Low FEMA zone X (unshaded) · 0% chance over 30 yrs
- Wildfire 5/10 Major
- Heat 8/10 Severe 7 d/yr ≥112°F today · 24 d/yr by 30 yrs out
- Wind 8/10 Severe 99% chance of damaging wind over 30 yrs
- Air quality 2/10 Low 1 unhealthy d/yr today · 2 by 30 yrs out
Nearby sold comps map
Loading sold comps map…
Walkable amenities ~0.75 mi
Loading nearby amenities…
Taxation est. · year 1
- Rental income
- $28,913
- − Mortgage interest
- −$23,650
- − Property taxes
- −$6,333
- − Insurance
- −$2,111
- − Repairs & maintenance
- −$2,313
- − Management
- −$2,313
- − HOA
- −$552
- − Depreciation
- −$12,282
- Taxable loss
- −$20,642
- Est. tax savings @ 24.0%
- +$4,954
- After-tax cash flow
- $-7,770/yr
For passive investors: Depreciation is non-cash, so a rental often shows a tax loss while cash-flowing — sheltering income. Rental losses are passive: they offset passive income freely, and up to $25,000/yr can offset ordinary (W-2) income if you actively participate and your MAGI is under $100k (phasing out to $0 by $150k); unused losses carry forward. On sale, claimed depreciation is recaptured at up to 25%, and gains may owe capital-gains tax (a 1031 exchange can defer both). Figures are a year-1 estimate at your 24.0% rate — not tax advice; consult a CPA.
Schools (NCES district)
- District
- Montgomery ISD
- NCES district ID
- 4831260
- Math proficiency
- 63% ▼ -3.00%
- Reading proficiency
- 57% ▼ -3.00%
- Median HH income
- $75,596
- Composite
- 53.55/100
- National rank
- #1445
- State rank
- #49 of 826 in TX
Livability — Montgomery
- Score
- 70/100
- State rank
- #372
- US rank
- #7894
Category grades
Schools grade is shown separately in the Schools card above.
Census & demographics
- County
- Montgomery County · 663,713 people
- City population
- 67,277
- Metro
- Houston-The Woodlands-Sugar Land, TX
- Population (ZIP)
- 34,694
- Household income
- $124,055
- Rent vs Own
- Severe rent burden
- 273.0
Population outlook (Montgomery County) Hauer SSP2
- Today (2025)
- 713,896 people
- By 2030
- 805,263 · +12.8%
- By 2040
- 992,708 · +39.1%
- By 2050
- 1,179,590 · +65.2%
- By 2075
- 1,628,084 · +128.1%
- By 2100
- 1,937,880 · +171.5%
Race, ethnicity, and origin ACS 2023
- Neighborhood character
- Predominantly White (80%)
- Race & ethnicity
- White 80% Hispanic / Latino 14% Two or more races 11% Black 1% Asian 1%
- Hispanic origin (detail)
- Mexican 9%
- Common ancestry
- Lithuanian 6% Slovak 3% Romanian 3%
- Foreign-born
- 6% · Canada
- Languages at home
- 90% English-only · Spanish 8%
Political lean MEDSL · Montgomery
- 2024 margin
- Solid R (+45.5) · D 26.8% · R 72.3%
- 2008→2024 swing
- +7.2pp toward D · 2008: -52.7pp · 2024: -45.5pp
- All cycles
- 2024: R+45.5 2020: R+43.8 2016: R+51.4 2012: R+60.7 2008: R+52.7
Not yet ingested
- Civics
- —
Market trends
- HPI YoY
- ▼ -31.44%
- Current HPI
- 262.6973
- Rent YoY
- ▲ 0.40%
- Metro
- Houston-The Woodlands-Sugar Land, TX
- State GDP YoY
- ▲ 3.95%
- F500 in state
- 110
Industry mix (Fortune 500 HQ in TX)
| Industry | F500 HQs | Revenue |
|---|---|---|
| Energy | 16 | $1,198B |
|
||
| Technology | 5 | $198B |
|
||
| Engineering / Construction | 4 | $72B |
|
||
| Energy Services | 3 | $60B |
|
||
| Utilities | 3 | $41B |
|
||
| Healthcare | 2 | $330B |
|
||
Price history
1 event — show timeline
- 2026-05-18 Listed $352,900 HARMLS
Cash-flow waterfall
monthlySold comps — $/sqft
last 12 mo · ≤1 miLoading sold comps…