13655 Highway 8 Business Spc 24 · Lakeside, CA
Flood risk 5/10 · Moderate
- FEMA flood zone
- X (unshaded)
- Chance of flooding over 30 yrs
- 0.24%
- Est. flood insurance / yr
- $507 – $1,088
Fire risk 7/10 · Major
- Est. fire insurance / yr
- $659 – $1,223
Heat risk 6/10 · Moderate
- Hot days now (above 98°F)
- 7 days/yr
- Hot days in 30 yrs
- 19 days/yr
Wind risk 1/10 · Minimal
- Chance of severe wind over 30 yrs
- —
Air-quality risk 4/10 · Minor
- Unhealthy air days now
- 6 days/yr
- Unhealthy air days in 30 yrs
- 7 days/yr
Risk factors via First Street. Map © Google.
Why this score? — see what drove the B+ grade
The composite is a weighted blend of 9 inputs, each scored 0–100. Each bar is that input's sub-score; the figure is the points it added to the 100-point composite (weight × sub-score).
- Cash flow +30.0/30.0
- ARV discount +15.0/15.0
- DSCR +10.0/10.0
- 1% rule +9.5/10.0
- Schools +4.0/10.0
- Livability +2.8/5.0
- Condition / age +2.5/5.0
- Rent growth +2.3/5.0
- Appreciation +0.0/10.0
$224,900
🖨 Deal sheet 📄 Offer letter ✓ Due diligence
Listing remarks
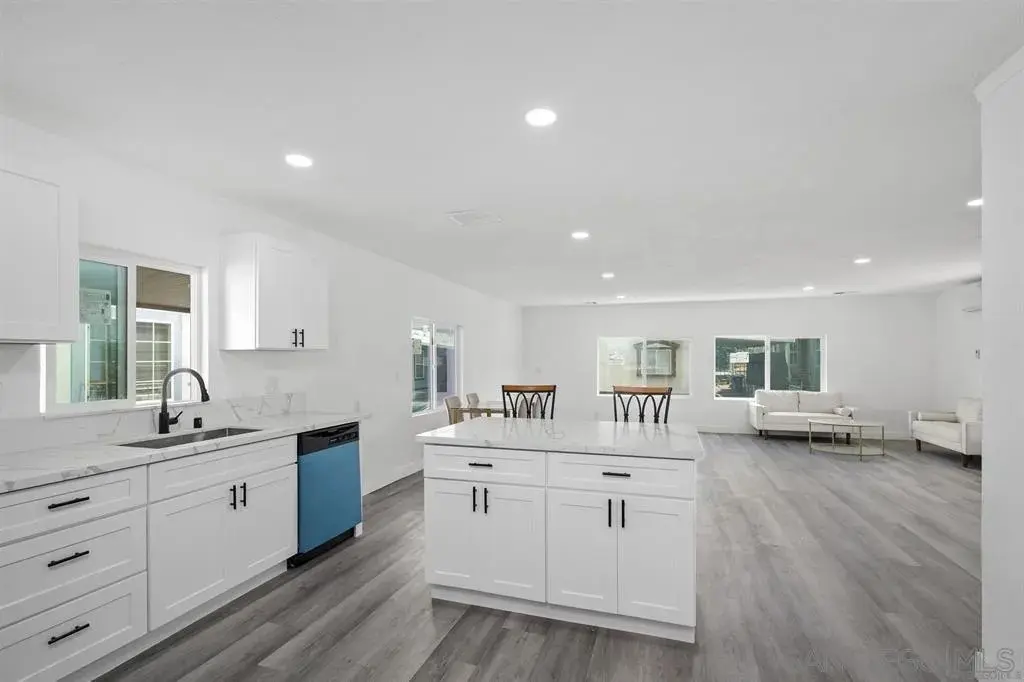
Space rent $1300!! Welcome to a Completely Remodeled home in the desirable ALL AGE community of Rancho Laguna Estates. Home Features 3 bedrooms, 2 Full bathrooms 1440 sqft with spacious open concept living room. Home has been Completely remodeled with no expense spared! NEW Roof, New split AC unit, NEW water heater, New copper plumbing, New Drywall texture throughout, New double pane windows, New Vinyl siding, New Walk-in tile showers in both bathrooms, New plumbing fixtures, New vanities and toilets, New kitchen cabinets and island with quartz countertop and Stainless steel appliances, New LVP flooring and baseboard, New closet doors, New ceiling lights and fans and electric outlets, fresh
Key facts
- Completely remodeled
- New water heater
- New drywall texture
Tags
Property features AI
Finance
- Other: Located in El Cajon subdivision; Directions: after entering gate, go all the way straight; it's the third to last home on the right
- HOA & community: Homeowners association with monthly fee; Located in Rancho Laguna Estates
Exterior
- Parking: 2 parking spaces
- Utilities: Sewer connected
- Home design: Manufactured home; Single-story
- Construction: Vinyl siding
- Exterior features: Community pool
Interior
- Kitchen: Cooktop; Dishwasher; Microwave; Refrigerator
- Bedrooms: Up to 3 bedrooms possible
- Bathrooms: 2 full bathrooms
- Heating & cooling: Electric heating; Wall/window cooling units
- Interior features: Dishwasher; Microwave; Refrigerator; Cooktop
Neighborhood map
What this means for you Summary
Snapshot
- This is a 3-bed/2.0-bath manufactured listed at $225k.
Deal economics
- At list price, monthly cash flow is $1k ($12k/yr) — positive.
- The deal already cash-flows at list — no discount required.
- Meets the 1% rule at list price ($3k rent vs $225k).
- Cap rate 11.8% vs local median 2.6% in Lakeside — top-decile yield for the area; either an underpriced asset or a hidden risk that comps aren't pricing in. Stress-test before assuming the spread holds.
Location & tenants
- Location reads 55/100 on livability (#877 in CA) — a working-class tenant base; expect higher turnover. Strengths: employment A-, housing A-, health & safety B; Watch: commute D, crime D-, amenities F.
- Grossmont Union High (suburban): math 31% / reading 60% proficiency, ranked #173 of 517 in CA (top 34%) — families likely to look elsewhere, expect single-tenant / working-renter base with shorter leases; only 17% free/reduced lunch — higher-income household profile.
- Market conditions: Rents soft (-0.8%/yr); 238 active listings in the ZIP; 5 comparable units currently listed for rent nearby; rentals leasing fast (median 2d on market — plan ~1-2 weeks tenant-placement turnaround); 11,759 units permitted in San Diego County in 2024 (7,244 in 5+ unit buildings).
- At $3,267/mo this rent would consume 53% of the median local household income ($74k/yr) (locally 4178% of renters already pay >50% of income on rent) — very limited rent-growth headroom before tenants either downsize or default.
Forward outlook
- Local home prices are declining (-3.0%/yr); year-one equity from $2k of loan paydown is wiped out by about $7k of value loss. Plan a longer hold.
- San Diego County population projected at +20% by 2050 — long-run rental-demand tailwind backs the buy-and-hold thesis.
- At projected returns (-3.0% appreciation + 0.0% rent growth), your $63k cash investment doubles in ~8 years — after that, you're playing with house money.
Negotiation context
- Only 13 days on market — expect competitive offers; lowballing is unlikely to land.
- 5 sale attempts with the ask held roughly flat each time — persistent listings suggest the price (not the market) is what's stuck; bring a comps-based counter.
Risks & watch-outs
- Climate carrying-cost: moderate flood risk; major wildfire risk; extreme-heat days projected 7→19/yr by 2055 (HVAC capex compounding) — expect insurance premiums to compound above CPI over the hold.
Questions for the listing agent
- Built in 1972 — when were the roof, HVAC, electrical panel, plumbing, and water heater last replaced?
- Is there a deadline driving the sale (1031 exchange, divorce, estate, relocation)? That informs how much negotiation room exists.
- Crime grade is D in this area — have there been break-ins, vandalism, or insurance claims at this property in the last 3 years? What carrier currently insures it and at what premium?
- What's the average days-on-market for RENTAL listings here right now (not sales)? A rising rental-DOM trend means longer vacancies and softer asking-rent achievability than the comps imply.
- What's the recent tenant-quality profile in this submarket — average credit score on applications, eviction rate, late-payment / NSF rate, and stable-employment percentage? A property-management company in the area should have these aggregated.
- How much new for-sale + rental construction is in the pipeline within 1–3 miles? Heavy new supply typically softens prices + rents 12–24 months out; constrained supply supports both.
Investment metrics
- 1% rule
- 1.45% ✓
- Cap rate
- 11.77%
- Cash-on-cash
- 19.57%
- DSCR
- 1.87
- GRM
- 5.7
CMA / ARV
- ARV (on-the-fly)
- $289,440
- Comps found
- 12
Show comp detail 12 sales within ~0.75 mi
| Address | Dist | Beds/Ba | Sqft | Sold | Price | $/sf | Match |
|---|---|---|---|---|---|---|---|
| 13490 Highway 8 Business #22 | 0.35mi | 3/2.0 | 1,344 (-7%) | 14mo | $222,000 | $165 | 60 |
| 13450 Highway 8 Business Spc 18 | 0.69mi | 3/2.0 | 1,440 (0%) | 13mo | $300,000 | $208 | 57 |
| 13450 Highway 8 Business #99 | 0.69mi | 3/2.0 | 1,408 (-2%) | 10mo | $330,000 | $234 | 56 |
| 13300 Los Coches Rd #114 | 0.54mi | 3/2.0 | 1,546 (+7%) | 10mo | $217,000 | $140 | 54 |
| 13490 Highway 8 Business Spc 121 | 0.35mi | 4/2.0 (+1) | 1,512 (+5%) | 19mo | $310,000 | $205 | 54 |
| 13450 Highway 8 Business #98 | 0.69mi | 3/2.0 | 1,440 (0%) | 18mo | $200,000 | $139 | 53 |
| 13450 Highway 8 Business #12 | 0.69mi | 3/2.0 | 1,408 (-2%) | 14mo | $310,000 | $220 | 53 |
| 13460 Highway 8 Business Spc 11 | 0.60mi | 3/2.0 | 1,536 (+7%) | 10mo | $295,000 | $192 | 53 |
| 13450 Hwy 8 Business | 0.69mi | 3/2.0 | 1,344 (-7%) | 10mo | $242,500 | $180 | 48 |
| 13300 Los Coches East Rd #62 | 0.54mi | 3/2.0 | 1,368 (-5%) | 23mo | $299,000 | $219 | 48 |
| 13450 Highway 8 Business Spc 16 | 0.69mi | 4/2.0 (+1) | 1,620 (+12%) | 3mo | $325,000 | $201 | 39 |
| 13300 Los Coches Rd. E #73 | 0.60mi | 2/2.0 (-1) | 1,248 (-13%) | 22mo | $179,000 | $143 | 26 |
Match score weights: distance 35% · size 25% · config 20% · recency 20%. Top-matched comps best support the ARV.
Projected returns pro-forma
-3.0% appreciation · 0.0% rent growth · sell at horizon
- IRR
- 8.2%
- Equity multiple
- 1.31×
- Total profit
- $19,446
- Equity at exit
- $33,533
- IRR
- 14.7%
- Equity multiple
- 2.02×
- Total profit
- $64,360
- Equity at exit
- $19,445
Cash invested: $62,972 (down + closing). Projections, not guarantees.
Landlord ↔ Tenant lean methodology
- Overall (STATE)
- 18 Strongly Tenant-Friendly
- State California
- 18 Strongly Tenant-Friendly · D+13
- County
- — inherits STATE
- City
- — inherits STATE
ZIP-level market 92021
- Rents YoY
- -0.8%
- Active inventory
- 238
- Price-to-rent
- 5.7×
Monthly cashflow live
- Estimated rent
- $3,267 high interval (Pro) →
- Mortgage (P&I)
- −$1,179
- Tax est. 1.5%
- −$281 /mo · $3,374/yr
- Insurance
- −$94
- HOA
- −$0
- Vacancy / Maint / Mgmt
- −$686
- Net cashflow
- $1,027
Break-even live
UW: 25.0% down · 7.5% · 30yr · 1.5% tax · 5.0% vac · 8.0% maint · 8.0% mgmt
Financing live
Cash to close
- Down payment
- $56,225
- Closing costs
- $6,747
- Reserves months
- —
- Total cash needed
- —
Loan-product check · same deal, 3 products live
Conventional
25% down · 7.5% · 30yr
- Down + closing
- —
- Monthly P&I
- —
- Monthly cashflow
- —
- DSCR
- —
- Eligible?
- —
Personal DTI + credit; lowest rate.
DSCR
20% down · 8.5% · 30yr
- Down + closing
- —
- Monthly P&I
- —
- Monthly cashflow
- —
- DSCR
- —
- Eligible?
- —
No personal income docs; deal must DSCR.
Hard money
10% down · 12.0% · 12mo
- Down + closing
- —
- Monthly P&I
- —
- Monthly cashflow
- —
- DSCR
- —
- Eligible?
- —
Short-term bridge; refi at stabilization.
Rent comps 5 comps
| Address | Beds | Baths | Sqft | Rent | $/sqft | DOM | Units | Dist |
|---|---|---|---|---|---|---|---|---|
| 13893 Pinkard Way #84 El Cajon, CA | 3.0 | 2.5 | 1464 | $3,200 | $2.19 | 13d | 1 | 0.60mi |
| 8809 Los Coches Rd Lakeside, CA | 4.0 | 2.0 | 1350 | $3,800 | $2.81 | 1d | 1 | 0.87mi |
| 8410 Los Coches Rd El Cajon, CA | 2.0 | 2.0 | 900 | $2,239 | $2.49 | 1d | 1 | 1.00mi |
| 9092 Los Coches Rd Lakeside, CA | 3.0 | 2.5 | 1300 | $4,000 | $3.08 | 2d | 1 | 1.23mi |
| 9094 Los Coches Rd Lakeside, CA | 3.0 | 2.5 | 1200 | $4,000 | $3.33 | 1d | 1 | 1.23mi |
Listing history 27 events
-
2026-06-18days on market $224,900 Active 13 DOM
-
2026-06-17days on market $224,900 Active 12 DOM
-
2026-06-16days on market $224,900 Active 11 DOM
-
2026-06-15days on market $224,900 Active 10 DOM
-
2026-06-13days on market $224,900 Active 8 DOM
-
2026-06-13days on market $224,900 Active 7 DOM
-
2026-06-09days on market $224,900 Active 4 DOM
-
2026-06-08days on market $224,900 Active 3 DOM
-
2026-06-07pricedays on market $224,900 Active 2 DOM
-
2026-06-04days on market $229,900 Active 28 DOM
-
2026-06-03days on market $229,900 Active 27 DOM
-
2026-06-02days on market $229,900 Active 26 DOM
-
2026-06-01days on market $229,900 Active 25 DOM
-
2026-05-31days on market $229,900 Active 24 DOM
-
2026-05-07$229,900 Active
-
2026-05-06historical
-
2026-04-23price $234,900
-
2026-04-10price $237,000
-
2026-03-25$239,000 Active
-
2026-03-24historical
-
2026-02-27price $244,900
-
2026-01-19$249,000 Active
-
2026-01-13historical
-
2025-11-06$249,000 Active
-
2025-10-15historical
-
2025-10-10price $249,000
-
2025-09-23$250,000 Active
ⓘ Source: listings_history table (triggers on properties + properties_extension) + one-shot
backfill from property_details.listing_events for pre-trigger history.
Climate risk First Street
- Flood 5/10 Major FEMA zone X (unshaded) · 24% chance over 30 yrs
- Wildfire 7/10 Severe
- Heat 6/10 Major 7 d/yr ≥98°F today · 19 d/yr by 30 yrs out
- Wind 1/10 Low
- Air quality 4/10 Moderate 6 unhealthy d/yr today · 7 by 30 yrs out
Nearby sold comps map
Loading sold comps map…
Walkable amenities ~0.75 mi
Loading nearby amenities…
Taxation est. · year 1
- Rental income
- $39,210
- − Mortgage interest
- −$12,598
- − Property taxes
- −$3,374
- − Insurance
- −$1,124
- − Repairs & maintenance
- −$3,137
- − Management
- −$3,137
- − Depreciation
- −$6,543
- Taxable income
- $9,298
- Est. tax owed @ 24.0%
- −$2,231
- After-tax cash flow
- $10,094/yr
For passive investors: Depreciation is non-cash, so a rental often shows a tax loss while cash-flowing — sheltering income. Rental losses are passive: they offset passive income freely, and up to $25,000/yr can offset ordinary (W-2) income if you actively participate and your MAGI is under $100k (phasing out to $0 by $150k); unused losses carry forward. On sale, claimed depreciation is recaptured at up to 25%, and gains may owe capital-gains tax (a 1031 exchange can defer both). Figures are a year-1 estimate at your 24.0% rate — not tax advice; consult a CPA.
Schools (NCES district)
- District
- Grossmont Union High
- NCES district ID
- 0616230
- Math proficiency
- 31% ▼ -1.00%
- Reading proficiency
- 60% ▲ 5.00%
- Median HH income
- $61,801
- Composite
- 40.07/100
- National rank
- #3810
- State rank
- #173 of 517 in CA
Livability — Lakeside
- Score
- 55/100
- State rank
- #877
- US rank
- #23702
Category grades
Schools grade is shown separately in the Schools card above.
Census & demographics
- Census place
- Lakeside, CA
- County
- San Diego County · 3,178,799 people
- City population
- 46,216
- Metro
- San Diego-Chula Vista-Carlsbad, CA
- Population (ZIP)
- 70,501
- Household income
- $74,013
- Rent vs Own
- Severe rent burden
- 4178.0
Population outlook (San Diego County) Hauer SSP2
- Today (2025)
- 3,678,185 people
- By 2030
- 3,856,546 · +4.8%
- By 2040
- 4,171,407 · +13.4%
- By 2050
- 4,421,607 · +20.2%
- By 2075
- 4,831,599 · +31.4%
- By 2100
- 4,832,502 · +31.4%
Race, ethnicity, and origin ACS 2023
- Neighborhood character
- Diverse neighborhood (Simpson 0.62)
- Race & ethnicity
- White 54% Hispanic / Latino 28% Two or more races 14% Black 6% Asian 5% Native American 2%
- Hispanic origin (detail)
- Mexican 24%
- Common ancestry
- Arab 6% Italian 2% Lithuanian 2%
- Foreign-born
- 22% · Canada
- Languages at home
- 65% English-only · Spanish 18% Arabic 7% Other Indo-European 3%
Political lean MEDSL · San Diego
- 2024 margin
- D (+16.8) · D 56.9% · R 40.1% · Other 2.9%
- 2008→2024 swing
- +6.6pp toward D · 2008: 10.2pp · 2024: 16.8pp
- All cycles
- 2024: D+16.8 2020: D+22.8 2016: D+17.8 2012: D+5.1 2008: D+10.2
Not yet ingested
- Civics
- —
Market trends
- HPI YoY
- ▼ -654.88%
- Current HPI
- 335.0617
- Rent YoY
- ▼ -0.83%
- Metro
- San Diego-Chula Vista-Carlsbad, CA
- State GDP YoY
- ▲ 3.21%
- F500 in state
- 116
Industry mix (Fortune 500 HQ in CA)
| Industry | F500 HQs | Revenue |
|---|---|---|
| Technology | 27 | $1,492B |
|
||
| Financial Services | 3 | $174B |
|
||
| Retail | 3 | $44B |
|
||
| Insurance | 3 | $26B |
|
||
| Media / Entertainment | 2 | $115B |
|
||
| Pharmaceuticals / Biotech | 2 | $62B |
|
||
Price history
-8.0% since first listed13 events — show timeline
- 2026-05-07 Listed $229,900 SDMLS
- 2026-05-06 Listing Removed — SDMLS
- 2026-04-23 Price Changed $234,900 SDMLS
- 2026-04-10 Price Changed $237,000 SDMLS
- 2026-03-25 Listed $239,000 SDMLS
- 2026-03-24 Listing Removed — SDMLS
- 2026-02-27 Price Changed $244,900 SDMLS
- 2026-01-19 Listed $249,000 SDMLS
- 2026-01-13 Listing Removed — SDMLS
- 2025-11-06 Listed $249,000 SDMLS
- 2025-10-15 Listing Removed — SDMLS
- 2025-10-10 Price Changed $249,000 SDMLS
- 2025-09-23 Listed $250,000 SDMLS
Property tax history
+3.6%/yrLatest (2013): $212 · +6.2% YoY. Source: county tax records.
Cash-flow waterfall
monthlySold comps — $/sqft
last 12 mo · ≤1 miLoading sold comps…