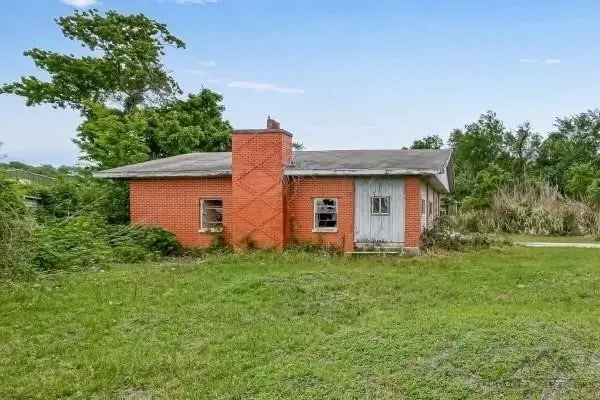
14317 Murray Rd · Houston, TX
Flood risk 9/10 · Severe
- FEMA flood zone
- X (unshaded)
- Chance of flooding over 30 yrs
- 0.99%
- Est. flood insurance / yr
- $507 – $1,088
Fire risk 5/10 · Moderate
- Est. fire insurance / yr
- $1,222 – $2,270
Heat risk 9/10 · Severe
- Hot days now (above 110°F)
- 7 days/yr
- Hot days in 30 yrs
- 24 days/yr
Wind risk 9/10 · Severe
- Chance of severe wind over 30 yrs
- 99.0%
Air-quality risk 3/10 · Minor
- Unhealthy air days now
- 2 days/yr
- Unhealthy air days in 30 yrs
- 3 days/yr
Risk factors via First Street. Map © Google.
Why this score? — see what drove the A- grade
The composite is a weighted blend of 9 inputs, each scored 0–100. Each bar is that input's sub-score; the figure is the points it added to the 100-point composite (weight × sub-score).
- Cash flow +30.0/30.0
- ARV discount +15.0/15.0
- 1% rule +10.0/10.0
- DSCR +10.0/10.0
- Appreciation +4.2/10.0
- Livability +3.7/5.0
- Rent growth +2.7/5.0
- Condition / age +2.5/5.0
- Schools +2.0/10.0
$98,500
🖨 Deal sheet (PDF) 📄 Offer letter ✓ Due diligence
Listing remarks
House that needs work, can be for handyman that can fix to bring it back to life. No HOA, with low taxes
Key facts
- Low taxes
- No hoa
- 0.23 acre lot
Tags
Property features AI
Exterior
- Utilities: Public water; Public sewer
- Home design: Residential property; Single-story entry (all main rooms on the first floor); Built in 1980
- Construction: Wood siding exterior; Composition roof; Block and slab foundation
- Exterior features: Located in a subdivision
Interior
- Bedrooms: Three bedrooms (all on the first floor)
- Bathrooms: One full bathroom
- Heating & cooling: Central heating (electric); Central air conditioning (electric)
- Interior features: Fireplace
Neighborhood map
What this means for you Summary
Snapshot
- This is a 3-bed/2.0-bath manufactured listed at $98k.
Deal economics
- At list price, monthly cash flow is $597 ($7k/yr) — positive.
- The deal already cash-flows at list — no discount required.
- Meets the 1% rule at list price ($2k rent vs $98k).
- Recommended offer: $97k (1.5% below list) — sets the bar for market timing.
- Cap rate 14.4% vs local median 3.2% in Houston — top-decile yield for the area; either an underpriced asset or a hidden risk that comps aren't pricing in. Stress-test before assuming the spread holds.
Location & tenants
- Location reads 74/100 on livability (#184 in TX, #4,771 nationally) — a middle-class / working-renter tenant base. Strengths: amenities A+, cost of living A+, housing A+; Watch: crime F.
- Sheldon ISD (suburban): math 19% / reading 25% proficiency, ranked #746 of 826 in TX (top 90%) — low school quality limits family demand, transient renter base, plan for 1-2y turnover; 72% free/reduced lunch — lower-income household profile, screen leases tightly.
- Zoned schools: Sheldon Lake El (math 30% / reading 27%, grade F, #2,706 of 4,322 statewide, top 63%, 665 students, 86% FRL); Michael R Null Middle (math 15% / reading 23%, grade F, #1,466 of 1,662 statewide, top 89%, 1,164 students, 89% FRL) — zoned schools average 87% FRL vs 72% district-wide (16 pts higher); higher-poverty schools than district average — tighter screening recommended.
- Market conditions: Rents flat; 340 active listings in the ZIP; solid renter incomes; 29,883 units permitted in Harris County in 2024 (8,621 in 5+ unit buildings).
Forward outlook
- Local home prices are declining (-1.6%/yr); year-one equity from $681 of loan paydown is wiped out by about $2k of value loss. Plan a longer hold.
- Harris County population projected at +47% by 2050 — long-run rental-demand tailwind backs the buy-and-hold thesis.
- At projected returns (-1.6% appreciation + 0.9% rent growth), your $28k cash investment doubles in ~5 years — after that, you're playing with house money.
Negotiation context
- It's been on market 15 days — a 2% lower offer ($97k) is reasonable based on typical stale-listing flexibility.
- 12 sale attempts since 3y ago with the ask held roughly flat each time — persistent listings suggest the price (not the market) is what's stuck; bring a comps-based counter.
Risks & watch-outs
- Watch-outs: flood insurance adds $66/mo.
- Climate carrying-cost: severe flood risk; severe wind risk, 99% chance of damaging wind over 30y; moderate wildfire risk; extreme-heat days projected 7→24/yr by 2055 (HVAC capex compounding) — expect insurance premiums to compound above CPI over the hold.
Questions for the listing agent
- What's the actual annual flood-insurance premium (NFIP or private), and is the property in a SFHA with mandatory coverage?
- Is there a deadline driving the sale (1031 exchange, divorce, estate, relocation)? That informs how much negotiation room exists.
- Schools are D-rated, which usually means shorter tenancies and higher turnover. Who's the typical renter profile here, and what's been the actual vacancy rate?
- Crime grade is F in this area — have there been break-ins, vandalism, or insurance claims at this property in the last 3 years? What carrier currently insures it and at what premium?
- What's the average days-on-market for RENTAL listings here right now (not sales)? A rising rental-DOM trend means longer vacancies and softer asking-rent achievability than the comps imply.
- What's the recent tenant-quality profile in this submarket — average credit score on applications, eviction rate, late-payment / NSF rate, and stable-employment percentage? A property-management company in the area should have these aggregated.
- How much new for-sale + rental construction is in the pipeline within 1–3 miles? Heavy new supply typically softens prices + rents 12–24 months out; constrained supply supports both.
Investment metrics
- 1% rule
- 1.73% ✓
- Cap rate
- 14.37%
- Cash-on-cash
- 28.85%
- DSCR
- 2.28
- GRM
- 4.8
CMA / ARV
- ARV (median comp)
- $148,271
- List price
- $98,500
- Delta
- -32.89%
- Verdict
- UNDERPRICED
- Comps
- 4 within 2.0 mi
Projected returns pro-forma
-1.59% appreciation · 0.92% rent growth · sell at horizon
- IRR
- 20.7%
- Equity multiple
- 1.89×
- Total profit
- $24,590
- Equity at exit
- $21,036
- IRR
- 25.4%
- Equity multiple
- 3.26×
- Total profit
- $62,330
- Equity at exit
- $19,831
Cash invested: $27,580 (down + closing). Projections, not guarantees.
Landlord ↔ Tenant lean methodology
- Overall (STATE)
- 87 Strongly Landlord-Friendly
- State Texas
- 87 Strongly Landlord-Friendly · R+5
- County
- — inherits STATE
- City
- — inherits STATE
ZIP-level market 77044
- Home prices YoY
- -0.7%
- Rents YoY
- 0.9%
- Active inventory
- 340
- Price-to-rent
- 4.8×
Monthly cashflow live
- Estimated rent
- $1,701 medium interval (Pro) →
- Mortgage (P&I)
- −$517
- Tax est. 1.5%
- −$123 /mo · $1,478/yr
- Insurance
- −$41
- Flood insurance flood zone
- −$66 /mo · $798/yr
- HOA
- −$0
- Vacancy / Maint / Mgmt
- −$357
- Net cashflow
- $597
Break-even live
Sensitivity live
| Price | -10% $665 | -5% $631 | +0% $597 | +5% $563 | +10% $529 |
|---|---|---|---|---|---|
| Rent | -10% $462 | -5% $529 | +0% $597 | +5% $664 | +10% $731 |
| Rate | -1.0pp $646 | -0.5pp $622 | base $597 | +0.5pp $571 | +1.0pp $545 |
UW: 25.0% down · 7.5% · 30yr · 1.5% tax · 5.0% vac · 8.0% maint · 8.0% mgmt
Financing live
Cash to close
- Down payment
- $24,625
- Closing costs
- $2,955
- Reserves months
- —
- Total cash needed
- —
Loan-product check · same deal, 3 products live
Conventional
25% down · 7.5% · 30yr
- Down + closing
- —
- Monthly P&I
- —
- Monthly cashflow
- —
- DSCR
- —
- Eligible?
- —
Personal DTI + credit; lowest rate.
DSCR
20% down · 8.5% · 30yr
- Down + closing
- —
- Monthly P&I
- —
- Monthly cashflow
- —
- DSCR
- —
- Eligible?
- —
No personal income docs; deal must DSCR.
Hard money
10% down · 12.0% · 12mo
- Down + closing
- —
- Monthly P&I
- —
- Monthly cashflow
- —
- DSCR
- —
- Eligible?
- —
Short-term bridge; refi at stabilization.
Listing history 47 events
-
2026-06-21days on market $98,500 Active 15 DOM
-
2026-06-18days on market $98,500 Active 12 DOM
-
2026-06-17days on market $98,500 Active 11 DOM
-
2026-06-16days on market $98,500 Active 10 DOM
-
2026-06-15days on market $98,500 Active 9 DOM
-
2026-06-13days on market $98,500 Active 7 DOM
-
2026-06-09days on market $98,500 Active 3 DOM
-
2026-06-08days on market $98,500 Active 2 DOM
-
2026-06-07pricedays on market $98,500 Active 1 DOM
-
2026-05-31days on market $99,500 Active 137 DOM
-
2026-05-14price $99,500 104-char remark
-
2026-04-08price $99,995 104-char remark
-
2026-03-28price $104,995 104-char remark
-
2026-03-23price $109,995 104-char remark
-
2026-02-02price $119,995 104-char remark
-
2026-01-14$129,000 Active 104-char remark
-
2025-12-31historical
-
2025-07-30price $129,995
-
2025-07-11$120,000 Active
-
2025-07-02historical
-
2025-05-08status Active
-
2025-05-07historical
-
2025-05-01$129,995 Active
-
2025-04-17historical $600
-
2025-04-17historical
-
2025-02-28price $119,995
-
2025-02-09price $129,995
-
2025-01-17$600
-
2025-01-16$149,995 Active
-
2025-01-15historical
-
2025-01-12$149,995 Active
-
2024-12-19historical
-
2024-10-02price $149,995
-
2024-10-02status Active
-
2024-09-01historical
-
2024-08-16price $99,995
-
2024-06-19$129,995 Active
-
2024-06-10historical
-
2024-05-16price $149,994
-
2024-03-21price $149,995
-
2024-02-09price $155,000
-
2024-01-10$145,000 Active
-
2023-12-26historical
-
2023-11-07price $139,500
-
2023-10-25price $149,500
-
2023-09-14price $155,000
-
2023-06-26$165,000 Active
ⓘ Source: listings_history table (triggers on properties + properties_extension) + one-shot
backfill from property_details.listing_events for pre-trigger history.
Climate risk First Street
- Flood 9/10 Extreme FEMA zone X (unshaded) · 99% chance over 30 yrs
- Wildfire 5/10 Major
- Heat 9/10 Extreme 7 d/yr ≥110°F today · 24 d/yr by 30 yrs out
- Wind 9/10 Extreme 99% chance of damaging wind over 30 yrs
- Air quality 3/10 Moderate 2 unhealthy d/yr today · 3 by 30 yrs out
Nearby sold comps map
Loading sold comps map…
Walkable amenities ~0.75 mi
Loading nearby amenities…
Taxation est. · year 1
- Rental income
- $20,413
- − Mortgage interest
- −$5,518
- − Property taxes
- −$1,478
- − Insurance
- −$1,290
- − Repairs & maintenance
- −$1,633
- − Management
- −$1,633
- − Depreciation
- −$2,865
- Taxable income
- $5,997
- Est. tax owed @ 24.0%
- −$1,439
- After-tax cash flow
- $5,721/yr
For passive investors: Depreciation is non-cash, so a rental often shows a tax loss while cash-flowing — sheltering income. Rental losses are passive: they offset passive income freely, and up to $25,000/yr can offset ordinary (W-2) income if you actively participate and your MAGI is under $100k (phasing out to $0 by $150k); unused losses carry forward. On sale, claimed depreciation is recaptured at up to 25%, and gains may owe capital-gains tax (a 1031 exchange can defer both). Figures are a year-1 estimate at your 24.0% rate — not tax advice; consult a CPA.
Schools (NCES district)
- District
- Sheldon ISD
- NCES district ID
- 4839990
- Math proficiency
- 19% ▼ -18.00%
- Reading proficiency
- 25% ▼ -10.00%
- Median HH income
- $49,443
- Composite
- 19.5/100
- National rank
- #8772
- State rank
- #746 of 826 in TX
Livability — Houston
- Score
- 74/100
- State rank
- #184
- US rank
- #4771
Category grades
Schools grade is shown separately in the Schools card above.
Census & demographics
- County
- Harris County · 4,702,590 people
- City population
- 3,226,434
- Metro
- Houston-The Woodlands-Sugar Land, TX
- Population (ZIP)
- 58,347
- Household income
- $95,000
- Rent vs Own
- Severe rent burden
- 1332.0
Population outlook (Harris County) Hauer SSP2
- Today (2025)
- 5,571,493 people
- By 2030
- 6,089,821 · +9.3%
- By 2040
- 7,142,806 · +28.2%
- By 2050
- 8,185,864 · +46.9%
- By 2075
- 10,574,329 · +89.8%
- By 2100
- 12,109,958 · +117.4%
Race, ethnicity, and origin ACS 2023
- Neighborhood character
- Diverse neighborhood (Simpson 0.66)
- Race & ethnicity
- Hispanic / Latino 44% Black 32% White 19% Two or more races 18% Native American 2% Asian 1%
- Hispanic origin (detail)
- Mexican 36%
- Common ancestry
- Lithuanian 1% Romanian 1% Iranian 1%
- Foreign-born
- 18% · Canada
- Languages at home
- 61% English-only · Spanish 35% French/Haitian/Cajun 1% Other Indo-European 1%
Political lean MEDSL · Harris
- 2024 margin
- Lean D (+5.5) · D 52.0% · R 46.4% · Other 1.6%
- 2008→2024 swing
- +3.9pp toward D · 2008: 1.6pp · 2024: 5.5pp
- All cycles
- 2024: D+5.5 2020: D+13.3 2016: D+12.4 2012: D+0.1 2008: D+1.6
Not yet ingested
- Civics
- —
Market trends
- HPI YoY
- ▼ -1.59%
- Current HPI
- 215.5736
- Rent YoY
- ▲ 0.92%
- Metro
- Houston-The Woodlands-Sugar Land, TX
- State GDP YoY
- ▲ 3.95%
- F500 in state
- 110
Industry mix (Fortune 500 HQ in TX)
| Industry | F500 HQs | Revenue |
|---|---|---|
| Energy | 16 | $1,198B |
|
||
| Technology | 5 | $198B |
|
||
| Engineering / Construction | 4 | $72B |
|
||
| Energy Services | 3 | $60B |
|
||
| Utilities | 3 | $41B |
|
||
| Healthcare | 2 | $330B |
|
||
Price history
-40.3% since first listed39 events — show timeline
- 2026-06-06 Listed $98,500 HARMLS
- 2026-05-31 Listing Removed — HARMLS
- 2026-05-14 Price Changed $99,500 HARMLS
- 2026-04-08 Price Changed $99,995 HARMLS
- 2026-03-28 Price Changed $104,995 HARMLS
- 2026-03-23 Price Changed $109,995 HARMLS
- 2026-02-02 Price Changed $119,995 HARMLS
- 2026-01-14 Listed $129,000 HARMLS
- 2025-12-31 Listing Removed — HARMLS
- 2025-07-30 Price Changed $129,995 HARMLS
- 2025-07-11 Listed $120,000 HARMLS
- 2025-07-02 Listing Removed — HARMLS
- 2025-05-08 Relisted — HARMLS
- 2025-05-07 Listing Removed — HARMLS
- 2025-05-01 Listed $129,995 HARMLS
- 2025-04-17 Rental Removed $600 HARMLS
- 2025-04-17 Listing Removed — HARMLS
- 2025-02-28 Price Changed $119,995 HARMLS
- 2025-02-09 Price Changed $129,995 HARMLS
- 2025-01-17 Listed for Rent $600 HARMLS
- 2025-01-16 Listed $149,995 HARMLS
- 2025-01-15 Listing Removed — HARMLS
- 2025-01-12 Listed $149,995 HARMLS
- 2024-12-19 Listing Removed — HARMLS
- 2024-10-02 Price Changed $149,995 HARMLS
- 2024-10-02 Relisted — HARMLS
- 2024-09-01 Listing Removed — HARMLS
- 2024-08-16 Price Changed $99,995 HARMLS
- 2024-06-19 Listed $129,995 HARMLS
- 2024-06-10 Listing Removed — HARMLS
- 2024-05-16 Price Changed $149,994 HARMLS
- 2024-03-21 Price Changed $149,995 HARMLS
- 2024-02-09 Price Changed $155,000 HARMLS
- 2024-01-10 Listed $145,000 HARMLS
- 2023-12-26 Listing Removed — HARMLS
- 2023-11-07 Price Changed $139,500 HARMLS
- 2023-10-25 Price Changed $149,500 HARMLS
- 2023-09-14 Price Changed $155,000 HARMLS
- 2023-06-26 Listed $165,000 HARMLS
Property tax history
-2.2%/yrLatest (2022): $166 · -4.8% YoY. Source: county tax records.
Cash-flow waterfall
monthlySold comps — $/sqft
last 12 mo · ≤1 miLoading sold comps…