105 Knotts Run Rd · Ripley, WV
Flood risk 1/10 · Minimal
- FEMA flood zone
- X (unshaded)
- Chance of flooding over 30 yrs
- 0.0%
- Est. flood insurance / yr
- $507 – $1,088
Fire risk 5/10 · Moderate
- Est. fire insurance / yr
- $787 – $1,461
Heat risk 4/10 · Minor
- Hot days now (above 102°F)
- 7 days/yr
- Hot days in 30 yrs
- 18 days/yr
Wind risk 2/10 · Minimal
- Chance of severe wind over 30 yrs
- 1.0%
Air-quality risk 2/10 · Minimal
- Unhealthy air days now
- 0 days/yr
- Unhealthy air days in 30 yrs
- 1 days/yr
Risk factors via First Street. Map © Google.
Why this score? — see what drove the C grade
The composite is a weighted blend of 9 inputs, each scored 0–100. Each bar is that input's sub-score; the figure is the points it added to the 100-point composite (weight × sub-score).
- Cash flow +23.6/30.0
- DSCR +7.6/10.0
- ARV discount +7.5/15.0
- 1% rule +5.2/10.0
- Livability +3.7/5.0
- Schools +3.5/10.0
- Rent growth +2.5/5.0
- Condition / age +2.5/5.0
- Appreciation +2.4/10.0
$100,000
🖨 Deal sheet (PDF) 📄 Offer letter ✓ Due diligence
Listing remarks
For sale by owner, no agents are contracted by me to speak for this listing. Fixer upper, selling AS IS. Detached garage, nice yard, newer roof. Baseboard heat or a propane heater. there& apos; s a 500 gallon propane tank that runs heat and the Generac generator if electric goes out. Window or floor units for AC. Text 304-532-0354 if interested.
Key facts
- Generac generator
- Newer roof
- Detached garage
Tags
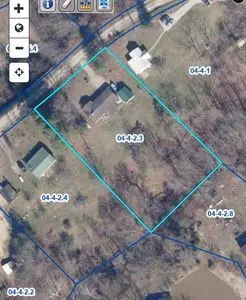
Neighborhood map
What this means for you Summary
Snapshot
- This is a 2-bed/1.5-bath single-family listed at $100k.
Deal economics
- At list price, monthly cash flow is $188 ($2k/yr) — positive.
- The deal already cash-flows at list — no discount required.
- Meets the 1% rule at list price ($1k rent vs $100k).
- Recommended offer: $97k (3.0% below list) — sets the bar for market timing.
- Cap rate 8.5% vs local median 2.7% in Ripley — top-decile yield for the area; either an underpriced asset or a hidden risk that comps aren't pricing in. Stress-test before assuming the spread holds.
Location & tenants
- Location reads 74/100 on livability (#35 in WV, #4,915 nationally) — a middle-class / working-renter tenant base. Strengths: crime A+, cost of living A+, health & safety A+; Watch: amenities D, schools D-, commute F.
- Jackson County Schools (town): math 38% / reading 45% proficiency, ranked #4 of 55 in WV (top 7%) — families likely to look elsewhere, expect single-tenant / working-renter base with shorter leases.
- Market conditions: 43 active listings in the ZIP; 1 units permitted in Jackson County in 2024 (0 in 5+ unit buildings).
Forward outlook
- Local home prices are declining (-3.0%/yr); year-one equity from $691 of loan paydown is wiped out by about $3k of value loss. Plan a longer hold.
- Jackson County population projected at -12% by 2050 — secular population decline; favor cash flow + early exit over multi-decade hold.
Negotiation context
- It's been on market 40 days — a 3% lower offer ($97k) is reasonable based on typical stale-listing flexibility.
Risks & watch-outs
- Climate carrying-cost: moderate wildfire risk — expect insurance premiums to compound above CPI over the hold.
Questions for the listing agent
- It's been on market 40 days. Have you received any prior offers? Is the seller open to a 3% concession, seller financing, or rate buy-down credit?
- Is there a deadline driving the sale (1031 exchange, divorce, estate, relocation)? That informs how much negotiation room exists.
- Schools are D-rated, which usually means shorter tenancies and higher turnover. Who's the typical renter profile here, and what's been the actual vacancy rate?
- What's the average days-on-market for RENTAL listings here right now (not sales)? A rising rental-DOM trend means longer vacancies and softer asking-rent achievability than the comps imply.
- What's the recent tenant-quality profile in this submarket — average credit score on applications, eviction rate, late-payment / NSF rate, and stable-employment percentage? A property-management company in the area should have these aggregated.
- How much new for-sale + rental construction is in the pipeline within 1–3 miles? Heavy new supply typically softens prices + rents 12–24 months out; constrained supply supports both.
Investment metrics
- 1% rule
- 1.02% ✓
- Cap rate
- 8.54%
- Cash-on-cash
- 8.04%
- DSCR
- 1.36
- GRM
- 8.2
CMA / ARV
No comps found within radius.
Projected returns pro-forma
-3.0% appreciation · 3.0% rent growth · sell at horizon
- IRR
- -4.1%
- Equity multiple
- 0.85×
- Total profit
- $-4,284
- Equity at exit
- $14,910
- IRR
- 5.6%
- Equity multiple
- 1.41×
- Total profit
- $11,539
- Equity at exit
- $8,646
Cash invested: $28,000 (down + closing). Projections, not guarantees.
Landlord ↔ Tenant lean methodology
- Overall (STATE)
- 83 Strongly Landlord-Friendly
- State West Virginia
- 83 Strongly Landlord-Friendly · R+22
- County
- — inherits STATE
- City
- — inherits STATE
ZIP-level market 25271
- Home prices YoY
- -2.8%
- Active inventory
- 43
- Price-to-rent
- 8.2×
Monthly cashflow live
- Estimated rent
- $1,021 medium interval (Pro) →
- Mortgage (P&I)
- −$524
- Tax from tax record
- −$53 /mo · $638/yr
- Insurance
- −$42
- HOA
- −$0
- Vacancy / Maint / Mgmt
- −$214
- Net cashflow
- $188
Break-even live
Sensitivity live
| Price | -10% $244 | -5% $216 | +0% $188 | +5% $159 | +10% $131 |
|---|---|---|---|---|---|
| Rent | -10% $107 | -5% $147 | +0% $188 | +5% $228 | +10% $268 |
| Rate | -1.0pp $238 | -0.5pp $213 | base $188 | +0.5pp $162 | +1.0pp $135 |
UW: 25.0% down · 7.5% · 30yr · 1.5% tax · 5.0% vac · 8.0% maint · 8.0% mgmt
Financing live
Cash to close
- Down payment
- $25,000
- Closing costs
- $3,000
- Reserves months
- —
- Total cash needed
- —
Loan-product check · same deal, 3 products live
Conventional
25% down · 7.5% · 30yr
- Down + closing
- —
- Monthly P&I
- —
- Monthly cashflow
- —
- DSCR
- —
- Eligible?
- —
Personal DTI + credit; lowest rate.
DSCR
20% down · 8.5% · 30yr
- Down + closing
- —
- Monthly P&I
- —
- Monthly cashflow
- —
- DSCR
- —
- Eligible?
- —
No personal income docs; deal must DSCR.
Hard money
10% down · 12.0% · 12mo
- Down + closing
- —
- Monthly P&I
- —
- Monthly cashflow
- —
- DSCR
- —
- Eligible?
- —
Short-term bridge; refi at stabilization.
Listing history 19 events
-
2026-06-21days on market $100,000 Active 40 DOM
-
2026-06-21days on market $100,000 Active 39 DOM
-
2026-06-18days on market $100,000 Active 37 DOM
-
2026-06-17days on market $100,000 Active 36 DOM
-
2026-06-16days on market $100,000 Active 35 DOM
-
2026-06-15days on market $100,000 Active 34 DOM
-
2026-06-15days on market $100,000 Active 33 DOM
-
2026-06-13days on market $100,000 Active 32 DOM
-
2026-06-12days on market $100,000 Active 31 DOM
-
2026-06-09days on market $100,000 Active 28 DOM
-
2026-06-08days on market $100,000 Active 27 DOM
-
2026-06-08days on market $100,000 Active 26 DOM
-
2026-06-07days on market $100,000 Active 25 DOM
-
2026-06-04days on market $100,000 Active 23 DOM
-
2026-06-03days on market $100,000 Active 22 DOM
-
2026-06-02days on market $100,000 Active 21 DOM
-
2026-06-01days on market $100,000 Active 20 DOM
-
2026-05-31days on market $100,000 Active 19 DOM
-
2026-05-12$100,000 Active
ⓘ Source: listings_history table (triggers on properties + properties_extension) + one-shot
backfill from property_details.listing_events for pre-trigger history.
Tax reassessment forecast WV · Resets to sale price
- Current annual tax
- $638 · $53/mo
- Projected year-2 tax
- $638 · $53/mo
- Expected delta
- $0/yr ($0/mo · 0.0%)
ⓘ Screening estimate from a state-policy table — verify with the county assessor before closing.
Climate risk First Street
- Flood 1/10 Low FEMA zone X (unshaded) · 0% chance over 30 yrs
- Wildfire 5/10 Major
- Heat 4/10 Moderate 7 d/yr ≥102°F today · 18 d/yr by 30 yrs out
- Wind 2/10 Low 100% chance of damaging wind over 30 yrs
- Air quality 2/10 Low 0 unhealthy d/yr today · 1 by 30 yrs out
Nearby sold comps map
Loading sold comps map…
Walkable amenities ~0.75 mi
Loading nearby amenities…
Taxation est. · year 1
- Rental income
- $12,256
- − Mortgage interest
- −$5,602
- − Property taxes
- −$638
- − Insurance
- −$500
- − Repairs & maintenance
- −$980
- − Management
- −$980
- − Depreciation
- −$2,909
- Taxable income
- $646
- Est. tax owed @ 24.0%
- −$155
- After-tax cash flow
- $2,096/yr
For passive investors: Depreciation is non-cash, so a rental often shows a tax loss while cash-flowing — sheltering income. Rental losses are passive: they offset passive income freely, and up to $25,000/yr can offset ordinary (W-2) income if you actively participate and your MAGI is under $100k (phasing out to $0 by $150k); unused losses carry forward. On sale, claimed depreciation is recaptured at up to 25%, and gains may owe capital-gains tax (a 1031 exchange can defer both). Figures are a year-1 estimate at your 24.0% rate — not tax advice; consult a CPA.
Schools (NCES district)
- District
- Jackson County Schools
- NCES district ID
- 5400540
- Math proficiency
- 38% ▼ -6.00%
- Reading proficiency
- 45% ▼ -6.00%
- Median HH income
- $41,632
- Composite
- 34.92/100
- National rank
- #5070
- State rank
- #4 of 55 in WV
Livability — Ripley
- Score
- 74/100
- State rank
- #35
- US rank
- #4915
Category grades
Schools grade is shown separately in the Schools card above.
Census & demographics
- Population (ZIP)
- 7,974
Population outlook (Jackson County) Hauer SSP2
- Today (2025)
- 28,752 people
- By 2030
- 28,271 · -1.7%
- By 2040
- 26,970 · -6.2%
- By 2050
- 25,248 · -12.2%
- By 2075
- 20,926 · -27.2%
- By 2100
- 15,573 · -45.8%
Race, ethnicity, and origin ACS 2023
- Neighborhood character
- Predominantly White (94%)
- Race & ethnicity
- White 94% Two or more races 3% Asian 1%
- Common ancestry
- Slovak 2% Serbian 2% Lithuanian 2%
- Foreign-born
- 2%
- Languages at home
- 98% English-only · German/W. Germanic 1%
Political lean MEDSL · Jackson
- 2024 margin
- Solid R (+56.2) · D 21.1% · R 77.3% · Other 1.7%
- 2008→2024 swing
- -37.5pp toward R · 2008: -18.7pp · 2024: -56.2pp
- All cycles
- 2024: R+56.2 2020: R+51.0 2016: R+52.1 2012: R+30.9 2008: R+18.7
Not yet ingested
- Civics
- —
Market trends
- HPI YoY
- ▼ -5.15%
- Current HPI
- 177.0141
- Rent YoY
- —
- Metro
- —
- State GDP YoY
- —
- F500 in state
- 0
Price history
1 event — show timeline
- 2026-05-12 Listed $100,000 FSBO.com
Property tax history
+2.1%/yrLatest (2025): $638 · +0.7% YoY. Source: county tax records.
Cash-flow waterfall
monthlySold comps — $/sqft
last 12 mo · ≤1 miLoading sold comps…