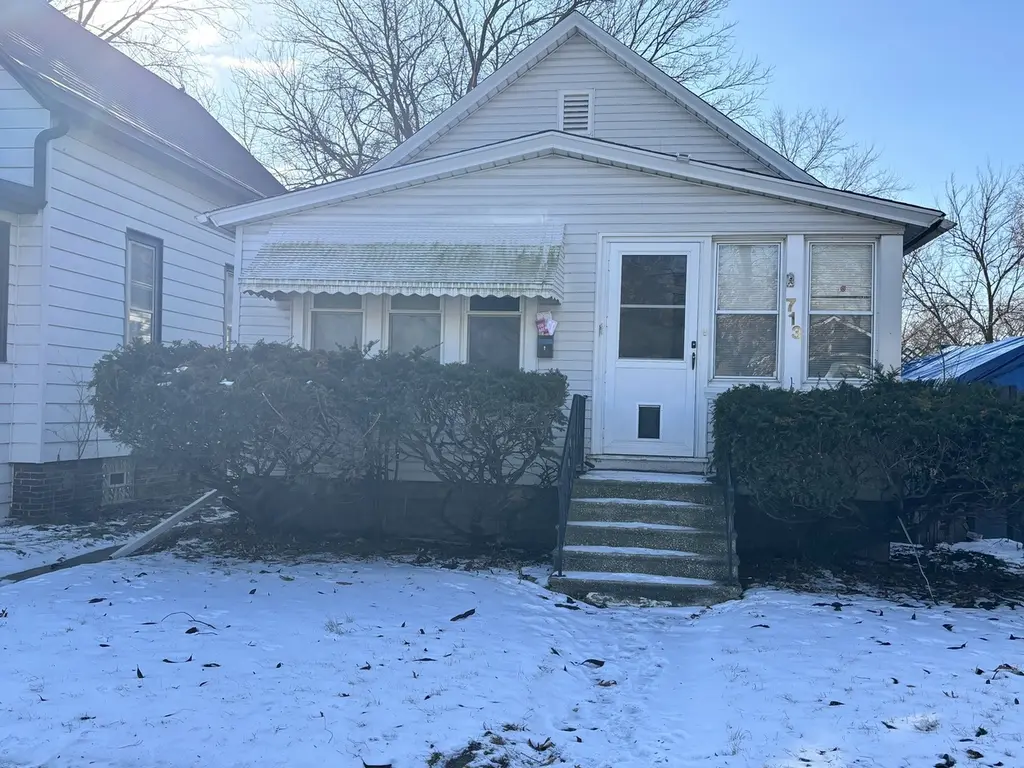
713 E 144th St · Dolton, IL
Flood risk 1/10 · Minimal
- FEMA flood zone
- X (unshaded)
- Chance of flooding over 30 yrs
- 0.0%
- Est. flood insurance / yr
- $473 – $860
Fire risk 1/10 · Minimal
- Est. fire insurance / yr
- $804 – $1,492
Heat risk 3/10 · Minor
- Hot days now (above 101°F)
- 7 days/yr
- Hot days in 30 yrs
- 15 days/yr
Wind risk 2/10 · Minimal
- Chance of severe wind over 30 yrs
- —
Air-quality risk 4/10 · Minor
- Unhealthy air days now
- 4 days/yr
- Unhealthy air days in 30 yrs
- 5 days/yr
Risk factors via First Street. Map © Google.
Why this score? — see what drove the B+ grade
The composite is a weighted blend of 9 inputs, each scored 0–100. Each bar is that input's sub-score; the figure is the points it added to the 100-point composite (weight × sub-score).
- Cash flow +30.0/30.0
- ARV discount +14.1/15.0
- 1% rule +10.0/10.0
- DSCR +10.0/10.0
- Rent growth +4.9/5.0
- Livability +3.7/5.0
- Condition / age +2.5/5.0
- Schools +0.7/10.0
- Appreciation +0.0/10.0
$100,000
🖨 Deal sheet 📄 Offer letter ✓ Due diligence
Listing remarks MLS
Nice starter home, new kitchen cabinets, refinished hardwood floors, 2 bedrooms and 1 bath. 2.5 car garage. come see this great opportunity. with little love this house could be your beautiful home, selling "as - is" condition.
Key facts
- New kitchen cabinets
- 3,750 sq ft lot
- 2 garage spots
Tags
Property features AI
Finance
- Other: Not currently leased; Possession at closing, immediate or negotiable
- HOA & community: No master association fee required
Exterior
- Parking: Detached garage (2 garage spaces, 2 total parking spaces); Owned garage
- Utilities: Lake Michigan water source; Public sewer; Electric with circuit breakers
- Home design: Detached single-family home; One story; Fee simple ownership
- Construction: Aluminum siding; Asphalt roof; Concrete perimeter foundation; Property is over 100 years old; Built before 1978
- Exterior features: Less than 0.25 acre lot; School bus, commuter bus and commuter train access nearby; Interstate access
Interior
- Kitchen: Range; Refrigerator
- Bedrooms: Master bedroom on main level (10 x 11); Second bedroom on main level (10 x 10); Additional labeled bedrooms present
- Flooring: Hardwood
- Bathrooms: One full bathroom
- Heating & cooling: Natural gas heating; Central air conditioning
- Interior features: Hardwood flooring throughout main living areas; Unfinished full basement
- Laundry & utility: Laundry in basement; Gas dryer hookup
Neighborhood map
What this means for you Summary
Snapshot
- This is a 2-bed/2.0-bath single-family listed at $100k.
Deal economics
- At list price, monthly cash flow is $459 ($6k/yr) — positive.
- The deal already cash-flows at list — no discount required.
- Meets the 1% rule at list price ($2k rent vs $100k).
- Recommended offer: $94k (6.0% below list) — sets the bar for market timing.
- Cap rate 11.8% vs local median 9.3% in Dolton — meaningfully above typical; check what's discounted (condition, days-on-market, listing class) to confirm the premium yield is real.
Location & tenants
- Location reads 74/100 on livability (#263 in IL, #4,883 nationally) — a middle-class / working-renter tenant base. Strengths: commute A+, cost of living A+, housing A+; Watch: employment C-, health & safety C-, crime D-.
- Thornton Twp Hsd 205 (suburban): math 7% / reading 8% proficiency, ranked #594 of 620 in IL (top 96%) — low school quality limits family demand, transient renter base, plan for 1-2y turnover.
- Zoned schools: Thornridge High School (math 8% / reading 8%, grade F, #589 of 693 statewide, top 86%, 1,057 students, 0% FRL).
- Market conditions: Rents rising fast (+9.7%/yr); 130 active listings in the ZIP; 15 comparable units currently listed for rent nearby; rentals leasing fast (median 10d on market — plan ~1-2 weeks tenant-placement turnaround); 6,272 units permitted in Cook County in 2024 (4,658 in 5+ unit buildings).
- This rent runs 38% of the median local income ($58k/yr) — at the standard rent-burdened threshold; future hikes will face affordability resistance.
Forward outlook
- Local home prices are declining (-3.0%/yr); year-one equity from $691 of loan paydown is wiped out by about $3k of value loss. Plan a longer hold.
- At projected returns (-3.0% appreciation + 8.0% rent growth), your $28k cash investment doubles in ~5 years — after that, you're playing with house money.
Negotiation context
- It's been on market 72 days — a 6% lower offer ($94k) is reasonable based on typical stale-listing flexibility.
- 6 sale attempts since 8y ago; this cycle's ask has dropped $30k (23%) from the opening price — seller is motivated, your offer sets the floor, not the list.
- Current owner paid $85k; 18% above their basis — modest negotiation headroom, anchor on the comps not their cost.
Risks & watch-outs
- Watch-outs: property tax is 4.9% of price; built in 1925 — expect roof / HVAC / electrical / plumbing capex.
Questions for the listing agent
- It's been on market 72 days. Have you received any prior offers? Is the seller open to a 6% concession, seller financing, or rate buy-down credit?
- Built in 1925 — when were the roof, HVAC, electrical panel, plumbing, and water heater last replaced?
- Property tax is high relative to price — has the assessment been appealed recently, and will the sale trigger a re-assessment?
- Why hasn't it sold? Are there any deal-killer items the seller is aware of (foundation, flood, title, zoning, code violations)?
- Is there a deadline driving the sale (1031 exchange, divorce, estate, relocation)? That informs how much negotiation room exists.
- Schools are F-rated, which usually means shorter tenancies and higher turnover. Who's the typical renter profile here, and what's been the actual vacancy rate?
- Crime grade is D in this area — have there been break-ins, vandalism, or insurance claims at this property in the last 3 years? What carrier currently insures it and at what premium?
- What's the average days-on-market for RENTAL listings here right now (not sales)? A rising rental-DOM trend means longer vacancies and softer asking-rent achievability than the comps imply.
- What's the recent tenant-quality profile in this submarket — average credit score on applications, eviction rate, late-payment / NSF rate, and stable-employment percentage? A property-management company in the area should have these aggregated.
- How much new for-sale + rental construction is in the pipeline within 1–3 miles? Heavy new supply typically softens prices + rents 12–24 months out; constrained supply supports both.
Investment metrics
- 1% rule
- 1.82% ✓
- Cap rate
- 11.80%
- Cash-on-cash
- 19.67%
- DSCR
- 1.88
- GRM
- 4.6
CMA / ARV
- ARV (on-the-fly)
- $117,040
- Comps found
- 12
Show comp detail 12 sales within ~0.75 mi
| Address | Dist | Beds/Ba | Sqft | Sold | Price | $/sf | Match |
|---|---|---|---|---|---|---|---|
| 14647 Irving Ave | 0.36mi | 3/2.0 (+1) | 889 (+1%) | 2mo | $138,000 | $155 | 75 |
| 14255 Greenwood Rd | 0.19mi | 3/1.0 (+1) | 840 (-4%) | 6mo | $49,000 | $58 | 70 |
| 506 E 144th Pl | 0.28mi | 3/1.0 (+1) | 912 (+4%) | 4mo | $130,000 | $143 | 69 |
| 531 Engle St | 0.28mi | 2/1.0 | 910 (+3%) | 12mo | $125,000 | $137 | 67 |
| 14840 Langley Ave | 0.63mi | 2/1.0 | 936 (+6%) | 2mo | $37,000 | $40 | 54 |
| 13910 Kanawha Ave | 0.67mi | 3/1.0 (+1) | 900 (+2%) | 7mo | $52,500 | $58 | 50 |
| 14925 Oak St | 0.68mi | 2/1.0 | 936 (+6%) | 8mo | $145,000 | $155 | 47 |
| 14819 Irving Ave | 0.55mi | 3/1.0 (+1) | 980 (+11%) | 4mo | $130,000 | $133 | 43 |
| 14915 Irving Ave | 0.67mi | 2/1.0 | 980 (+11%) | 4mo | $68,000 | $69 | 43 |
| 14835 Evans Ave | 0.65mi | 2/1.0 | 975 (+11%) | 6mo | $139,900 | $143 | 42 |
| 14841 Langley Ave | 0.63mi | 2/1.0 | 975 (+11%) | 7mo | $120,000 | $123 | 42 |
| 14811 Champlain Ave | 0.55mi | 2/1.0 | 1,000 (+14%) | 12mo | $95,000 | $95 | 38 |
Match score weights: distance 35% · size 25% · config 20% · recency 20%. Top-matched comps best support the ARV.
Projected returns pro-forma
-3.0% appreciation · 8.0% rent growth · sell at horizon
- IRR
- 18.7%
- Equity multiple
- 1.82×
- Total profit
- $22,835
- Equity at exit
- $14,910
- IRR
- 31.0%
- Equity multiple
- 4.65×
- Total profit
- $102,071
- Equity at exit
- $8,646
Cash invested: $28,000 (down + closing). Projections, not guarantees.
Landlord ↔ Tenant lean methodology
- Overall (STATE)
- 43 Moderately Tenant-Leaning
- State Illinois
- 43 Moderately Tenant-Leaning · D+7
- County
- — inherits STATE
- City
- — inherits STATE
ZIP-level market 60419
- Home prices YoY
- -25.7%
- Rents YoY
- 9.7%
- Active inventory
- 130
- Price-to-rent
- 4.6×
Monthly cashflow live
- Estimated rent
- $1,818 high interval (Pro) →
- Mortgage (P&I)
- −$524
- Tax from tax record
- −$411 /mo · $4,933/yr
- Insurance
- −$42
- HOA
- −$0
- Vacancy / Maint / Mgmt
- −$382
- Net cashflow
- $459
Break-even live
UW: 25.0% down · 7.5% · 30yr · 1.5% tax · 5.0% vac · 8.0% maint · 8.0% mgmt
Financing live
Cash to close
- Down payment
- $25,000
- Closing costs
- $3,000
- Reserves months
- —
- Total cash needed
- —
Loan-product check · same deal, 3 products live
Conventional
25% down · 7.5% · 30yr
- Down + closing
- —
- Monthly P&I
- —
- Monthly cashflow
- —
- DSCR
- —
- Eligible?
- —
Personal DTI + credit; lowest rate.
DSCR
20% down · 8.5% · 30yr
- Down + closing
- —
- Monthly P&I
- —
- Monthly cashflow
- —
- DSCR
- —
- Eligible?
- —
No personal income docs; deal must DSCR.
Hard money
10% down · 12.0% · 12mo
- Down + closing
- —
- Monthly P&I
- —
- Monthly cashflow
- —
- DSCR
- —
- Eligible?
- —
Short-term bridge; refi at stabilization.
Rent comps 15 comps
| Address | Beds | Baths | Sqft | Rent | $/sqft | DOM | Units | Dist |
|---|---|---|---|---|---|---|---|---|
| 14305 Irving Ave Unit 2 Dolton, IL | 3.0 | 1.0 | 1100 | $2,200 | $2.00 | 24d | 1 | 0.15mi |
| 14500 Cottage Grove Ave Unit 3 Dolton, IL | 2.0 | 1.0 | 1000 | $1,475 | $1.48 | 24d | 1 | 0.31mi |
| 14502 Cottage Grove Ave Unit 1S Dolton, IL | 1.0 | 1.0 | 900 | $1,425 | $1.58 | 7d | 1 | 0.31mi |
| 14817 Champlain Ave Dolton, IL | 2.0 | 1.0 | 980 | $2,430 | $2.48 | 22d | 1 | 0.54mi |
| 13841 Forest Ave Dolton, IL | 3.0 | 1.0 | 930 | $1,895 | $2.04 | 24d | 1 | 0.79mi |
| 15238 Doctor Martin Luther King Junior Dr Unit 2W Dolton, IL | 2.0 | 1.0 | 800 | $1,500 | $1.88 | 10d | 1 | 1.08mi |
| 15324 Doctor Martin Luther King Junior Dr Unit 1B Dolton, IL | 1.0 | 1.0 | 725 | $985 | $1.36 | 18d | 1 | 1.17mi |
| 14610 Blackstone Ave Dolton, IL | 3.0 | 1.0 | 1017 | $2,400 | $2.36 | 6d | 1 | 1.21mi |
| 13905 S Clark St Riverdale, IL | 1.0 | 1.0 | 685 | $1,210 | $1.77 | 7d | 6 | 1.22mi |
| 14738 Blackstone Ave Dolton, IL | 3.0 | 1.0 | 1017 | $2,400 | $2.36 | 10d | 1 | 1.26mi |
| 14101 S Atlantic Ave Riverdale, IL | 2.0 | 1.0 | 790 | $1,140 | $1.44 | 7d | 1 | 1.30mi |
| 14132 S Atlantic Ave Riverdale, IL | 1.0 | 1.0 | 900 | $1,150 | $1.28 | 24d | 1 | 1.31mi |
| 13810 S La Salle St #1 Riverdale, IL | 3.0 | 1.0 | 800 | $1,550 | $1.94 | 2d | 1 | 1.37mi |
| 14031 S School St Riverdale, IL | 1.0 | 1.0 | 620 | $1,045 | $1.69 | 3d | 1 | 1.37mi |
| 14119 S Tracy Ave Riverdale, IL | 2.0 | 1.0 | 696 | $1,205 | $1.73 | 3d | 1 | 1.41mi |
Listing history 23 events
-
2026-06-04status $100,000 Pending 72 DOM
-
2026-06-03days on market $100,000 Contingent - Continue to Show 72 DOM
-
2026-06-02days on market $100,000 Contingent - Continue to Show 71 DOM
-
2026-06-01days on market $100,000 Contingent - Continue to Show 70 DOM
-
2026-05-31days on market $100,000 Contingent - Continue to Show 69 DOM
-
2026-05-22historical Contingent - Continue to Show
-
2026-05-01price $100,000
-
2026-04-07price $109,900
-
2026-03-31price $119,900
-
2026-03-23$129,900 Active
-
2026-03-17historical $2,000
-
2026-01-24$2,000
-
2022-04-14soldstatus $85,000
-
2022-04-01soldstatus $85,000 Closed 238-char remark
Show marketing remark (238 chars)
Nice starter home, new kitchen cabinets, refinished hardwood floors, 2 bedrooms and 1 bath. 2.5 car garage. come see this great opportunity. with little love this house could be your beautiful home, selling "as - is" condition.
-
2022-03-08historical Contingent - No Showings 238-char remark
Show marketing remark (238 chars)
Nice starter home, new kitchen cabinets, refinished hardwood floors, 2 bedrooms and 1 bath. 2.5 car garage. come see this great opportunity. with little love this house could be your beautiful home, selling "as - is" condition.
-
2022-02-23status Active 238-char remark
Show marketing remark (238 chars)
Nice starter home, new kitchen cabinets, refinished hardwood floors, 2 bedrooms and 1 bath. 2.5 car garage. come see this great opportunity. with little love this house could be your beautiful home, selling "as - is" condition.
-
2022-02-15historical Contingent - No Showings 238-char remark
Show marketing remark (238 chars)
Nice starter home, new kitchen cabinets, refinished hardwood floors, 2 bedrooms and 1 bath. 2.5 car garage. come see this great opportunity. with little love this house could be your beautiful home, selling "as - is" condition.
-
2022-02-03$84,900 Active 238-char remark
Show marketing remark (238 chars)
Nice starter home, new kitchen cabinets, refinished hardwood floors, 2 bedrooms and 1 bath. 2.5 car garage. come see this great opportunity. with little love this house could be your beautiful home, selling "as - is" condition.
-
2021-10-31Active
-
2018-06-12soldstatus $35,000 Closed Sale
-
2018-04-25historical Contingent
-
2018-04-12$35,000 New
-
1995-10-25soldstatus $52,500
ⓘ Source: listings_history table (triggers on properties + properties_extension) + one-shot
backfill from property_details.listing_events for pre-trigger history.
Tax reassessment forecast IL · Partial reset (capped growth)
- Current annual tax
- $4,933 · $411/mo
- Projected year-2 tax
- $4,933 · $411/mo
- Expected delta
- $0/yr ($0/mo · 0.0%)
ⓘ Screening estimate from a state-policy table — verify with the county assessor before closing.
Climate risk First Street
- Flood 1/10 Low FEMA zone X (unshaded) · 0% chance over 30 yrs
- Wildfire 1/10 Low
- Heat 3/10 Moderate 7 d/yr ≥101°F today · 15 d/yr by 30 yrs out
- Wind 2/10 Low
- Air quality 4/10 Moderate 4 unhealthy d/yr today · 5 by 30 yrs out
Nearby sold comps map
Loading sold comps map…
Walkable amenities ~0.75 mi
Loading nearby amenities…
Taxation est. · year 1
- Rental income
- $21,813
- − Mortgage interest
- −$5,602
- − Property taxes
- −$4,933
- − Insurance
- −$500
- − Repairs & maintenance
- −$1,745
- − Management
- −$1,745
- − Depreciation
- −$2,909
- Taxable income
- $4,380
- Est. tax owed @ 24.0%
- −$1,051
- After-tax cash flow
- $4,456/yr
For passive investors: Depreciation is non-cash, so a rental often shows a tax loss while cash-flowing — sheltering income. Rental losses are passive: they offset passive income freely, and up to $25,000/yr can offset ordinary (W-2) income if you actively participate and your MAGI is under $100k (phasing out to $0 by $150k); unused losses carry forward. On sale, claimed depreciation is recaptured at up to 25%, and gains may owe capital-gains tax (a 1031 exchange can defer both). Figures are a year-1 estimate at your 24.0% rate — not tax advice; consult a CPA.
Schools (NCES district)
- District
- Thornton Twp Hsd 205
- NCES district ID
- 1738970
- Math proficiency
- 7% ▬ 0.00%
- Reading proficiency
- 8% ▼ -2.00%
- Median HH income
- $43,392
- Composite
- 6.92/100
- National rank
- #9976
- State rank
- #594 of 620 in IL
Livability — Dolton
- Score
- 74/100
- State rank
- #263
- US rank
- #4883
Category grades
Schools grade is shown separately in the Schools card above.
Census & demographics
- Census place
- Dolton, IL
- County
- Cook County · 4,486,803 people
- City population
- 20,825
- Metro
- Chicago-Naperville-Elgin, IL-IN-WI
- Population (ZIP)
- 20,825
- Household income
- $57,887
- Rent vs Own
- Severe rent burden
- 919.0
Population outlook (Cook County) Hauer SSP2
- Today (2025)
- 5,347,519 people
- By 2030
- 5,357,703 · +0.2%
- By 2040
- 5,324,924 · -0.4%
- By 2050
- 5,230,762 · -2.2%
- By 2075
- 4,785,735 · -10.5%
- By 2100
- 4,188,836 · -21.7%
Race, ethnicity, and origin ACS 2023
- Neighborhood character
- Predominantly Black (91%)
- Race & ethnicity
- Black 91% White 4% Two or more races 3% Hispanic / Latino 1%
- Common ancestry
- Romanian 1% Hispanic 1%
- Foreign-born
- 3% · Canada
- Languages at home
- 95% English-only · French/Haitian/Cajun 2% Spanish 1%
Political lean MEDSL · Cook
- 2024 margin
- Solid D (+42.0) · D 70.4% · R 28.4% · Other 1.2%
- 2008→2024 swing
- -11.4pp toward R · 2008: 53.4pp · 2024: 42.0pp
- All cycles
- 2024: D+42.0 2020: D+50.3 2016: D+53.0 2012: D+49.4 2008: D+53.4
Not yet ingested
- Civics
- —
Market trends
- HPI YoY
- ▼ -66.88%
- Current HPI
- 193.2346
- Rent YoY
- ▲ 9.65%
- Metro
- Chicago-Naperville-Elgin, IL-IN-WI
- State GDP YoY
- ▲ 1.59%
- F500 in state
- 60
Industry mix (Fortune 500 HQ in IL)
| Industry | F500 HQs | Revenue |
|---|---|---|
| Insurance | 4 | $201B |
|
||
| Consumer Goods | 4 | $87B |
|
||
| Industrial Machinery | 3 | $64B |
|
||
| Healthcare | 2 | $55B |
|
||
| Retail / Pharmacy | 1 | $148B |
|
||
| Agriculture / Food | 1 | $86B |
|
||
Price history
+90.5% since first listed18 events — show timeline
- 2026-05-22 Contingent — MRED as Distributed by MLS Grid
- 2026-05-01 Price Changed $100,000 MRED as Distributed by MLS Grid
- 2026-04-07 Price Changed $109,900 MRED as Distributed by MLS Grid
- 2026-03-31 Price Changed $119,900 MRED as Distributed by MLS Grid
- 2026-03-23 Listed $129,900 MRED as Distributed by MLS Grid
- 2026-03-17 Rental Removed $2,000 MRED
- 2026-01-24 Listed for Rent $2,000 MRED
- 2022-04-14 Sold (Public Records) $85,000 Public Records
- 2022-04-01 Sold (MLS) $85,000 MRED as Distributed by MLS Grid
- 2022-03-08 Contingent — MRED as Distributed by MLS Grid
- 2022-02-23 Relisted — MRED as Distributed by MLS Grid
- 2022-02-15 Contingent — MRED as Distributed by MLS Grid
- 2022-02-03 Listed $84,900 MRED as Distributed by MLS Grid
- 2021-10-31 Listed — MRED as Distributed by MLS Grid
- 2018-06-12 Sold (MLS) $35,000 MRED as Distributed by MLS Grid
- 2018-04-25 Contingent — MRED as Distributed by MLS Grid
- 2018-04-12 Listed $35,000 MRED as Distributed by MLS Grid
- 1995-10-25 Sold (Public Records) $52,500 Public Records
Property tax history
+5.2%/yrLatest (2023): $4,933 · +1192.9% YoY. Source: county tax records.
Cash-flow waterfall
monthlySold comps — $/sqft
last 12 mo · ≤1 miLoading sold comps…