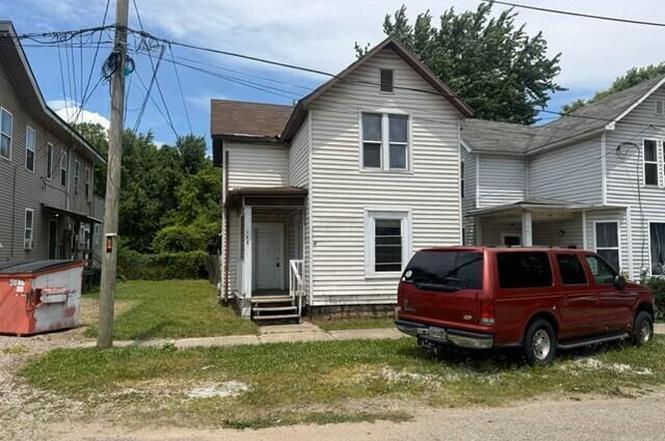
148 E Church St · Newark, OH
Flood risk 6/10 · Moderate
- FEMA flood zone
- X (shaded)
- Chance of flooding over 30 yrs
- 0.69%
- Est. flood insurance / yr
- $473 – $860
Fire risk 1/10 · Minimal
- Est. fire insurance / yr
- $713 – $1,323
Heat risk 3/10 · Minor
- Hot days now (above 98°F)
- 7 days/yr
- Hot days in 30 yrs
- 18 days/yr
Wind risk 2/10 · Minimal
- Chance of severe wind over 30 yrs
- 0.0%
Air-quality risk 2/10 · Minimal
- Unhealthy air days now
- 1 days/yr
- Unhealthy air days in 30 yrs
- 2 days/yr
Risk factors via First Street. Map © Google.
Why this score? — see what drove the B grade
The composite is a weighted blend of 9 inputs, each scored 0–100. Each bar is that input's sub-score; the figure is the points it added to the 100-point composite (weight × sub-score).
- Cash flow +30.0/30.0
- 1% rule +10.0/10.0
- DSCR +10.0/10.0
- ARV discount +7.5/15.0
- Schools +4.3/10.0
- Livability +3.5/5.0
- Rent growth +2.9/5.0
- Condition / age +2.5/5.0
- Appreciation +0.0/10.0
$65,000
🖨 Deal sheet 📄 Offer letter ✓ Due diligence
Listing remarks
Seller is in receipt of multiple offers. Please submit highest and best offers by EOD Friday 6/19/26. Great opportunity to own this move in ready home offering 3 bedrooms and 2 full baths. Located across the street from a park and near downtown Newark and OSU Newark Campus. Agents- Please read A2A remarks.
Key facts
- Near downtown newark
- Move in ready
- 2,178 sq ft lot
Tags
Property features AI
Finance
- Other: Property listed as real estate owned / standard listing conditions
- Financial info: 2025 annual tax: $749
Exterior
- Parking: On-street parking
- Utilities: Public water; Public sewer
- Home design: Single-family home; Two levels; Built in 1910; No shared/common walls
- Construction: Block and stone foundation
- Exterior features: Lot approximately 0.05 acres
Interior
- Bedrooms: One main-level bedroom
- Bathrooms: Two full bathrooms
- Interior features: Partial basement; Living area approximately 1,162
Neighborhood map
What this means for you Summary
Snapshot
- This is a 3-bed/1.0-bath single-family listed at $65k.
Deal economics
- At list price, monthly cash flow is $622 ($7k/yr) — positive.
- The deal already cash-flows at list — no discount required.
- Meets the 1% rule at list price ($1k rent vs $65k).
- Cap rate 17.8% vs local median 3.2% in Newark — top-decile yield for the area; either an underpriced asset or a hidden risk that comps aren't pricing in. Stress-test before assuming the spread holds.
Location & tenants
- Location reads 69/100 on livability (#493 in OH) — a middle-class / working-renter tenant base. Strengths: cost of living A+, housing A+, schools B; Watch: employment D+, amenities F, commute F.
- Newark City (suburban): math 48% / reading 56% proficiency, ranked #431 of 656 in OH (top 66%) — acceptable for families but not a draw, mixed tenant base, ~2y average lease.
- Market conditions: Rents rising (+1.6%/yr); 204 active listings in the ZIP; 18 comparable units currently listed for rent nearby; rentals leasing fast (median 11d on market — plan ~1-2 weeks tenant-placement turnaround); 159 units permitted in Licking County in 2024 (0 in 5+ unit buildings).
Forward outlook
- Local home prices are declining (-3.0%/yr); year-one equity from $449 of loan paydown is wiped out by about $2k of value loss. Plan a longer hold.
- At projected returns (-3.0% appreciation + 1.6% rent growth), your $18k cash investment doubles in ~3 years — after that, you're playing with house money.
Negotiation context
- Only 7 days on market — expect competitive offers; lowballing is unlikely to land.
- 5 sale attempts since 4y ago with the ask held roughly flat each time — persistent listings suggest the price (not the market) is what's stuck; bring a comps-based counter.
- Current owner paid $46k; 41% above their basis — modest negotiation headroom, anchor on the comps not their cost.
Risks & watch-outs
- Watch-outs: built in 1910 — expect roof / HVAC / electrical / plumbing capex.
- Climate carrying-cost: major flood risk — expect insurance premiums to compound above CPI over the hold.
Questions for the listing agent
- Built in 1910 — when were the roof, HVAC, electrical panel, plumbing, and water heater last replaced?
- Is there a deadline driving the sale (1031 exchange, divorce, estate, relocation)? That informs how much negotiation room exists.
- Schools are B-rated — typically a magnet for longer-tenancy family renters. What's the average tenant stay here, and is there a school-zone premium baked into asking?
- What's the average days-on-market for RENTAL listings here right now (not sales)? A rising rental-DOM trend means longer vacancies and softer asking-rent achievability than the comps imply.
- What's the recent tenant-quality profile in this submarket — average credit score on applications, eviction rate, late-payment / NSF rate, and stable-employment percentage? A property-management company in the area should have these aggregated.
- How much new for-sale + rental construction is in the pipeline within 1–3 miles? Heavy new supply typically softens prices + rents 12–24 months out; constrained supply supports both.
Investment metrics
- 1% rule
- 2.05% ✓
- Cap rate
- 17.77%
- Cash-on-cash
- 40.99%
- DSCR
- 2.82
- GRM
- 4.1
CMA / ARV
- ARV (on-the-fly)
- $173,138
- Comps found
- 12
Show comp detail 12 sales within ~0.75 mi
| Address | Dist | Beds/Ba | Sqft | Sold | Price | $/sf | Match |
|---|---|---|---|---|---|---|---|
| 75 Gay St | 0.53mi | 3/1.0 | 1,178 (+1%) | 1mo | $155,000 | $132 | 72 |
| 232 Rosehill Ave | 0.59mi | 3/2.0 | 1,128 (-3%) | 5mo | $185,900 | $165 | 59 |
| 92 S 3rd St | 0.48mi | 4/1.0 (+1) | 1,232 (+6%) | 5mo | $142,000 | $115 | 59 |
| 421 E Main St | 0.73mi | 3/1.0 | 1,174 (+1%) | 9mo | $133,900 | $114 | 57 |
| 273 Buckingham St | 0.74mi | 3/1.0 | 1,104 (-5%) | 1mo | $165,000 | $149 | 56 |
| 136 Hunter St | 0.46mi | 3/1.0 | 1,054 (-9%) | 8mo | $168,000 | $159 | 56 |
| 241 Hunter St | 0.53mi | 3/2.0 | 1,272 (+10%) | 1mo | $195,000 | $153 | 55 |
| 284 Everett Ave | 0.46mi | 3/1.0 | 1,310 (+13%) | 8mo | $200,000 | $153 | 51 |
| 53 Poplar Ave | 0.74mi | 3/2.0 | 1,114 (-4%) | 5mo | $208,500 | $187 | 50 |
| 11 Fleek Ave | 0.52mi | 3/1.0 | 1,320 (+14%) | 6mo | $123,500 | $94 | 48 |
| 390 Cedarcrest Ave | 0.62mi | 3/1.0 | 1,326 (+14%) | 7mo | $115,500 | $87 | 42 |
| 337 Schuler St | 0.67mi | 2/1.0 (-1) | 1,320 (+14%) | 2mo | $165,000 | $125 | 40 |
Match score weights: distance 35% · size 25% · config 20% · recency 20%. Top-matched comps best support the ARV.
Projected returns pro-forma
-3.0% appreciation · 1.63% rent growth · sell at horizon
- IRR
- 36.0%
- Equity multiple
- 2.50×
- Total profit
- $27,261
- Equity at exit
- $9,692
- IRR
- 42.0%
- Equity multiple
- 4.71×
- Total profit
- $67,530
- Equity at exit
- $5,620
Cash invested: $18,200 (down + closing). Projections, not guarantees.
Landlord ↔ Tenant lean methodology
- Overall (STATE)
- 73 Landlord-Friendly
- State Ohio
- 73 Landlord-Friendly · R+6
- County
- — inherits STATE
- City
- — inherits STATE
ZIP-level market 43055
- Rents YoY
- 1.6%
- Active inventory
- 204
- Price-to-rent
- 4.1×
Monthly cashflow live
- Estimated rent
- $1,332 high interval (Pro) →
- Mortgage (P&I)
- −$341
- Tax from tax record
- −$62 /mo · $749/yr
- Insurance
- −$27
- HOA
- −$0
- Vacancy / Maint / Mgmt
- −$280
- Net cashflow
- $622
Break-even live
UW: 25.0% down · 7.5% · 30yr · 1.5% tax · 5.0% vac · 8.0% maint · 8.0% mgmt
Financing live
Cash to close
- Down payment
- $16,250
- Closing costs
- $1,950
- Reserves months
- —
- Total cash needed
- —
Loan-product check · same deal, 3 products live
Conventional
25% down · 7.5% · 30yr
- Down + closing
- —
- Monthly P&I
- —
- Monthly cashflow
- —
- DSCR
- —
- Eligible?
- —
Personal DTI + credit; lowest rate.
DSCR
20% down · 8.5% · 30yr
- Down + closing
- —
- Monthly P&I
- —
- Monthly cashflow
- —
- DSCR
- —
- Eligible?
- —
No personal income docs; deal must DSCR.
Hard money
10% down · 12.0% · 12mo
- Down + closing
- —
- Monthly P&I
- —
- Monthly cashflow
- —
- DSCR
- —
- Eligible?
- —
Short-term bridge; refi at stabilization.
Rent comps 18 comps
| Address | Beds | Baths | Sqft | Rent | $/sqft | DOM | Units | Dist |
|---|---|---|---|---|---|---|---|---|
| 150 N 1st St Newark, OH | 3.0 | 1.0 | 1467 | $1,300 | $0.89 | 17d | 1 | 0.13mi |
| 27 N Buena Vista St Newark, OH | 3.0 | 2.0 | 1500 | $1,300 | $0.87 | 11d | 1 | 0.21mi |
| 63 N 4th St Newark, OH | 3.0 | 1.0 | 1300 | $1,350 | $1.04 | 3d | 1 | 0.42mi |
| 63 N 4th St Unit 302 Newark, OH | 3.0 | 1.0 | 1300 | $1,350 | $1.04 | 4d | 1 | 0.42mi |
| 270 Everett Ave Newark, OH | 3.0 | 1.0 | 864 | $1,425 | $1.65 | 1d | 1 | 0.45mi |
| 71 W Locust St Newark, OH | 2.0 | 1.0 | 1371 | $1,225 | $0.89 | 23d | 1 | 0.48mi |
| 388 Indiana St Newark, OH | 2.0 | 1.0 | 1200 | $1,100 | $0.92 | 1d | 1 | 0.72mi |
| 51 Mill St Newark, OH | 2.0 | 1.0 | 1024 | $1,200 | $1.17 | 1d | 1 | 0.75mi |
| 33 Jefferson St Newark, OH | 2.0 | 1.0 | 1200 | $1,300 | $1.08 | 12d | 1 | 0.77mi |
| 8 N 8th St Unit 2 Newark, OH | 3.0 | 1.0 | 1400 | $1,400 | $1.00 | 23d | 1 | 0.80mi |
| 86 Wilwood Ave Newark, OH | 3.0 | 1.0 | 1205 | $1,595 | $1.32 | 1d | 1 | 0.81mi |
| 73 N 9th St Unit 73 Newark, OH | 2.0 | 1.0 | 1250 | $950 | $0.76 | 23d | 1 | 0.89mi |
| 202 N 11th St Newark, OH | 2.0 | 1.0 | 1011 | $1,195 | $1.18 | 14d | 1 | 0.99mi |
| 39 Charles St Newark, OH | 3.0 | 1.5 | 1450 | $1,649 | $1.14 | 23d | 1 | 1.09mi |
| 374 Seroco Ave Newark, OH | 2.0 | 1.0 | 1100 | $1,100 | $1.00 | 10d | 1 | 1.17mi |
| 290 W National Dr Unit A1 Newark, OH | 2.0 | 1.0 | 900 | $950 | $1.06 | 1d | 1 | 1.19mi |
| 494 Allston Ave Newark, OH | 2.0 | 1.0 | 724 | $1,150 | $1.59 | 43d | 1 | 1.20mi |
| 681 Maple Ave Newark, OH | 3.0 | 1.0 | 1100 | $1,599 | $1.45 | 1d | 1 | 1.31mi |
Listing history 8 events
-
2026-06-18remarks 307-char remark
-
2026-06-18days on market $65,000 Active 7 DOM
-
2026-06-17days on market $65,000 Active 6 DOM
-
2026-06-16days on market $65,000 Active 5 DOM
-
2026-06-15days on market $65,000 Active 4 DOM
-
2026-06-13days on market $65,000 Active 2 DOM
-
2026-06-13remarks 205-char remark
-
2026-06-13$65,000 Active 1 DOM
ⓘ Source: listings_history table (triggers on properties + properties_extension) + one-shot
backfill from property_details.listing_events for pre-trigger history.
Tax reassessment forecast OH · Partial reset (capped growth)
- Current annual tax
- $749 · $62/mo
- Projected year-2 tax
- $882 · $73/mo
- Expected delta
- +$132/yr (+$11/mo · 17.6%)
ⓘ Screening estimate from a state-policy table — verify with the county assessor before closing.
Climate risk First Street
- Flood 6/10 Major FEMA zone X (shaded) · 69% chance over 30 yrs
- Wildfire 1/10 Low
- Heat 3/10 Moderate 7 d/yr ≥98°F today · 18 d/yr by 30 yrs out
- Wind 2/10 Low 0% chance of damaging wind over 30 yrs
- Air quality 2/10 Low 1 unhealthy d/yr today · 2 by 30 yrs out
Nearby sold comps map
Loading sold comps map…
Walkable amenities ~0.75 mi
Loading nearby amenities…
Taxation est. · year 1
- Rental income
- $15,981
- − Mortgage interest
- −$3,641
- − Property taxes
- −$749
- − Insurance
- −$325
- − Repairs & maintenance
- −$1,279
- − Management
- −$1,279
- − Depreciation
- −$1,891
- Taxable income
- $6,818
- Est. tax owed @ 24.0%
- −$1,636
- After-tax cash flow
- $5,824/yr
For passive investors: Depreciation is non-cash, so a rental often shows a tax loss while cash-flowing — sheltering income. Rental losses are passive: they offset passive income freely, and up to $25,000/yr can offset ordinary (W-2) income if you actively participate and your MAGI is under $100k (phasing out to $0 by $150k); unused losses carry forward. On sale, claimed depreciation is recaptured at up to 25%, and gains may owe capital-gains tax (a 1031 exchange can defer both). Figures are a year-1 estimate at your 24.0% rate — not tax advice; consult a CPA.
Schools (NCES district)
- District
- Newark City
- NCES district ID
- 3904445
- Math proficiency
- 48% ▼ -12.00%
- Reading proficiency
- 56% ▼ -3.00%
- Median HH income
- $38,662
- Composite
- 43.33/100
- National rank
- #3034
- State rank
- #431 of 656 in OH
Livability — Newark
- Score
- 69/100
- State rank
- #493
- US rank
- #8263
Category grades
Schools grade is shown separately in the Schools card above.
Census & demographics
- Census place
- Newark, OH
- County
- Licking County · 109,194 people
- City population
- 63,281
- Metro
- Columbus, OH
- Population (ZIP)
- 63,281
- Household income
- $63,974
- Rent vs Own
- Severe rent burden
- 2269.0
Population outlook (Licking County) Hauer SSP2
- Today (2025)
- 178,210 people
- By 2030
- 180,917 · +1.5%
- By 2040
- 183,885 · +3.2%
- By 2050
- 182,985 · +2.7%
- By 2075
- 178,377 · +0.1%
- By 2100
- 161,075 · -9.6%
Race, ethnicity, and origin ACS 2023
- Neighborhood character
- Predominantly White (89%)
- Race & ethnicity
- White 89% Two or more races 5% Black 3% Hispanic / Latino 2%
- Common ancestry
- Slovak 2% Romanian 2% Lithuanian 2%
- Foreign-born
- 2% · Canada
- Languages at home
- 96% English-only · Spanish 2% Arabic 1%
Political lean MEDSL · Licking
- 2024 margin
- Solid R (+30.0) · D 34.5% · R 64.6%
- 2008→2024 swing
- -14.2pp toward R · 2008: -15.8pp · 2024: -30.0pp
- All cycles
- 2024: R+30.0 2020: R+28.1 2016: R+28.9 2012: R+14.7 2008: R+15.8
Not yet ingested
- Civics
- —
Market trends
- HPI YoY
- ▼ -253.54%
- Current HPI
- 247.9425
- Rent YoY
- ▲ 1.63%
- Metro
- Columbus, OH
- State GDP YoY
- ▲ 1.98%
- F500 in state
- 48
Industry mix (Fortune 500 HQ in OH)
| Industry | F500 HQs | Revenue |
|---|---|---|
| Insurance | 3 | $145B |
|
||
| Industrial Machinery | 3 | $49B |
|
||
| Financial Services | 3 | $24B |
|
||
| Consumer Goods | 2 | $93B |
|
||
| Aerospace / Defense | 2 | $47B |
|
||
| Utilities | 2 | $33B |
|
||
Price history
+441.7% since first listed15 events — show timeline
- 2026-06-11 Listed $65,000 CBRMLS
- 2024-05-01 Listing Removed — CBRMLS
- 2023-10-11 Price Changed $149,900 CBRMLS
- 2023-09-20 Price Changed $159,900 CBRMLS
- 2023-09-20 Relisted — CBRMLS
- 2023-09-13 Listing Removed — CBRMLS
- 2023-09-12 Listed $169,900 CBRMLS
- 2022-09-01 Listing Removed — CBRMLS
- 2022-08-04 Price Changed $140,000 CBRMLS
- 2022-08-04 Relisted — CBRMLS
- 2022-08-03 Listing Removed — CBRMLS
- 2022-07-18 Listed $149,800 CBRMLS
- 2022-04-26 Sold (Public Records) $46,000 Public Records
- 1998-12-01 Sold (Public Records) $15,000 Public Records
- 1998-11-06 Sold (Public Records) $12,000 Public Records
Property tax history
+7.9%/yrLatest (2025): $749 · +2.9% YoY. Source: county tax records.
Cash-flow waterfall
monthlySold comps — $/sqft
last 12 mo · ≤1 miLoading sold comps…