 🏷️ Likely Rental
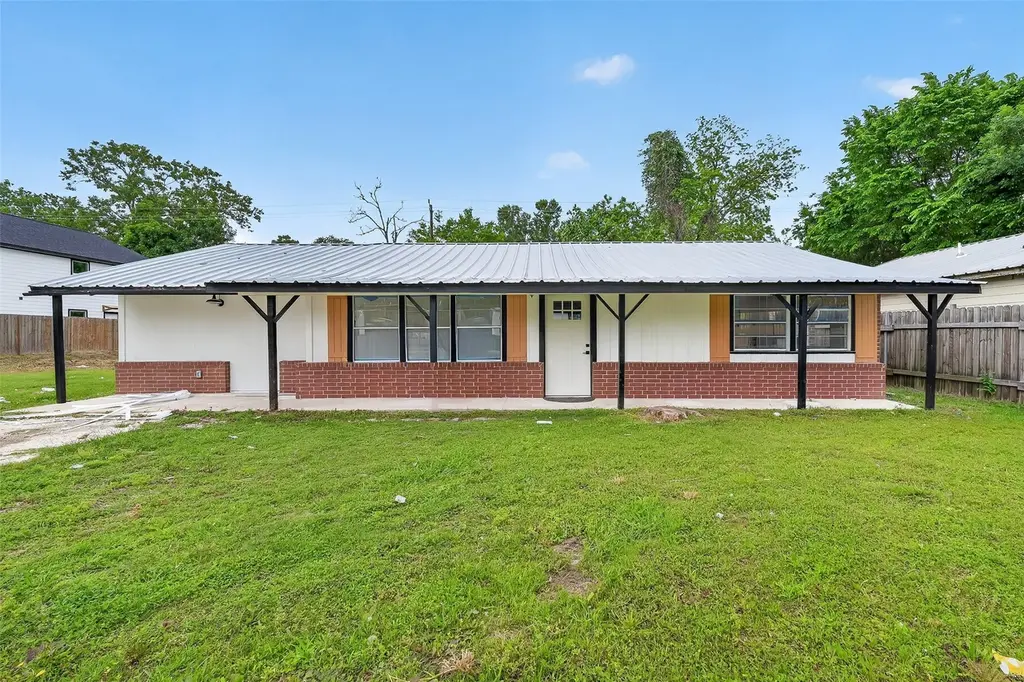
8221 Bigwood St · Houston, TX
Flood risk 1/10 · Minimal
- FEMA flood zone
- X (unshaded)
- Chance of flooding over 30 yrs
- 0.0%
- Est. flood insurance / yr
- $507 – $1,088
Fire risk 4/10 · Minor
- Est. fire insurance / yr
- $1,222 – $2,270
Heat risk 9/10 · Severe
- Hot days now (above 111°F)
- 7 days/yr
- Hot days in 30 yrs
- 24 days/yr
Wind risk 9/10 · Severe
- Chance of severe wind over 30 yrs
- 99.0%
Air-quality risk 3/10 · Minor
- Unhealthy air days now
- 3 days/yr
- Unhealthy air days in 30 yrs
- 3 days/yr
Risk factors via First Street. Map © Google.
Why this score? — see what drove the C- grade
The composite is a weighted blend of 9 inputs, each scored 0–100. Each bar is that input's sub-score; the figure is the points it added to the 100-point composite (weight × sub-score).
- Cash flow +15.0/30.0
- ARV discount +7.5/15.0
- Appreciation +6.2/10.0
- 1% rule +5.0/10.0
- DSCR +5.0/10.0
- Livability +3.7/5.0
- Schools +2.7/10.0
- Rent growth +2.5/5.0
- Condition / age +2.5/5.0
$1,975
🖨 Deal sheet 📄 Offer letter ✓ Due diligence
Key facts
- 0.33 acre lot
- 5 parking spots
- Built 1946
Property features AI
Finance
- Other: Municipal Utility District disclosure provided
- Financial info: Lease considered
Exterior
- Parking: Attached carport; Carport with space for 5 vehicles
- Utilities: Public water
- Home design: Residential property; Built in 1946; Slab foundation
- Construction: Brick and stone construction; Metal roof
- Exterior features: Lot includes 'Other' features
Interior
- Bathrooms: 2 full bathrooms
- Heating & cooling: Central heating (gas); Central air conditioning (gas)
- Interior features: 5 total rooms
Neighborhood map
What this means for you Summary
Snapshot
- This is a 3-bed/1.0-bath single-family listed at $2k.
Deal economics
- At list price, monthly cash flow is $1k ($16k/yr) — positive.
- The deal already cash-flows at list — no discount required.
- Meets the 1% rule at list price ($2k rent vs $2k).
- Cap rate 814.3% vs local median 3.2% in Houston — top-decile yield for the area; either an underpriced asset or a hidden risk that comps aren't pricing in. Stress-test before assuming the spread holds.
Location & tenants
- Location reads 74/100 on livability (#184 in TX, #4,771 nationally) — a middle-class / working-renter tenant base. Strengths: amenities A+, cost of living A+, housing A+; Watch: crime F.
- Houston ISD (urban): math 27% / reading 35% proficiency, ranked #593 of 826 in TX (top 72%) — families likely to look elsewhere, expect single-tenant / working-renter base with shorter leases; 71% free/reduced lunch — lower-income household profile, screen leases tightly.
- Zoned schools: Forest Brook Middle (math 12% / reading 14%, grade F, #1,609 of 1,662 statewide, top 97%, 613 students, 98% FRL); North Forest H S (math 13% / reading 18%, grade F, #1,505 of 1,632 statewide, top 92%, 974 students, 97% FRL) — zoned schools average 98% FRL vs 71% district-wide (27 pts higher); higher-poverty schools than district average — tighter screening recommended.
- Zoned-school proficiency averages 14% at this address vs 31% district-wide (-17 pts) — the specific schools serving this property underperform the Houston ISD average; the district grade overstates school quality for this exact location.
- Market conditions: 129 active listings in the ZIP; 40 comparable units currently listed for rent nearby; rentals at typical pace (median 24d on market — plan ~3-4 weeks tenant-placement turnaround); 45% of comp listings sitting > 30 days — soft ceiling on asking rent; lower-income renter base — watch delinquency; 29,883 units permitted in Harris County in 2024 (8,621 in 5+ unit buildings).
- At $1,701/mo this rent would consume 52% of the median local household income ($39k/yr) (locally 780% of renters already pay >50% of income on rent) — very limited rent-growth headroom before tenants either downsize or default.
Forward outlook
- In year one you build about $62 of equity ($13 loan paydown + $49 appreciation (2.5% local appreciation)).
- Harris County population projected at +47% by 2050 — long-run rental-demand tailwind backs the buy-and-hold thesis.
- At projected returns (2.5% appreciation + 3.0% rent growth), your $553 cash investment doubles in ~1 year — after that, you're playing with house money.
Negotiation context
- Only 1 days on market — expect competitive offers; lowballing is unlikely to land.
Risks & watch-outs
- Watch-outs: built in 1946 — expect roof / HVAC / electrical / plumbing capex.
- Climate carrying-cost: severe wind risk, 99% chance of damaging wind over 30y; extreme-heat days projected 7→24/yr by 2055 (HVAC capex compounding) — expect insurance premiums to compound above CPI over the hold.
Questions for the listing agent
- Built in 1946 — when were the roof, HVAC, electrical panel, plumbing, and water heater last replaced?
- Is there a deadline driving the sale (1031 exchange, divorce, estate, relocation)? That informs how much negotiation room exists.
- Schools are D-rated, which usually means shorter tenancies and higher turnover. Who's the typical renter profile here, and what's been the actual vacancy rate?
- Crime grade is F in this area — have there been break-ins, vandalism, or insurance claims at this property in the last 3 years? What carrier currently insures it and at what premium?
- What's the average days-on-market for RENTAL listings here right now (not sales)? A rising rental-DOM trend means longer vacancies and softer asking-rent achievability than the comps imply.
- What's the recent tenant-quality profile in this submarket — average credit score on applications, eviction rate, late-payment / NSF rate, and stable-employment percentage? A property-management company in the area should have these aggregated.
- How much new for-sale + rental construction is in the pipeline within 1–3 miles? Heavy new supply typically softens prices + rents 12–24 months out; constrained supply supports both.
Investment metrics
- 1% rule
- 86.11% ✓
- Cap rate
- 814.30%
- Cash-on-cash
- 2885.73%
- DSCR
- 129.40
- GRM
- 0.1
CMA / ARV
- ARV (on-the-fly)
- $277,324
- Comps found
- 12
Show comp detail 12 sales within ~0.75 mi
| Address | Dist | Beds/Ba | Sqft | Sold | Price | $/sf | Match |
|---|---|---|---|---|---|---|---|
| 9901 Wiloak St | 0.10mi | 2/2.0 (-1) | 1,656 (+6%) | 0mo | $125,000 | $75 | 76 |
| 7909 Elisha Park Dr | 0.48mi | 3/2.0 | 1,544 (-1%) | 2mo | $250,000 | $162 | 71 |
| 9606 Jenny Park Pl | 0.43mi | 3/2.5 | 1,609 (+3%) | 1mo | $254,000 | $158 | 67 |
| 8124 Burnt Orchid Dr | 0.63mi | 3/2.0 | 1,571 (+1%) | 1mo | $279,900 | $178 | 64 |
| 8207 Burnt Orchid Dr | 0.65mi | 3/2.0 | 1,571 (+1%) | 1mo | $279,900 | $178 | 64 |
| 7918 Cassie Pine Dr | 0.57mi | 3/2.0 | 1,412 (-9%) | 0mo | $278,290 | $197 | 54 |
| 7914 Cassie Pine Dr | 0.59mi | 3/2.0 | 1,401 (-10%) | 0mo | $274,290 | $196 | 52 |
| 7904 Cassie Pine Dr | 0.62mi | 3/2.0 | 1,412 (-9%) | 0mo | $281,040 | $199 | 51 |
| 7902 Elowen Grove Dr | 0.64mi | 3/2.0 | 1,412 (-9%) | 2mo | $277,290 | $196 | 49 |
| 10315 Vinca Minor Ln | 0.67mi | 3/2.0 | 1,412 (-9%) | 1mo | $276,240 | $196 | 48 |
| 8105 Burnt Orchid Dr | 0.68mi | 4/2.5 (+1) | 1,745 (+12%) | 1mo | $284,990 | $163 | 37 |
| 8127 Vanilla Orchid Dr | 0.68mi | 4/2.5 (+1) | 1,745 (+12%) | 1mo | $284,990 | $163 | 36 |
Match score weights: distance 35% · size 25% · config 20% · recency 20%. Top-matched comps best support the ARV.
Projected returns pro-forma
2.5% appreciation · 3.0% rent growth · sell at horizon
- IRR
- —
- Equity multiple
- 154.54×
- Total profit
- $84,910
- Equity at exit
- $833
- IRR
- —
- Equity multiple
- 333.14×
- Total profit
- $183,671
- Equity at exit
- $1,242
Cash invested: $553 (down + closing). Projections, not guarantees.
Landlord ↔ Tenant lean methodology
- Overall (STATE)
- 87 Strongly Landlord-Friendly
- State Texas
- 87 Strongly Landlord-Friendly · R+5
- County
- — inherits STATE
- City
- — inherits STATE
ZIP-level market 77078
- Home prices YoY
- 0.8%
- Active inventory
- 129
- Price-to-rent
- 0.1×
Monthly cashflow live
- Estimated rent
- $1,701 high interval (Pro) →
- Mortgage (P&I)
- −$10
- Tax est. 1.5%
- −$2 /mo · $30/yr
- Insurance
- −$1
- HOA
- −$0
- Vacancy / Maint / Mgmt
- −$357
- Net cashflow
- $1,330
Break-even live
UW: 25.0% down · 7.5% · 30yr · 1.5% tax · 5.0% vac · 8.0% maint · 8.0% mgmt
Financing live
Cash to close
- Down payment
- $494
- Closing costs
- $59
- Reserves months
- —
- Total cash needed
- —
Loan-product check · same deal, 3 products live
Conventional
25% down · 7.5% · 30yr
- Down + closing
- —
- Monthly P&I
- —
- Monthly cashflow
- —
- DSCR
- —
- Eligible?
- —
Personal DTI + credit; lowest rate.
DSCR
20% down · 8.5% · 30yr
- Down + closing
- —
- Monthly P&I
- —
- Monthly cashflow
- —
- DSCR
- —
- Eligible?
- —
No personal income docs; deal must DSCR.
Hard money
10% down · 12.0% · 12mo
- Down + closing
- —
- Monthly P&I
- —
- Monthly cashflow
- —
- DSCR
- —
- Eligible?
- —
Short-term bridge; refi at stabilization.
Rent comps 40 comps
| Address | Beds | Baths | Sqft | Rent | $/sqft | DOM | Units | Dist |
|---|---|---|---|---|---|---|---|---|
| 8213 Bigwood St Unit A Houston, TX | 3.0 | 2.5 | 1150 | $1,595 | $1.39 | 43d | 1 | 0.05mi |
| 8126 Sterlingshire St Unit B Houston, TX | 3.0 | 2.0 | 1150 | $1,350 | $1.17 | 24d | 1 | 0.13mi |
| 8122 Sterlingshire St Unit B Houston, TX | 3.0 | 2.0 | 1160 | $1,450 | $1.25 | 15d | 1 | 0.14mi |
| 8122 Sterlingshire St Unit A Houston, TX | 3.0 | 2.0 | 1160 | $1,525 | $1.31 | 15d | 1 | 0.14mi |
| 8102 Rhobell St Unit A Houston, TX | 4.0 | 3.5 | 1567 | $1,750 | $1.12 | 43d | 1 | 0.21mi |
| 8235 Locksley Rd Unit A Houston, TX | 3.0 | 2.5 | 1608 | $1,525 | $0.95 | 7d | 1 | 0.22mi |
| 8314 Madera Rd Unit B Houston, TX | 3.0 | 2.5 | 1608 | $1,495 | $0.93 | 24d | 1 | 0.23mi |
| 8214 Parker Rd Unit B Houston, TX | 3.0 | 2.0 | 1608 | $1,560 | $0.97 | 7d | 1 | 0.30mi |
| 9702 Hillis St Houston, TX | 3.0 | 2.0 | 1612 | $1,550 | $0.96 | 43d | 1 | 0.47mi |
| 9550 N Wayside Dr Houston, TX | 1.0–3.0 | 1.0–2.0 | 896 | $1,399 | $1.56 | 1d | 5 | 0.64mi |
| 9222 Hillis St Houston, TX | 3.0 | 2.0 | 1498 | $1,850 | $1.23 | 43d | 1 | 0.76mi |
| 10474 Red Orchid Dr Houston, TX | 3.0 | 2.5 | 1553 | $1,875 | $1.21 | 24d | 1 | 0.80mi |
| 10314 Woodwick St Unit 1283919P Houston, TX | 3.0 | 2.5 | 1496 | $3,782 | $2.53 | 7d | 1 | 0.86mi |
| 8006 Lynette St Houston, TX | 3.0 | 1.0 | 1400 | $1,475 | $1.05 | 24d | 1 | 0.88mi |
| 10708 Lavender Cotton Ln Houston, TX | 3.0 | 2.0 | 1406 | $2,150 | $1.53 | 43d | 1 | 0.90mi |
| 8711 Southwark St Unit A Houston, TX | 3.0 | 2.0 | 1150 | $1,750 | $1.52 | 43d | 1 | 0.92mi |
| 8003 Alpine Bearberry Dr Houston, TX | 3.0–4.0 | 2.0–2.5 | 1696 | $2,000 | $1.18 | 7d | 1 | 0.92mi |
| 8238 Homewood Ln Houston, TX | 3.0 | 2.0 | 1696 | $1,695 | $1.00 | 24d | 1 | 0.95mi |
| 8203 Woodlyn Rd Unit C Houston, TX | 3.0 | 2.5 | 1650 | $1,650 | $1.00 | 7d | 1 | 0.99mi |
| 7726 Spinet St Houston, TX | 4.0 | 2.0 | 1456 | $2,375 | $1.63 | 7d | 1 | 1.03mi |
| 8623 Homewood Ln Unit B Houston, TX | 3.0 | 2.5 | 1150 | $1,850 | $1.61 | 18d | 1 | 1.08mi |
| 8623 Homewood Unit A Houston, TX | 3.0 | 2.5 | 1150 | $1,850 | $1.61 | 43d | 1 | 1.08mi |
| 8625 Homewood Ln Unit B Houston, TX | 3.0 | 3.0 | 1500 | $1,850 | $1.23 | 43d | 1 | 1.09mi |
| 8627 Homewood Ln Unit B Houston, TX | 3.0 | 2.5 | 1500 | $1,850 | $1.23 | 43d | 1 | 1.09mi |
| 8631 Homewood Ln Unit B Houston, TX | 3.0 | 3.0 | 1500 | $1,850 | $1.23 | 43d | 1 | 1.10mi |
| 8631 Homewood Ln Unit A Houston, TX | 3.0 | 2.5 | 1500 | $1,850 | $1.23 | 43d | 1 | 1.10mi |
| 7426 Bigwood St Houston, TX | 4.0 | 2.0 | 1997 | $1,850 | $0.93 | 14d | 1 | 1.11mi |
| 8213 Linda Vista Rd Houston, TX | 3.0 | 2.0 | 1298 | $1,625 | $1.25 | 24d | 1 | 1.16mi |
| 9526 Balsam Ln Houston, TX | 3.0 | 1.5 | 1533 | $1,475 | $0.96 | 5d | 1 | 1.17mi |
| 7914 Laura Koppe Rd Houston, TX | 3.0 | 2.0 | 1400 | $1,850 | $1.32 | 43d | 1 | 1.20mi |
| 8602 Wilkins Oaks Dr Houston, TX | 3.0 | 2.0 | 1307 | $1,775 | $1.36 | 43d | 1 | 1.24mi |
| 8216 Richland Dr Unit B Houston, TX | 3.0 | 2.0 | 1150 | $1,750 | $1.52 | 43d | 1 | 1.26mi |
| 9218 Nyssa St Unit B Houston, TX | 3.0 | 2.5 | 1608 | $1,490 | $0.93 | 1d | 1 | 1.27mi |
| 7325 Boggess Rd Houston, TX | 3.0 | 2.0 | 1568 | $1,850 | $1.18 | 17d | 1 | 1.28mi |
| 7325 Boggess Rd Houston, TX | 3.0 | 2.0 | 1568 | $1,850 | $1.18 | 43d | 1 | 1.28mi |
| 8638 Doris Oaks Cir Houston, TX | 3.0 | 3.0 | 1777 | $1,975 | $1.11 | 43d | 1 | 1.30mi |
| 8102 Crestview Dr Unit B Houston, TX | 3.0 | 2.5 | 1600 | $1,900 | $1.19 | 43d | 1 | 1.36mi |
| 8102 Crestview Dr Unit A Houston, TX | 3.0 | 2.5 | 1800 | $1,900 | $1.06 | 22d | 1 | 1.36mi |
| 8113 Denton St Houston, TX | 3.0 | 2.0 | 1150 | $1,750 | $1.52 | 43d | 1 | 1.36mi |
| 10750 Nyla Spring St Houston, TX | 3.0 | 2.0 | 1500 | $1,975 | $1.32 | 18d | 1 | 1.40mi |
Listing history 5 events
-
2026-05-25$1,975 Active
-
2025-12-02soldstatus
-
2014-02-18soldstatus
-
2010-07-26soldstatus
-
1999-07-27soldstatus
ⓘ Source: listings_history table (triggers on properties + properties_extension) + one-shot
backfill from property_details.listing_events for pre-trigger history.
Climate risk First Street
- Flood 1/10 Low FEMA zone X (unshaded) · 0% chance over 30 yrs
- Wildfire 4/10 Moderate
- Heat 9/10 Extreme 7 d/yr ≥111°F today · 24 d/yr by 30 yrs out
- Wind 9/10 Extreme 99% chance of damaging wind over 30 yrs
- Air quality 3/10 Moderate 3 unhealthy d/yr today · 3 by 30 yrs out
Nearby sold comps map
Loading sold comps map…
Walkable amenities ~0.75 mi
Loading nearby amenities…
Taxation est. · year 1
- Rental income
- $20,407
- − Mortgage interest
- −$111
- − Property taxes
- −$30
- − Insurance
- −$10
- − Repairs & maintenance
- −$1,633
- − Management
- −$1,633
- − Depreciation
- −$57
- Taxable income
- $16,935
- Est. tax owed @ 24.0%
- −$4,064
- After-tax cash flow
- $11,894/yr
For passive investors: Depreciation is non-cash, so a rental often shows a tax loss while cash-flowing — sheltering income. Rental losses are passive: they offset passive income freely, and up to $25,000/yr can offset ordinary (W-2) income if you actively participate and your MAGI is under $100k (phasing out to $0 by $150k); unused losses carry forward. On sale, claimed depreciation is recaptured at up to 25%, and gains may owe capital-gains tax (a 1031 exchange can defer both). Figures are a year-1 estimate at your 24.0% rate — not tax advice; consult a CPA.
Schools (NCES district)
- District
- Houston ISD
- NCES district ID
- 4823640
- Math proficiency
- 27% ▼ -18.00%
- Reading proficiency
- 35% ▼ -6.00%
- Median HH income
- $46,054
- Composite
- 26.63/100
- National rank
- #7173
- State rank
- #593 of 826 in TX
Livability — Houston
- Score
- 74/100
- State rank
- #184
- US rank
- #4771
Category grades
Schools grade is shown separately in the Schools card above.
Census & demographics
- Census place
- Houston, TX
- County
- Harris County · 4,702,590 people
- City population
- 3,226,434
- Metro
- Houston-The Woodlands-Sugar Land, TX
- Population (ZIP)
- 14,247
- Household income
- $39,093
- Rent vs Own
- Severe rent burden
- 780.0
Population outlook (Harris County) Hauer SSP2
- Today (2025)
- 5,571,493 people
- By 2030
- 6,089,821 · +9.3%
- By 2040
- 7,142,806 · +28.2%
- By 2050
- 8,185,864 · +46.9%
- By 2075
- 10,574,329 · +89.8%
- By 2100
- 12,109,958 · +117.4%
Race, ethnicity, and origin ACS 2023
- Race & ethnicity
- Black 49% Hispanic / Latino 46% Two or more races 15% White 5%
- Hispanic origin (detail)
- Mexican 36% Cuban 1%
- Common ancestry
- Italian 1% Hispanic 1%
- Foreign-born
- 24% · Canada
- Languages at home
- 59% English-only · Spanish 41%
Political lean MEDSL · Harris
- 2024 margin
- Lean D (+5.5) · D 52.0% · R 46.4% · Other 1.6%
- 2008→2024 swing
- +3.9pp toward D · 2008: 1.6pp · 2024: 5.5pp
- All cycles
- 2024: D+5.5 2020: D+13.3 2016: D+12.4 2012: D+0.1 2008: D+1.6
Not yet ingested
- Civics
- —
Market trends
- HPI YoY
- ▲ 2.50%
- Current HPI
- 307.0842
- Rent YoY
- —
- Metro
- Houston-The Woodlands-Sugar Land, TX
- State GDP YoY
- ▲ 3.95%
- F500 in state
- 110
Industry mix (Fortune 500 HQ in TX)
| Industry | F500 HQs | Revenue |
|---|---|---|
| Energy | 16 | $1,198B |
|
||
| Technology | 5 | $198B |
|
||
| Engineering / Construction | 4 | $72B |
|
||
| Energy Services | 3 | $60B |
|
||
| Utilities | 3 | $41B |
|
||
| Healthcare | 2 | $330B |
|
||
Price history
5 events — show timeline
- 2026-05-25 Listed $1,975 HARMLS
- 2025-12-02 Sold (Public Records) — Public Records
- 2014-02-18 Sold (Public Records) — Public Records
- 2010-07-26 Sold (Public Records) — Public Records
- 1999-07-27 Sold (Public Records) — Public Records
Property tax history
+8.8%/yrLatest (2025): $3,361 · -11.3% YoY. Source: county tax records.
Cash-flow waterfall
monthlySold comps — $/sqft
last 12 mo · ≤1 miLoading sold comps…