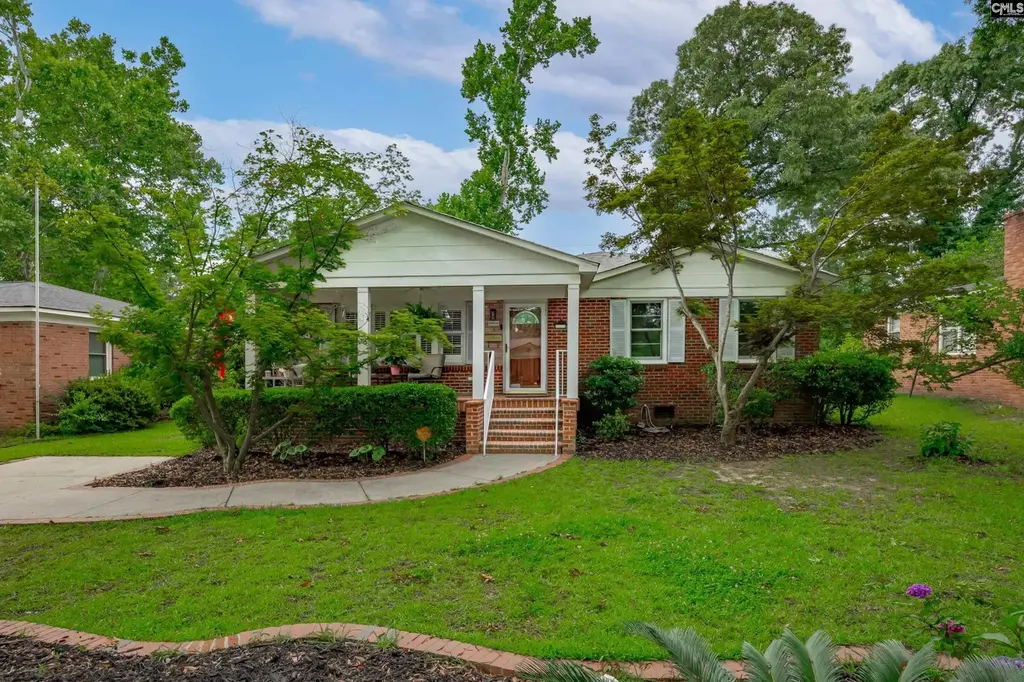
1035 Elm Ave · Columbia, SC
Flood risk 1/10 · Minimal
- FEMA flood zone
- X (unshaded)
- Chance of flooding over 30 yrs
- 0.0%
- Est. flood insurance / yr
- $507 – $1,088
Fire risk 3/10 · Minor
- Est. fire insurance / yr
- $783 – $1,453
Heat risk 7/10 · Major
- Hot days now (above 109°F)
- 7 days/yr
- Hot days in 30 yrs
- 16 days/yr
Wind risk 6/10 · Moderate
- Chance of severe wind over 30 yrs
- 74.0%
Air-quality risk 3/10 · Minor
- Unhealthy air days now
- 2 days/yr
- Unhealthy air days in 30 yrs
- 2 days/yr
Risk factors via First Street. Map © Google.
Why this score? — see what drove the D+ grade
The composite is a weighted blend of 9 inputs, each scored 0–100. Each bar is that input's sub-score; the figure is the points it added to the 100-point composite (weight × sub-score).
- ARV discount +15.0/15.0
- Cash flow +11.4/30.0
- Rent growth +4.2/5.0
- Livability +3.9/5.0
- DSCR +3.4/10.0
- Schools +2.6/10.0
- Condition / age +2.5/5.0
- 1% rule +2.1/10.0
- Appreciation +0.0/10.0
$320,000
🖨 Deal sheet (PDF) 📄 Offer letter ✓ Due diligence
Listing remarks
Welcome to 1035 Elm Avenue - a wonderful residence tucked in the well-established and sought-after Rosewood neighborhood. This charming 3-bedroom, 2-bath brick bungalow, with covered front porch, features original hardwood floors, plantation shutters, fireplace, tile floors in the kitchen and bathrooms. This home exudes timeless character and warmth. from the moment you arrive, you will appreciate the inviting curb appeal and charm that makes this home feel right for you. This home has two living areas, in the front, the living and dining room combo with hardwood floors, plantation shutters and a cozy fireplace is ideal for hosting or entertaining guest or family dining. The Sunroom, in th
Key facts
- Covered front porch
- Laundry area
- Two living areas
Tags
Property features AI
Finance
- Other: Cable TV available; Access to recreation facility
Exterior
- Parking: Detached or attached garage at main level with 2 parking spaces
- Security: Leased security system
- Utilities: Public water; Public sewer; Storm doors; Thermopane windows
- Home design: Single-story home; Brick exterior above foundation on all sides; Home faces northeast
- Construction: Crawlspace foundation
- Exterior features: Covered front porch; Deck; Shed; Rear chain-link fencing
Interior
- Kitchen: Formica countertops; Backsplash (other); Painted cabinets; Vinyl floor; Dishwasher; Disposal; Microwave (countertop); Free-standing smooth-surface self-cleaning range; Refrigerator
- Bedrooms: Master bedroom on main level with cathedral ceilings, double vanity, private bath with separate shower, walk-in closet, ceiling fan, hardwood and tile floors; Second bedroom on main level with shared bath (tub/shower), ceiling fan, private closet, hardwood and tile floors; Third bedroom on main level with shared bath (tub/shower), private closet, hardwood and vinyl floors
- Flooring: Hardwood flooring in living areas and bedrooms; Tile flooring in portions of bedrooms and other areas; Vinyl flooring in one bedroom and kitchen areas
- Bathrooms: Two full bathrooms
- Heating & cooling: Central heating; Central cooling; Gas PAC units (multiple units)
- Interior features: Attic with pull-down access and additional attic storage; Ceiling fans; Security system (leased); Recessed lighting; Molding
- Laundry & utility: Main-level laundry in closet with electric hookup; Washer and dryer included; Tankless water heater
Neighborhood map
What this means for you Summary
Snapshot
- This is a 3-bed/1.0-bath single-family listed at $320k.
Deal economics
- At list price, monthly cash flow is $-109 ($-1k/yr) — negative.
- To cash-flow at today's rent, offer at most $301k (6.0% below list).
- To meet the 1% rule (rent ≥ 1% of price), the offer needs to be $227k (29.0% below list).
- Recommended offer: $227k (29.0% below list) — sets the bar for 1% rule.
Location & tenants
- Location reads 78/100 on livability (#18 in SC, #2,436 nationally) — a middle-class / working-renter tenant base. Strengths: amenities A+, commute A+, cost of living A+; Watch: employment D, crime F.
- Richland 01 (urban): math 26% / reading 36% proficiency, ranked #54 of 80 in SC (top 68%) — families likely to look elsewhere, expect single-tenant / working-renter base with shorter leases; 64% free/reduced lunch — lower-income household profile, screen leases tightly.
- Zoned schools: Rosewood Elementary (math 72% / reading 72%, grade A-, #26 of 597 statewide, top 5%, 329 students, 100% FRL); Hand Middle (math 29% / reading 37%, grade F, #116 of 229 statewide, top 51%, 652 students, 100% FRL); Dreher High (math 47% / reading 92%, grade B, #60 of 196 statewide, top 32%, 1,150 students, 100% FRL) — zoned schools average 100% FRL vs 64% district-wide (36 pts higher); higher-poverty schools than district average — tighter screening recommended.
- Zoned-school proficiency averages 58% at this address vs 31% district-wide (+27 pts) — the actual schools serving this property are materially stronger than the Richland 01 average implies; a family-tenant draw the district grade alone would hide.
- Market conditions: Rents rising fast (+7.0%/yr); 150 active listings in the ZIP; 23 comparable units currently listed for rent nearby; rentals at typical pace (median 25d on market — plan ~3-4 weeks tenant-placement turnaround); 3,472 units permitted in Richland County in 2024 (1,096 in 5+ unit buildings).
- This rent runs 42% of the median local income ($64k/yr) — at the standard rent-burdened threshold; future hikes will face affordability resistance.
Forward outlook
- Local home prices are declining (-3.0%/yr); year-one equity from $2k of loan paydown is wiped out by about $10k of value loss. Plan a longer hold.
- Richland County population projected at +30% by 2050 — long-run rental-demand tailwind backs the buy-and-hold thesis.
Negotiation context
- Only 9 days on market — expect competitive offers; lowballing is unlikely to land.
- Current owner paid $46k; list at $320k implies a 596% gain — meaningful room to come down on a strong offer.
Risks & watch-outs
- Watch-outs: built in 1954 — expect roof / HVAC / electrical / plumbing capex.
- Climate carrying-cost: major wind risk, 74% chance of damaging wind over 30y; extreme-heat days projected 7→16/yr by 2055 (HVAC capex compounding) — expect insurance premiums to compound above CPI over the hold.
Questions for the listing agent
- What do current leases actually rent for vs. the listed asking? Can we see a recent rent roll and the last 12 months of T-12 income?
- Built in 1954 — when were the roof, HVAC, electrical panel, plumbing, and water heater last replaced?
- Is there a deadline driving the sale (1031 exchange, divorce, estate, relocation)? That informs how much negotiation room exists.
- Schools are D-rated, which usually means shorter tenancies and higher turnover. Who's the typical renter profile here, and what's been the actual vacancy rate?
- Crime grade is F in this area — have there been break-ins, vandalism, or insurance claims at this property in the last 3 years? What carrier currently insures it and at what premium?
- The area grade is low — what's the realistic commute time and amenity access for the typical tenant pool here? Any planned neighborhood developments (good or bad) we should know about?
- What's the average days-on-market for RENTAL listings here right now (not sales)? A rising rental-DOM trend means longer vacancies and softer asking-rent achievability than the comps imply.
- What's the recent tenant-quality profile in this submarket — average credit score on applications, eviction rate, late-payment / NSF rate, and stable-employment percentage? A property-management company in the area should have these aggregated.
- How much new for-sale + rental construction is in the pipeline within 1–3 miles? Heavy new supply typically softens prices + rents 12–24 months out; constrained supply supports both.
Investment metrics
- 1% rule
- 0.71% ✗
- Cap rate
- 5.88%
- Cash-on-cash
- -1.46%
- DSCR
- 0.94
- GRM
- 11.7
CMA / ARV
- ARV (on-the-fly)
- $480,792
- Comps found
- 1
Show comp detail 1 sale within ~0.75 mi
| Address | Dist | Beds/Ba | Sqft | Sold | Price | $/sf | Match |
|---|---|---|---|---|---|---|---|
| 617 Graymont Ave | 0.68mi | 3/2.0 | 1,718 (-1%) | 16mo | $475,000 | $276 | 49 |
Match score weights: distance 35% · size 25% · config 20% · recency 20%. Top-matched comps best support the ARV.
Projected returns pro-forma
-3.0% appreciation · 6.95% rent growth · sell at horizon
- IRR
- -15.0%
- Equity multiple
- 0.45×
- Total profit
- $-49,557
- Equity at exit
- $47,713
- IRR
- -1.6%
- Equity multiple
- 0.88×
- Total profit
- $-10,929
- Equity at exit
- $27,668
Cash invested: $89,600 (down + closing). Projections, not guarantees.
Landlord ↔ Tenant lean methodology
- Overall (STATE)
- 90 Strongly Landlord-Friendly
- State South Carolina
- 90 Strongly Landlord-Friendly · R+6
- County
- — inherits STATE
- City
- — inherits STATE
ZIP-level market 29205
- Rents YoY
- 7.0%
- Active inventory
- 150
- Price-to-rent
- 11.7×
Monthly cashflow live
- Estimated rent
- $2,271 high interval (Pro) →
- Mortgage (P&I)
- −$1,678
- Tax from tax record
- −$92 /mo · $1,102/yr
- Insurance
- −$133
- HOA
- −$0
- Vacancy / Maint / Mgmt
- −$477
- Net cashflow
- $-109
Break-even live
Sensitivity live
| Price | -10% $72 | -5% $-18 | +0% $-109 | +5% $-199 | +10% $-290 |
|---|---|---|---|---|---|
| Rent | -10% $-288 | -5% $-199 | +0% $-109 | +5% $-19 | +10% $71 |
| Rate | -1.0pp $52 | -0.5pp $-27 | base $-109 | +0.5pp $-192 | +1.0pp $-276 |
UW: 25.0% down · 7.5% · 30yr · 1.5% tax · 5.0% vac · 8.0% maint · 8.0% mgmt
Financing live
Cash to close
- Down payment
- $80,000
- Closing costs
- $9,600
- Reserves months
- —
- Total cash needed
- —
Loan-product check · same deal, 3 products live
Conventional
25% down · 7.5% · 30yr
- Down + closing
- —
- Monthly P&I
- —
- Monthly cashflow
- —
- DSCR
- —
- Eligible?
- —
Personal DTI + credit; lowest rate.
DSCR
20% down · 8.5% · 30yr
- Down + closing
- —
- Monthly P&I
- —
- Monthly cashflow
- —
- DSCR
- —
- Eligible?
- —
No personal income docs; deal must DSCR.
Hard money
10% down · 12.0% · 12mo
- Down + closing
- —
- Monthly P&I
- —
- Monthly cashflow
- —
- DSCR
- —
- Eligible?
- —
Short-term bridge; refi at stabilization.
Rent comps 23 comps
| Address | Beds | Baths | Sqft | Rent | $/sqft | DOM | Units | Dist |
|---|---|---|---|---|---|---|---|---|
| 3425 Manor Ave Columbia, SC | 3.0 | 2.0 | 1200 | $2,100 | $1.75 | 13d | 1 | 0.22mi |
| 3800 Overbrook Dr Columbia, SC | 4.0 | 2.0 | 1800 | $2,400 | $1.33 | 25d | 1 | 0.50mi |
| 828 Suber St Unit E Columbia, SC | 2.0 | 1.0 | 1100 | $995 | $0.90 | 13d | 1 | 0.53mi |
| 914 Chevis St Columbia, SC | 3.0 | 2.0 | 1280 | $2,100 | $1.64 | 25d | 1 | 0.61mi |
| 1 Graymont Cir Columbia, SC | 3.0 | 2.5 | 1400 | $2,175 | $1.55 | 25d | 1 | 0.62mi |
| 19 Graymont Cir Unit NA Columbia, SC | 3.0 | 2.0 | 1250 | $2,400 | $1.92 | 25d | 1 | 0.63mi |
| 2218 Holt Dr Columbia, SC | 4.0 | 3.5 | 1400 | $2,400 | $1.71 | 25d | 1 | 0.67mi |
| 3125 Heyward St Unit A Columbia, SC | 3.0 | 1.0 | 1200 | $2,400 | $2.00 | 25d | 1 | 0.72mi |
| 3125 Heyward St Unit B Columbia, SC | 2.0 | 1.0 | 1100 | $1,600 | $1.45 | 25d | 1 | 0.72mi |
| 114 Easy St Columbia, SC | 2.0 | 2.0 | 1100 | $1,500 | $1.36 | 13d | 1 | 0.72mi |
| 3925 Rosewood Dr Columbia, SC | 4.0 | 2.0 | 1683 | $4,800 | $2.85 | 25d | 1 | 0.80mi |
| 318 S Woodrow St Columbia, SC | 2.0 | 1.0 | 1103 | $1,700 | $1.54 | 25d | 1 | 0.80mi |
| 316 S Woodrow St Columbia, SC | 4.0 | 2.0 | 2206 | $4,000 | $1.81 | 25d | 1 | 0.81mi |
| 524 S Beltline Blvd Columbia, SC | 2.0 | 1.0 | 1050 | $1,300 | $1.24 | 25d | 1 | 0.84mi |
| 405 S Edisto Ave Columbia, SC | 3.0 | 1.0 | 1450 | $2,200 | $1.52 | 25d | 1 | 0.97mi |
| 317 Beltline Blvd Unit 1 Columbia, SC | 3.0 | 1.0 | 1150 | $1,200 | $1.04 | 25d | 1 | 1.03mi |
| 500 S Bull St Columbia, SC | 4.0 | 2.5 | 1677 | $3,400 | $2.03 | 25d | 1 | 1.14mi |
| 614 Capitol Pl Columbia, SC | 2.0 | 1.0 | 1200 | $1,895 | $1.58 | 16d | 1 | 1.16mi |
| 127 Rosewood Hills Dr Columbia, SC | 3.0 | 2.5 | 1475 | $2,900 | $1.97 | 16d | 1 | 1.17mi |
| 102 Burdock Cir Columbia, SC | 4.0 | 2.0 | 1451 | $1,550 | $1.07 | 23d | 1 | 1.27mi |
| 501 Pelham Dr Columbia, SC | 1.0–2.0 | 1.0–2.0 | 805 | $1,625 | $2.02 | 4d | 24 | 1.32mi |
| 147 S Pickens St Unit 147 Columbia, SC | 3.0 | 1.0 | 1302 | $1,950 | $1.50 | 25d | 1 | 1.40mi |
| 123 S Pickens St Columbia, SC | 3.0 | 2.0 | 2000 | $2,900 | $1.45 | 25d | 1 | 1.48mi |
Listing history 8 events
-
2026-06-22status $320,000 Pending 9 DOM
-
2026-06-21days on market $320,000 Active 9 DOM
-
2026-06-18days on market $320,000 Active 6 DOM
-
2026-06-17days on market $320,000 Active 5 DOM
-
2026-06-16days on market $320,000 Active 4 DOM
-
2026-06-15days on market $320,000 Active 3 DOM
-
2026-06-14remarks 699-char remark
-
2026-06-14$320,000 Active 1 DOM
ⓘ Source: listings_history table (triggers on properties + properties_extension) + one-shot
backfill from property_details.listing_events for pre-trigger history.
Tax reassessment forecast SC · Resets to sale price
- Current annual tax
- $1,102 · $92/mo
- Projected year-2 tax
- $1,824 · $152/mo
- Expected delta
- +$722/yr (+$60/mo · 65.5%)
ⓘ Screening estimate from a state-policy table — verify with the county assessor before closing.
Climate risk First Street
- Flood 1/10 Low FEMA zone X (unshaded) · 0% chance over 30 yrs
- Wildfire 3/10 Moderate
- Heat 7/10 Severe 7 d/yr ≥109°F today · 16 d/yr by 30 yrs out
- Wind 6/10 Major 74% chance of damaging wind over 30 yrs
- Air quality 3/10 Moderate 2 unhealthy d/yr today · 2 by 30 yrs out
Nearby sold comps map
Loading sold comps map…
Walkable amenities ~0.75 mi
Loading nearby amenities…
Taxation est. · year 1
- Rental income
- $27,257
- − Mortgage interest
- −$17,925
- − Property taxes
- −$1,102
- − Insurance
- −$1,600
- − Repairs & maintenance
- −$2,181
- − Management
- −$2,181
- − Depreciation
- −$9,309
- Taxable loss
- −$7,040
- Est. tax savings @ 24.0%
- +$1,690
- After-tax cash flow
- $383/yr
For passive investors: Depreciation is non-cash, so a rental often shows a tax loss while cash-flowing — sheltering income. Rental losses are passive: they offset passive income freely, and up to $25,000/yr can offset ordinary (W-2) income if you actively participate and your MAGI is under $100k (phasing out to $0 by $150k); unused losses carry forward. On sale, claimed depreciation is recaptured at up to 25%, and gains may owe capital-gains tax (a 1031 exchange can defer both). Figures are a year-1 estimate at your 24.0% rate — not tax advice; consult a CPA.
Schools (NCES district)
- District
- Richland 01
- NCES district ID
- 4503360
- Math proficiency
- 26% ▼ -7.00%
- Reading proficiency
- 36% ▼ -5.00%
- Median HH income
- $38,931
- Composite
- 25.94/100
- National rank
- #7335
- State rank
- #54 of 80 in SC
Livability — Columbia
- Score
- 78/100
- State rank
- #18
- US rank
- #2436
Category grades
Schools grade is shown separately in the Schools card above.
Census & demographics
- Census place
- Columbia, SC
- County
- Richland County · 389,530 people
- City population
- 335,994
- Metro
- Columbia, SC
- Population (ZIP)
- 22,223
- Household income
- $64,231
- Rent vs Own
- Severe rent burden
- 1372.0
Population outlook (Richland County) Hauer SSP2
- Today (2025)
- 459,667 people
- By 2030
- 487,524 · +6.1%
- By 2040
- 542,035 · +17.9%
- By 2050
- 595,371 · +29.5%
- By 2075
- 732,998 · +59.5%
- By 2100
- 820,415 · +78.5%
Race, ethnicity, and origin ACS 2023
- Neighborhood character
- Predominantly White (73%)
- Race & ethnicity
- White 73% Black 16% Two or more races 6% Hispanic / Latino 5% Asian 3%
- Common ancestry
- Serbian 6% Slovak 4% Lithuanian 3%
- Foreign-born
- 4% · Canada, China
- Languages at home
- 93% English-only · Spanish 3% German/W. Germanic 1% Chinese 1%
Political lean MEDSL · Richland
- 2024 margin
- Solid D (+34.6) · D 66.4% · R 31.8% · Other 1.8%
- 2008→2024 swing
- +5.7pp toward D · 2008: 28.9pp · 2024: 34.6pp
- All cycles
- 2024: D+34.6 2020: D+38.3 2016: D+32.9 2012: D+33.3 2008: D+28.9
Not yet ingested
- Civics
- —
Market trends
- HPI YoY
- ▼ -457.47%
- Current HPI
- 230.5538
- Rent YoY
- ▲ 6.95%
- Metro
- Columbia, SC
- State GDP YoY
- ▲ 4.51%
- F500 in state
- 2
Industry mix (Fortune 500 HQ in SC)
| Industry | F500 HQs | Revenue |
|---|---|---|
| Packaging | 1 | $7B |
|
||
Price history
+595.7% since first listed2 events — show timeline
- 2026-06-12 Listed $320,000 Consolidated MLS
- 1983-04-01 Sold (Public Records) $46,000 Public Records
Property tax history
+3.1%/yrLatest (2025): $1,102 · +3.7% YoY. Source: county tax records.
Cash-flow waterfall
monthlySold comps — $/sqft
last 12 mo · ≤1 miLoading sold comps…