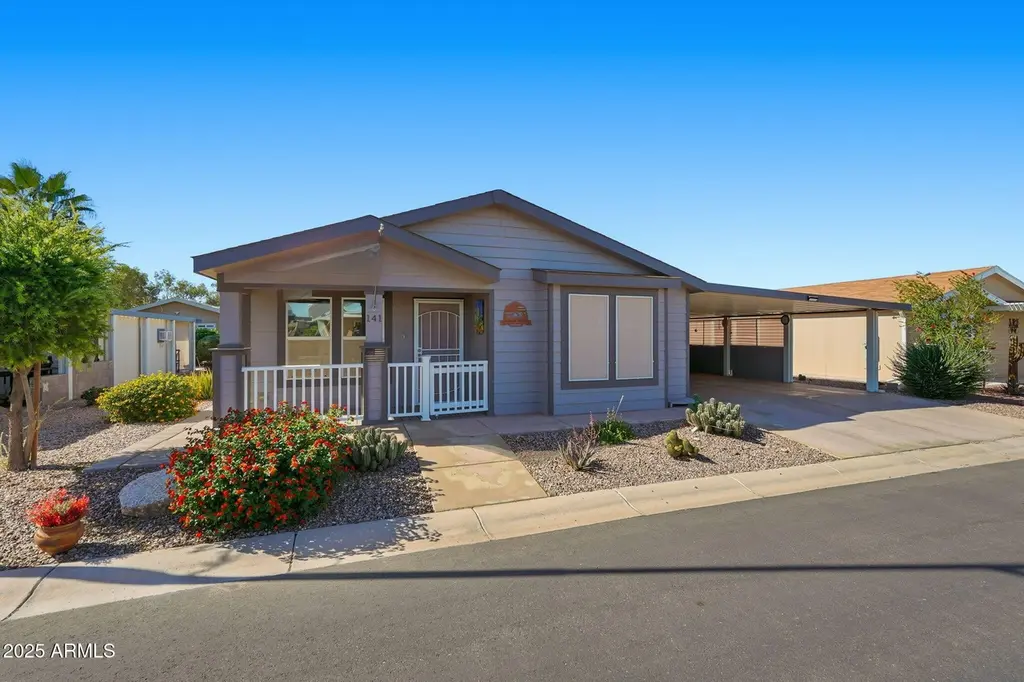
2263 N Trekell Rd #141 · Casa Grande, AZ
Flood risk 1/10 · Minimal
- FEMA flood zone
- X (shaded)
- Chance of flooding over 30 yrs
- 0.0%
- Est. flood insurance / yr
- $507 – $1,088
Fire risk 6/10 · Moderate
- Est. fire insurance / yr
- $610 – $1,132
Heat risk 9/10 · Severe
- Hot days now (above 113°F)
- 6 days/yr
- Hot days in 30 yrs
- 16 days/yr
Wind risk 1/10 · Minimal
- Chance of severe wind over 30 yrs
- —
Air-quality risk 1/10 · Minimal
- Unhealthy air days now
- 0 days/yr
- Unhealthy air days in 30 yrs
- 0 days/yr
Risk factors via First Street. Map © Google.
Why this score? — see what drove the B- grade
The composite is a weighted blend of 9 inputs, each scored 0–100. Each bar is that input's sub-score; the figure is the points it added to the 100-point composite (weight × sub-score).
- Cash flow +28.0/30.0
- DSCR +9.9/10.0
- 1% rule +7.7/10.0
- ARV discount +7.5/15.0
- Condition / age +4.0/5.0
- Rent growth +3.7/5.0
- Livability +2.9/5.0
- Schools +1.5/10.0
- Appreciation +0.0/10.0
$149,900
🖨 Deal sheet (PDF) 📄 Offer letter ✓ Due diligence
Listing remarks
Beautiful Home in Sought-After Rancho Val Vista Community. Welcome home to this beautifully maintained property located in the highly desirable 55+ community of Rancho Val Vista. This partially furnished home offers the perfect blend of comfort, style, and convenience, with owned solar that will be paid off at closing. Step inside to discover new flooring throughout, new appliances, and an open-concept layout ideal for everyday living and entertaining. The exterior was freshly painted just a year ago, and the home is equipped with a soft water system, reverse osmosis water system, and a newer drip irrigation system for easy maintenance. The spacious floor plan includes 2 bedrooms plus a den
Key facts
- Craft room
- Soft water system
- New flooring
Tags
Property features AI
Finance
- Other: Lot size reported by assessor
- HOA & community: Land lease (monthly); Land lease payment: $538 per month; Association maintenance of grounds included; Gated community; Community pool; Community spa; Fitness center; Pickleball courts
Exterior
- Parking: 2 open parking spaces; 2 covered spaces; 2 carport spaces
- Utilities: Private water company service; Public sewer
- Home design: Manufactured/mobile home; Leasehold ownership
- Construction: Wood frame construction; Painted exterior; Composition roof
- Exterior features: Partial fencing; Storage; East/West exposure; Desert front and back landscaping; Automatic front and back irrigation timers; Private maintained road
Interior
- Kitchen: Built-in microwave; Refrigerator; Dishwasher; Garbage disposal; Water purifier; Pantry
- Bedrooms: Up to 4 bedrooms possible
- Flooring: Vinyl flooring
- Bathrooms: 2 full bathrooms
- Heating & cooling: Electric heating; Central air conditioning
- Interior features: Eat-in kitchen; Furnished (see remarks); Pantry; Master bedroom with 3/4 bath; Vinyl-framed windows; Solar panels; Accessible hallways
- Laundry & utility: Owner-supplied building area information
Neighborhood map
What this means for you Summary
Snapshot
- This is a 3-bed/2.0-bath manufactured listed at $150k. Condition is rated good.
Deal economics
- At list price, monthly cash flow is $465 ($6k/yr) — positive.
- The deal already cash-flows at list — no discount required.
- Meets the 1% rule at list price ($2k rent vs $150k).
- Cap rate 10.0% vs local median 4.1% in Casa Grande — top-decile yield for the area; either an underpriced asset or a hidden risk that comps aren't pricing in. Stress-test before assuming the spread holds.
Location & tenants
- Location reads 58/100 on livability (#220 in AZ) — a working-class tenant base; expect higher turnover. Strengths: cost of living A+, housing A+; Watch: crime D+, employment D+, schools F.
- Casa Grande Union High School District (4453) (suburban): math 14% / reading 21% proficiency, ranked #193 of 249 in AZ (top 78%) — low school quality limits family demand, transient renter base, plan for 1-2y turnover.
- Market conditions: Rents rising fast (+4.6%/yr); 628 active listings in the ZIP; 29 comparable units currently listed for rent nearby; rentals at typical pace (median 21d on market — plan ~3-4 weeks tenant-placement turnaround); 9,504 units permitted in Pinal County in 2024 (776 in 5+ unit buildings).
- This rent runs 33% of the median local income ($68k/yr) — at the standard rent-burdened threshold; future hikes will face affordability resistance.
Forward outlook
- Local home prices are declining (-3.0%/yr); year-one equity from $1k of loan paydown is wiped out by about $4k of value loss. Plan a longer hold.
- At projected returns (-3.0% appreciation + 4.6% rent growth), your $42k cash investment doubles in ~8 years — after that, you're playing with house money.
Negotiation context
- Only 12 days on market — expect competitive offers; lowballing is unlikely to land.
- 2 sale attempts; this cycle's ask has dropped $34k (18%) from the opening price — seller is motivated, your offer sets the floor, not the list.
Risks & watch-outs
- Climate carrying-cost: major wildfire risk; extreme-heat days projected 6→16/yr by 2055 (HVAC capex compounding) — expect insurance premiums to compound above CPI over the hold.
Questions for the listing agent
- Is there a deadline driving the sale (1031 exchange, divorce, estate, relocation)? That informs how much negotiation room exists.
- Schools are F-rated, which usually means shorter tenancies and higher turnover. Who's the typical renter profile here, and what's been the actual vacancy rate?
- Crime grade is D in this area — have there been break-ins, vandalism, or insurance claims at this property in the last 3 years? What carrier currently insures it and at what premium?
- What's the average days-on-market for RENTAL listings here right now (not sales)? A rising rental-DOM trend means longer vacancies and softer asking-rent achievability than the comps imply.
- What's the recent tenant-quality profile in this submarket — average credit score on applications, eviction rate, late-payment / NSF rate, and stable-employment percentage? A property-management company in the area should have these aggregated.
- How much new for-sale + rental construction is in the pipeline within 1–3 miles? Heavy new supply typically softens prices + rents 12–24 months out; constrained supply supports both.
Investment metrics
- 1% rule
- 1.27% ✓
- Cap rate
- 10.01%
- Cash-on-cash
- 13.28%
- DSCR
- 1.59
- GRM
- 6.6
CMA / ARV
- ARV (on-the-fly)
- $88,972
- Comps found
- 12
Show comp detail 12 sales within ~0.75 mi
| Address | Dist | Beds/Ba | Sqft | Sold | Price | $/sf | Match |
|---|---|---|---|---|---|---|---|
| 2263 N Trekell Rd #67 | 0.20mi | 2/2.0 (-1) | 1,472 (-2%) | 1mo | $187,500 | $127 | 81 |
| 2263 N Trekell Rd Rd #77 | 0.20mi | 2/2.0 (-1) | 1,400 (-7%) | 1mo | $175,000 | $125 | 73 |
| 2263 N Trekell Rd #156 | 0.20mi | 2/2.0 (-1) | 1,400 (-7%) | 2mo | $165,000 | $118 | 72 |
| 2263 N Trekell Rd #158 | 0.20mi | 2/2.0 (-1) | 1,624 (+8%) | 3mo | $195,000 | $120 | 70 |
| 2263 N Trekell Rd #90 | 0.20mi | 2/2.0 (-1) | 1,658 (+10%) | 0mo | $145,000 | $87 | 69 |
| 2100 N Trekell Rd #254 | 0.52mi | 3/2.0 | 1,560 (+3%) | 2mo | $92,500 | $59 | 68 |
| 2100 N Trekell Rd #143 | 0.52mi | 3/1.5 | 1,456 (-3%) | 2mo | $65,000 | $45 | 67 |
| 2100 N Trekell Rd #239 | 0.52mi | 3/2.0 | 1,568 (+4%) | 4mo | $75,900 | $48 | 66 |
| 2100 N Trekell Rd | 0.52mi | 2/2.0 (-1) | 1,560 (+3%) | 2mo | $32,900 | $21 | 63 |
| 2100 N Trekell Rd #226 | 0.52mi | 2/1.0 (-1) | 1,456 (-3%) | 3mo | $37,000 | $25 | 59 |
| 2100 N Trekell Rd #336 | 0.52mi | 2/2.0 (-1) | 1,652 (+10%) | 3mo | $69,000 | $42 | 52 |
| 2100 N Trekell Rd #88 | 0.52mi | 2/2.0 (-1) | 1,300 (-14%) | 3mo | $22,000 | $17 | 45 |
Match score weights: distance 35% · size 25% · config 20% · recency 20%. Top-matched comps best support the ARV.
Projected returns pro-forma
-3.0% appreciation · 4.6% rent growth · sell at horizon
- IRR
- 5.1%
- Equity multiple
- 1.20×
- Total profit
- $8,440
- Equity at exit
- $22,351
- IRR
- 16.0%
- Equity multiple
- 2.40×
- Total profit
- $58,744
- Equity at exit
- $12,961
Cash invested: $41,972 (down + closing). Projections, not guarantees.
Landlord ↔ Tenant lean methodology
- Overall (STATE)
- 87 Strongly Landlord-Friendly
- State Arizona
- 87 Strongly Landlord-Friendly · R+3
- County
- — inherits STATE
- City
- — inherits STATE
ZIP-level market 85122
- Home prices YoY
- -22.4%
- Rents YoY
- 4.6%
- Active inventory
- 628
- Price-to-rent
- 6.6×
Monthly cashflow live
- Estimated rent
- $1,899 high interval (Pro) →
- Mortgage (P&I)
- −$786
- Tax est. 1.5%
- −$187 /mo · $2,248/yr
- Insurance
- −$62
- HOA
- −$0
- Vacancy / Maint / Mgmt
- −$399
- Net cashflow
- $465
Break-even live
Sensitivity live
| Price | -10% $568 | -5% $516 | +0% $465 | +5% $413 | +10% $361 |
|---|---|---|---|---|---|
| Rent | -10% $315 | -5% $390 | +0% $465 | +5% $540 | +10% $615 |
| Rate | -1.0pp $540 | -0.5pp $503 | base $465 | +0.5pp $426 | +1.0pp $386 |
UW: 25.0% down · 7.5% · 30yr · 1.5% tax · 5.0% vac · 8.0% maint · 8.0% mgmt
Financing live
Cash to close
- Down payment
- $37,475
- Closing costs
- $4,497
- Reserves months
- —
- Total cash needed
- —
Loan-product check · same deal, 3 products live
Conventional
25% down · 7.5% · 30yr
- Down + closing
- —
- Monthly P&I
- —
- Monthly cashflow
- —
- DSCR
- —
- Eligible?
- —
Personal DTI + credit; lowest rate.
DSCR
20% down · 8.5% · 30yr
- Down + closing
- —
- Monthly P&I
- —
- Monthly cashflow
- —
- DSCR
- —
- Eligible?
- —
No personal income docs; deal must DSCR.
Hard money
10% down · 12.0% · 12mo
- Down + closing
- —
- Monthly P&I
- —
- Monthly cashflow
- —
- DSCR
- —
- Eligible?
- —
Short-term bridge; refi at stabilization.
Rent comps 29 comps
| Address | Beds | Baths | Sqft | Rent | $/sqft | DOM | Units | Dist |
|---|---|---|---|---|---|---|---|---|
| 700 E Rodeo Rd Casa Grande, AZ | 2.0 | 1.0–2.0 | 828 | $1,436 | $1.73 | 3d | 25 | 0.41mi |
| 1139 E Yucca St Casa Grande, AZ | 3.0 | 3.0 | 1300 | $1,800 | $1.38 | 25d | 1 | 0.44mi |
| 976 E White Wing Dr Casa Grande, AZ | 4.0 | 2.0 | 1808 | $2,150 | $1.19 | 19d | 1 | 0.49mi |
| 1185 E Avila Ave Casa Grande, AZ | 4.0 | 2.0 | 1378 | $1,550 | $1.12 | 25d | 1 | 0.53mi |
| 948 E Wiley Way Casa Grande, AZ | 4.0 | 2.0 | 1540 | $2,000 | $1.30 | 21d | 1 | 0.58mi |
| 1201 E Barcelona Ave Casa Grande, AZ | 3.0 | 2.0 | 1803 | $1,900 | $1.05 | 25d | 1 | 0.61mi |
| 1979 N Vista Ln Casa Grande, AZ | 4.0 | 2.0 | 1636 | $2,200 | $1.34 | 25d | 1 | 0.82mi |
| 1936 N Trekell Rd Casa Grande, AZ | 1.0–4.0 | 1.0–2.0 | 1033 | $1,723 | $1.67 | 2d | 29 | 0.85mi |
| 1926 N Avenida de Palmas Casa Grande, AZ | 2.0 | 2.0 | 1106 | $1,199 | $1.08 | 22d | 3 | 0.90mi |
| 1265 E Kingman St Casa Grande, AZ | 4.0 | 2.0 | 1874 | $2,099 | $1.12 | 6d | 1 | 0.96mi |
| 2094 N Sweetwater Dr Casa Grande, AZ | 3.0 | 2.0 | 1266 | $1,700 | $1.34 | 25d | 1 | 1.04mi |
| 1846 N Princeton Ave Casa Grande, AZ | 4.0 | 2.0 | 1786 | $1,750 | $0.98 | 5d | 1 | 1.11mi |
| 520 W Casa Mirage Ct Casa Grande, AZ | 3.0 | 2.0 | 1536 | $1,600 | $1.04 | 5d | 1 | 1.20mi |
| 1858 N Center Ave Casa Grande, AZ | 2.0 | 2.0 | 1146 | $1,500 | $1.31 | 25d | 1 | 1.20mi |
| 1256 E Jahns Dr Casa Grande, AZ | 4.0 | 3.0 | 2094 | $2,199 | $1.05 | 6d | 1 | 1.22mi |
| 1775 N Terrace Cir Casa Grande, AZ | 3.0 | 2.0 | 1628 | $1,699 | $1.04 | 15d | 1 | 1.25mi |
| 2575 N Lupita Pl Casa Grande, AZ | 3.0 | 2.0 | 1630 | $1,595 | $0.98 | 25d | 1 | 1.27mi |
| 1153 E Gabrilla Dr Casa Grande, AZ | 4.0 | 2.0 | 1689 | $1,795 | $1.06 | 20d | 1 | 1.28mi |
| 2710 N Mulberry Pl Casa Grande, AZ | 3.0 | 2.0 | 1631 | $2,100 | $1.29 | 5d | 1 | 1.40mi |
| 1161 E O'Neil Dr Casa Grande, AZ | 2.0–4.0 | 2.0 | 1144 | $1,498 | $1.31 | 3d | 12 | 1.41mi |
| 645 W Jardin Dr Casa Grande, AZ | 3.0 | 2.0 | 1309 | $1,650 | $1.26 | 25d | 1 | 1.44mi |
| 2569 N Agave Ln Casa Grande, AZ | 3.0 | 2.0 | 1580 | $1,750 | $1.11 | 25d | 1 | 1.44mi |
| 1547 E Inouye Dr Casa Grande, AZ | 3.0 | 2.0 | 1571 | $3,500 | $2.23 | 25d | 1 | 1.47mi |
| 349 E Hawaii Dr Casa Grande, AZ | 3.0 | 2.0 | 1874 | $1,949 | $1.04 | 6d | 1 | 1.49mi |
| 1552 E Inouye Dr Casa Grande, AZ | 3.0 | 2.0 | 1560 | $1,699 | $1.09 | 15d | 1 | 1.49mi |
| 1552 E Inouye Dr Casa Grande, AZ | 3.0 | 2.0 | 1571 | $1,699 | $1.08 | 12d | 1 | 1.49mi |
| 1536 E Demain Dr Casa Grande, AZ | 4.0 | 2.0 | 1921 | $1,850 | $0.96 | 25d | 1 | 1.50mi |
| 109 E Baja Pl Casa Grande, AZ | 3.0 | 2.0 | 1850 | $1,800 | $0.97 | 25d | 1 | 1.50mi |
| 750 W Torino Pl Casa Grande, AZ | 3.0 | 2.0 | 2007 | $3,550 | $1.77 | 25d | 1 | 1.50mi |
Listing history 16 events
-
2026-06-18days on market $149,900 Active 12 DOM
-
2026-06-17days on market $149,900 Active 11 DOM
-
2026-06-16days on market $149,900 Active 10 DOM
-
2026-06-15days on market $149,900 Active 9 DOM
-
2026-06-13days on market $149,900 Active 7 DOM
-
2026-06-13days on market $149,900 Active 6 DOM
-
2026-06-09days on market $149,900 Active 3 DOM
-
2026-06-08days on market $149,900 Active 2 DOM
-
2026-06-07remarks 699-char remark
-
2026-06-07pricedays on market $149,900 Active 1 DOM
-
2026-03-08price $169,500
-
2026-01-03price $178,500
-
2025-11-08$183,500 Active
-
2025-10-25historical
-
2025-10-07price $192,000
-
2025-07-14$197,500 Active
ⓘ Source: listings_history table (triggers on properties + properties_extension) + one-shot
backfill from property_details.listing_events for pre-trigger history.
Climate risk First Street
- Flood 1/10 Low FEMA zone X (shaded) · 0% chance over 30 yrs
- Wildfire 6/10 Major
- Heat 9/10 Extreme 6 d/yr ≥113°F today · 16 d/yr by 30 yrs out
- Wind 1/10 Low
- Air quality 1/10 Low 0 unhealthy d/yr today · 0 by 30 yrs out
Nearby sold comps map
Loading sold comps map…
Walkable amenities ~0.75 mi
Loading nearby amenities…
Taxation est. · year 1
- Rental income
- $22,794
- − Mortgage interest
- −$8,397
- − Property taxes
- −$2,248
- − Insurance
- −$750
- − Repairs & maintenance
- −$1,824
- − Management
- −$1,824
- − Depreciation
- −$4,361
- Taxable income
- $3,391
- Est. tax owed @ 24.0%
- −$814
- After-tax cash flow
- $4,762/yr
For passive investors: Depreciation is non-cash, so a rental often shows a tax loss while cash-flowing — sheltering income. Rental losses are passive: they offset passive income freely, and up to $25,000/yr can offset ordinary (W-2) income if you actively participate and your MAGI is under $100k (phasing out to $0 by $150k); unused losses carry forward. On sale, claimed depreciation is recaptured at up to 25%, and gains may owe capital-gains tax (a 1031 exchange can defer both). Figures are a year-1 estimate at your 24.0% rate — not tax advice; consult a CPA.
Condition & rehab AI · 12 photos
This well-maintained, partially furnished home in the highly desirable Rancho Val Vista community offers a good investment opportunity with new flooring, appliances, and paint. The home is in good condition with a fresh roof and exterior paint, and it has a newer drip irrigation system for easy maintenance.
Value-add opportunities
- Both update flooring — new flooring throughout
- Both update appliances — new appliances
- Both update paint — new paint
Renovation cost estimate screening
Value-add ROI direction
- Both update flooring — new flooring throughout ↑
- Both update appliances — new appliances ↑
- Both update paint — new paint ↑
ⓘ Cost ranges are severity-bucket heuristics (US national rule-of-thumb). Get contractor quotes + a written scope before underwriting a rehab budget.
Schools (NCES district)
- District
- Casa Grande Union High School District (4453)
- NCES district ID
- 0401740
- Math proficiency
- 14% ▼ -15.00%
- Reading proficiency
- 21% ▼ -10.00%
- Median HH income
- $45,373
- Composite
- 15.38/100
- National rank
- #9319
- State rank
- #193 of 249 in AZ
Livability — Casa Grande
- Score
- 58/100
- State rank
- #220
- US rank
- #21534
Category grades
Schools grade is shown separately in the Schools card above.
Census & demographics
- Census place
- Casa Grande, AZ
- County
- Pinal County · 399,947 people
- City population
- 69,701
- Metro
- Phoenix-Mesa-Chandler, AZ
- Population (ZIP)
- 61,624
- Household income
- $68,443
- Rent vs Own
- Severe rent burden
- 1250.0
Population outlook (Pinal County) Hauer SSP2
- Today (2025)
- 437,574 people
- By 2030
- 446,903 · +2.1%
- By 2040
- 452,589 · +3.4%
- By 2050
- 444,126 · +1.5%
- By 2075
- 430,300 · -1.7%
- By 2100
- 393,536 · -10.1%
Race, ethnicity, and origin ACS 2023
- Neighborhood character
- Diverse neighborhood (Simpson 0.63)
- Race & ethnicity
- Hispanic / Latino 44% White 42% Two or more races 21% Black 4% Native American 4% Asian 1%
- Hispanic origin (detail)
- Mexican 40%
- Common ancestry
- Lithuanian 1% Slovak 1% Portuguese 1%
- Foreign-born
- 12% · Canada
- Languages at home
- 75% English-only · Spanish 23% Tagalog/Filipino 1% Other Indo-European 1%
Political lean MEDSL · Pinal
- 2024 margin
- Strong R (+22.1) · D 38.5% · R 60.6%
- 2008→2024 swing
- -7.6pp toward R · 2008: -14.5pp · 2024: -22.1pp
- All cycles
- 2024: R+22.1 2020: R+17.3 2016: R+19.3 2012: R+17.1 2008: R+14.5
Not yet ingested
- Civics
- —
Market trends
- HPI YoY
- ▼ -67.32%
- Current HPI
- 233.148
- Rent YoY
- ▲ 4.60%
- Metro
- Phoenix-Mesa-Chandler, AZ
- State GDP YoY
- ▲ 4.54%
- F500 in state
- 20
Industry mix (Fortune 500 HQ in AZ)
| Industry | F500 HQs | Revenue |
|---|---|---|
| Technology | 2 | $13B |
|
||
| Mining / Metals | 1 | $23B |
|
||
| Environmental Services | 1 | $16B |
|
||
| Metals / Steel | 1 | $14B |
|
||
| Technology Distribution | 1 | $9B |
|
||
| Homebuilding | 1 | $8B |
|
||
Price history
-14.2% since first listed6 events — show timeline
- 2026-03-08 Price Changed $169,500 ARMLS
- 2026-01-03 Price Changed $178,500 ARMLS
- 2025-11-08 Listed $183,500 ARMLS
- 2025-10-25 Listing Removed — ARMLS
- 2025-10-07 Price Changed $192,000 ARMLS
- 2025-07-14 Listed $197,500 ARMLS
Cash-flow waterfall
monthlySold comps — $/sqft
last 12 mo · ≤1 miLoading sold comps…