2137 Plumcrest Ln · Gastonia, NC
Flood risk 1/10 · Minimal
- FEMA flood zone
- X (unshaded)
- Chance of flooding over 30 yrs
- 0.0%
- Est. flood insurance / yr
- $507 – $1,088
Fire risk 4/10 · Minor
- Est. fire insurance / yr
- $783 – $1,453
Heat risk 6/10 · Moderate
- Hot days now (above 104°F)
- 7 days/yr
- Hot days in 30 yrs
- 16 days/yr
Wind risk 5/10 · Moderate
- Chance of severe wind over 30 yrs
- 22.0%
Air-quality risk 3/10 · Minor
- Unhealthy air days now
- 3 days/yr
- Unhealthy air days in 30 yrs
- 3 days/yr
Risk factors via First Street. Map © Google.
Why this score? — see what drove the B grade
The composite is a weighted blend of 9 inputs, each scored 0–100. Each bar is that input's sub-score; the figure is the points it added to the 100-point composite (weight × sub-score).
- Cash flow +30.0/30.0
- 1% rule +10.0/10.0
- DSCR +10.0/10.0
- ARV discount +7.5/15.0
- Schools +5.4/10.0
- Livability +3.0/5.0
- Rent growth +2.7/5.0
- Condition / age +2.5/5.0
- Appreciation +0.0/10.0
$110,000
🖨 Deal sheet 📄 Offer letter ✓ Due diligence
Listing remarks
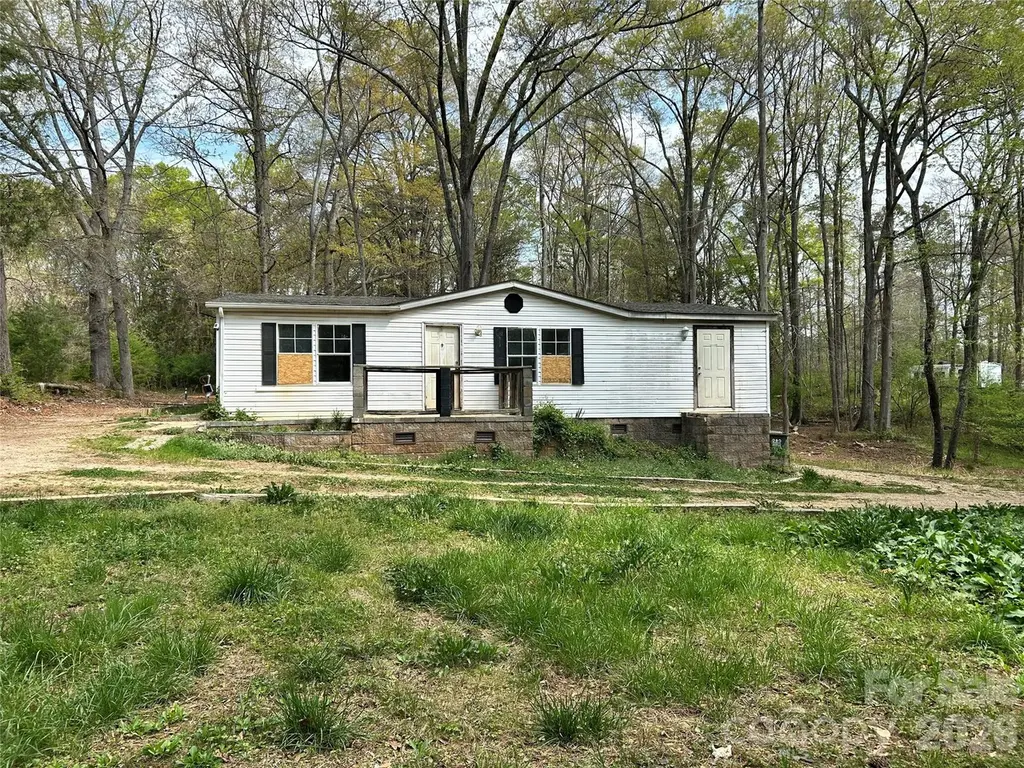
Investor Special. 1996 manufactured home on 1.5 acres. Partially wooded lot. Close to state line just off Hwy 321 in Gateway Farms subdivision. No HOA. Needs full renovation. No HVAC system. Well pump has been removed. DMV title is not retired. Cash buyers only please.
Key facts
- 1.5 acre lot
- Built 1996
- Listed 78 days
Property features AI
Finance
- HOA & community: No HOA
Exterior
- Parking: Driveway access; No main-level garage
- Utilities: Private well water; Septic system
- Home design: Manufactured doublewide single-family residence; One story; Crawl space foundation
- Construction: Manufactured construction; Vinyl exterior
- Exterior features: Dirt and paved road access; Publicly maintained road
Interior
- Kitchen: No kitchen appliances listed
- Bedrooms: Three bedrooms, all on the main level
- Bathrooms: Two full bathrooms
- Heating & cooling: No heating system listed; No cooling system listed
- Interior features: Seven total rooms; No listed built-in appliances
- Laundry & utility: Dedicated laundry room
Neighborhood map
What this means for you Summary
Snapshot
- This is a 3-bed/2.0-bath single-family listed at $110k.
Deal economics
- At list price, monthly cash flow is $839 ($10k/yr) — positive.
- The deal already cash-flows at list — no discount required.
- Meets the 1% rule at list price ($2k rent vs $110k).
- Recommended offer: $103k (6.0% below list) — sets the bar for market timing.
- Cap rate 15.4% vs local median 3.7% in Gastonia — top-decile yield for the area; either an underpriced asset or a hidden risk that comps aren't pricing in. Stress-test before assuming the spread holds.
Location & tenants
- Location reads 59/100 on livability (#528 in NC) — a working-class tenant base; expect higher turnover. Strengths: cost of living A+, housing A+; Watch: schools D, employment D, crime F.
- York 02 (rural): math 61% / reading 63% proficiency, ranked #2 of 80 in SC (top 2%) — acceptable for families but not a draw, mixed tenant base, ~2y average lease.
- Market conditions: Rents flat; 1 active listings in the ZIP; 1 comparable units currently listed for rent nearby; solid renter incomes; 2,550 units permitted in York County in 2024 (350 in 5+ unit buildings).
Forward outlook
- Local home prices are declining (-3.0%/yr); year-one equity from $761 of loan paydown is wiped out by about $3k of value loss. Plan a longer hold.
- York County population projected at +44% by 2050 — long-run rental-demand tailwind backs the buy-and-hold thesis.
- At projected returns (-3.0% appreciation + 0.9% rent growth), your $31k cash investment doubles in ~4 years — after that, you're playing with house money.
Negotiation context
- It's been on market 78 days — a 6% lower offer ($103k) is reasonable based on typical stale-listing flexibility.
- Current owner paid $10k; list at $110k implies a 1058% gain — meaningful room to come down on a strong offer.
Risks & watch-outs
- Climate carrying-cost: moderate wind risk, 22% chance of damaging wind over 30y; extreme-heat days projected 7→16/yr by 2055 (HVAC capex compounding) — expect insurance premiums to compound above CPI over the hold.
Questions for the listing agent
- It's been on market 78 days. Have you received any prior offers? Is the seller open to a 6% concession, seller financing, or rate buy-down credit?
- Why hasn't it sold? Are there any deal-killer items the seller is aware of (foundation, flood, title, zoning, code violations)?
- Is there a deadline driving the sale (1031 exchange, divorce, estate, relocation)? That informs how much negotiation room exists.
- Schools are D-rated, which usually means shorter tenancies and higher turnover. Who's the typical renter profile here, and what's been the actual vacancy rate?
- Crime grade is F in this area — have there been break-ins, vandalism, or insurance claims at this property in the last 3 years? What carrier currently insures it and at what premium?
- What's the average days-on-market for RENTAL listings here right now (not sales)? A rising rental-DOM trend means longer vacancies and softer asking-rent achievability than the comps imply.
- What's the recent tenant-quality profile in this submarket — average credit score on applications, eviction rate, late-payment / NSF rate, and stable-employment percentage? A property-management company in the area should have these aggregated.
- How much new for-sale + rental construction is in the pipeline within 1–3 miles? Heavy new supply typically softens prices + rents 12–24 months out; constrained supply supports both.
Investment metrics
- 1% rule
- 1.80% ✓
- Cap rate
- 15.45%
- Cash-on-cash
- 32.70%
- DSCR
- 2.45
- GRM
- 4.6
CMA / ARV
No comps found within radius.
Projected returns pro-forma
-3.0% appreciation · 0.88% rent growth · sell at horizon
- IRR
- 25.4%
- Equity multiple
- 2.02×
- Total profit
- $31,496
- Equity at exit
- $16,401
- IRR
- 31.8%
- Equity multiple
- 3.60×
- Total profit
- $79,997
- Equity at exit
- $9,511
Cash invested: $30,800 (down + closing). Projections, not guarantees.
Landlord ↔ Tenant lean methodology
- Overall (STATE)
- 85 Strongly Landlord-Friendly
- State North Carolina
- 85 Strongly Landlord-Friendly · R+3
- County
- — inherits STATE
- City
- — inherits STATE
ZIP-level market 29710
- Rents YoY
- 0.9%
- Active inventory
- 1
- Price-to-rent
- 4.6×
Monthly cashflow live
- Estimated rent
- $1,985 medium interval (Pro) →
- Mortgage (P&I)
- −$577
- Tax from tax record
- −$106 /mo · $1,273/yr
- Insurance
- −$46
- HOA
- −$0
- Vacancy / Maint / Mgmt
- −$417
- Net cashflow
- $839
Break-even live
UW: 25.0% down · 7.5% · 30yr · 1.5% tax · 5.0% vac · 8.0% maint · 8.0% mgmt
Financing live
Cash to close
- Down payment
- $27,500
- Closing costs
- $3,300
- Reserves months
- —
- Total cash needed
- —
Loan-product check · same deal, 3 products live
Conventional
25% down · 7.5% · 30yr
- Down + closing
- —
- Monthly P&I
- —
- Monthly cashflow
- —
- DSCR
- —
- Eligible?
- —
Personal DTI + credit; lowest rate.
DSCR
20% down · 8.5% · 30yr
- Down + closing
- —
- Monthly P&I
- —
- Monthly cashflow
- —
- DSCR
- —
- Eligible?
- —
No personal income docs; deal must DSCR.
Hard money
10% down · 12.0% · 12mo
- Down + closing
- —
- Monthly P&I
- —
- Monthly cashflow
- —
- DSCR
- —
- Eligible?
- —
Short-term bridge; refi at stabilization.
Rent comps 1 comps
| Address | Beds | Baths | Sqft | Rent | $/sqft | DOM | Units | Dist |
|---|---|---|---|---|---|---|---|---|
| 244 Salemview Rd Gastonia, NC | 3.0 | 2.0 | 1766 | $1,600 | $0.91 | 1d | 1 | 0.37mi |
Listing history 18 events
-
2026-06-18days on market $110,000 Active 78 DOM
-
2026-06-17days on market $110,000 Active 77 DOM
-
2026-06-16days on market $110,000 Active 76 DOM
-
2026-06-15days on market $110,000 Active 75 DOM
-
2026-06-13days on market $110,000 Active 73 DOM
-
2026-06-13pricedays on market $110,000 Active 72 DOM
-
2026-06-09days on market $119,900 Active 69 DOM
-
2026-06-08days on market $119,900 Active 68 DOM
-
2026-06-07days on market $119,900 Active 67 DOM
-
2026-06-04days on market $119,900 Active 64 DOM
-
2026-06-03days on market $119,900 Active 63 DOM
-
2026-06-02days on market $119,900 Active 62 DOM
-
2026-06-01days on market $119,900 Active 61 DOM
-
2026-05-31days on market $119,900 Active 60 DOM
-
2026-05-08price $119,900
-
2026-04-01$130,000 Active
-
2026-03-27historical $130,000
-
1998-05-08soldstatus $9,500
ⓘ Source: listings_history table (triggers on properties + properties_extension) + one-shot
backfill from property_details.listing_events for pre-trigger history.
Tax reassessment forecast NC · Resets to sale price
- Current annual tax
- $1,273 · $106/mo
- Projected year-2 tax
- $1,273 · $106/mo
- Expected delta
- $0/yr ($0/mo · 0.0%)
ⓘ Screening estimate from a state-policy table — verify with the county assessor before closing.
Climate risk First Street
- Flood 1/10 Low FEMA zone X (unshaded) · 0% chance over 30 yrs
- Wildfire 4/10 Moderate
- Heat 6/10 Major 7 d/yr ≥104°F today · 16 d/yr by 30 yrs out
- Wind 5/10 Major 22% chance of damaging wind over 30 yrs
- Air quality 3/10 Moderate 3 unhealthy d/yr today · 3 by 30 yrs out
Nearby sold comps map
Loading sold comps map…
Walkable amenities ~0.75 mi
Loading nearby amenities…
Taxation est. · year 1
- Rental income
- $23,819
- − Mortgage interest
- −$6,162
- − Property taxes
- −$1,273
- − Insurance
- −$550
- − Repairs & maintenance
- −$1,905
- − Management
- −$1,905
- − Depreciation
- −$3,200
- Taxable income
- $8,823
- Est. tax owed @ 24.0%
- −$2,118
- After-tax cash flow
- $7,954/yr
For passive investors: Depreciation is non-cash, so a rental often shows a tax loss while cash-flowing — sheltering income. Rental losses are passive: they offset passive income freely, and up to $25,000/yr can offset ordinary (W-2) income if you actively participate and your MAGI is under $100k (phasing out to $0 by $150k); unused losses carry forward. On sale, claimed depreciation is recaptured at up to 25%, and gains may owe capital-gains tax (a 1031 exchange can defer both). Figures are a year-1 estimate at your 24.0% rate — not tax advice; consult a CPA.
Schools (NCES district)
- District
- York 02
- NCES district ID
- 4503840
- Math proficiency
- 61% ▼ -4.00%
- Reading proficiency
- 63% ▲ 3.00%
- Median HH income
- $60,598
- Composite
- 53.74/100
- National rank
- #1421
- State rank
- #2 of 80 in SC
Livability — Gastonia
- Score
- 59/100
- State rank
- #528
- US rank
- #19444
Category grades
Schools grade is shown separately in the Schools card above.
Census & demographics
- County
- York County
- City population
- 114,179
- Metro
- Charlotte-Concord-Gastonia, NC-SC
- Population (ZIP)
- 40,595
- Household income
- $96,563
- Rent vs Own
- Severe rent burden
- 569.0
Population outlook (York County) Hauer SSP2
- Today (2025)
- 307,757 people
- By 2030
- 335,979 · +9.2%
- By 2040
- 391,378 · +27.2%
- By 2050
- 443,234 · +44.0%
- By 2075
- 557,102 · +81.0%
- By 2100
- 625,837 · +103.4%
Race, ethnicity, and origin ACS 2023
- Neighborhood character
- Predominantly White (77%)
- Race & ethnicity
- White 77% Black 10% Hispanic / Latino 8% Two or more races 7%
- Hispanic origin (detail)
- Mexican 2% Cuban 1%
- Common ancestry
- Serbian 4% Slovak 3% Romanian 2%
- Foreign-born
- 4% · Canada, Jamaica
- Languages at home
- 94% English-only · Spanish 4% Other Indo-European 1%
Political lean MEDSL · York
- 2024 margin
- R (+19.1) · D 39.7% · R 58.8% · Other 1.5%
- 2008→2024 swing
- -1.4pp toward R · 2008: -17.7pp · 2024: -19.1pp
- All cycles
- 2024: R+19.1 2020: R+16.5 2016: R+22.1 2012: R+20.5 2008: R+17.7
Not yet ingested
- Civics
- —
Market trends
- HPI YoY
- ▼ -194.83%
- Current HPI
- 252.3011
- Rent YoY
- ▲ 0.88%
- Metro
- Charlotte-Concord-Gastonia, NC-SC
- State GDP YoY
- ▲ 3.28%
- F500 in state
- 26
Industry mix (Fortune 500 HQ in NC)
| Industry | F500 HQs | Revenue |
|---|---|---|
| Financial Services | 2 | $213B |
|
||
| Retail | 2 | $95B |
|
||
| Industrial Conglomerate | 1 | $38B |
|
||
| Metals / Steel | 1 | $35B |
|
||
| Utilities | 1 | $30B |
|
||
| Industrial Machinery | 1 | $19B |
|
||
Price history
+1162.1% since first listed4 events — show timeline
- 2026-05-08 Price Changed $119,900 CANOPYMLS as Distributed by MLS Grid
- 2026-04-01 Listed $130,000 CANOPYMLS as Distributed by MLS Grid
- 2026-03-27 Coming Soon $130,000 CANOPYMLS as Distributed by MLS Grid
- 1998-05-08 Sold (Public Records) $9,500 Public Records
Property tax history
+41.5%/yrLatest (2025): $1,273 · +3.1% YoY. Source: county tax records.
Cash-flow waterfall
monthlySold comps — $/sqft
last 12 mo · ≤1 miLoading sold comps…