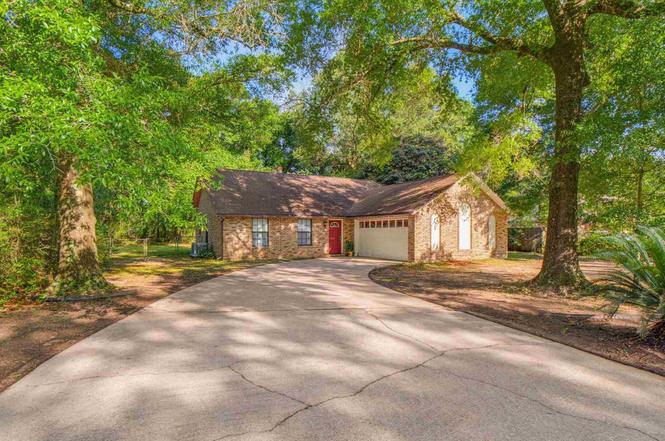
5909 Lawson Ln · Milton, FL
Flood risk 4/10 · Minor
- FEMA flood zone
- X (unshaded)
- Chance of flooding over 30 yrs
- 0.22%
- Est. flood insurance / yr
- $507 – $1,088
Fire risk 4/10 · Minor
- Est. fire insurance / yr
- $947 – $1,759
Heat risk 9/10 · Severe
- Hot days now (above 106°F)
- 7 days/yr
- Hot days in 30 yrs
- 21 days/yr
Wind risk 9/10 · Severe
- Chance of severe wind over 30 yrs
- 99.0%
Air-quality risk 1/10 · Minimal
- Unhealthy air days now
- 0 days/yr
- Unhealthy air days in 30 yrs
- 0 days/yr
Risk factors via First Street. Map © Google.
Why this score? — see what drove the C grade
The composite is a weighted blend of 9 inputs, each scored 0–100. Each bar is that input's sub-score; the figure is the points it added to the 100-point composite (weight × sub-score).
- Cash flow +17.1/30.0
- ARV discount +14.7/15.0
- DSCR +5.3/10.0
- Schools +5.3/10.0
- 1% rule +3.9/10.0
- Livability +3.9/5.0
- Rent growth +3.2/5.0
- Condition / age +2.5/5.0
- Appreciation +0.0/10.0
$225,000
🖨 Deal sheet (PDF) 📄 Offer letter ✓ Due diligence
Listing remarks
Are you looking for an affordable home in a convenient location? This 3-bedroom, 2-bath home offers a spacious floor plan with a large living room, cozy fireplace, and a generously sized yard with plenty of room to relax, entertain, or create your ideal outdoor space. Features include three bedrooms, two full bathrooms, a welcoming living area, and a desirable location close to local amenities, shopping, dining, and schools. Being sold as-is (no known issues), this property presents a great opportunity for homeowners looking to add their personal touch or investors seeking their next project. With solid potential and plenty of charm, this home is ready for its next chapter.
Key facts
- Desirable location
- Large living room
- Cozy fireplace
Tags
Property features AI
Finance
- Other: Located on a county-maintained road
- HOA & community: No homeowners association
Exterior
- Parking: Attached 2-car garage with side entrance; Two covered parking spaces (total 2 parking spaces)
- Utilities: Public water; Public sewer; Electric service with circuit breakers
- Home design: One-story single-family home; Resale property; Not attached to another property; Insulation indicated for energy efficiency
- Construction: Brick construction; Slab foundation; Composition roof; Built on one level
- Exterior features: Interior lot
Interior
- Kitchen: Eat-in kitchen; Electric water heater
- Bedrooms: Primary bedroom on the first floor (approx. 10.3' x 16.3'); Additional bedroom on the first floor (approx. 10' x 11')
- Flooring: Tile; Carpet
- Bathrooms: Two full bathrooms
- Heating & cooling: Central heating; Central air; Ceiling fans
- Interior features: Tile and carpet flooring; Double-pane windows
Neighborhood map
What this means for you Summary
Snapshot
- This is a 3-bed/2.0-bath single-family listed at $225k.
Deal economics
- At list price, monthly cash flow is $156 ($2k/yr) — positive.
- The deal already cash-flows at list — no discount required.
- To meet the 1% rule (rent ≥ 1% of price), the offer needs to be $201k (10.5% below list).
- Recommended offer: $201k (10.5% below list) — sets the bar for 1% rule.
- Cap rate 7.1% vs local median 4.6% in Milton — top-decile yield for the area; either an underpriced asset or a hidden risk that comps aren't pricing in. Stress-test before assuming the spread holds.
Location & tenants
- Location reads 78/100 on livability (#166 in FL, #2,480 nationally) — a middle-class / working-renter tenant base. Strengths: cost of living A+, housing A+, health & safety A+; Watch: amenities D-, commute F.
- Santa Rosa (suburban): math 63% / reading 60% proficiency, ranked #8 of 73 in FL (top 11%) — acceptable for families but not a draw, mixed tenant base, ~2y average lease.
- Zoned schools: W. H. Rhodes Elementary School (math 55% / reading 47%, grade C-, #1,043 of 2,144 statewide, top 49%, 812 students, 79% FRL); Hobbs Middle School (math 52% / reading 48%, grade C, #254 of 571 statewide, top 45%, 700 students, 63% FRL); Milton High School (math 44% / reading 42%, grade F, #255 of 667 statewide, top 39%, 2,085 students, 54% FRL) — zoned schools average 65% FRL vs 36% district-wide (29 pts higher); higher-poverty schools than district average — tighter screening recommended.
- Zoned-school proficiency averages 48% at this address vs 62% district-wide (-14 pts) — the specific schools serving this property underperform the Santa Rosa average; the district grade overstates school quality for this exact location.
- Market conditions: Rents rising (+2.7%/yr); 360 active listings in the ZIP; 7 comparable units currently listed for rent nearby; rentals at typical pace (median 25d on market — plan ~3-4 weeks tenant-placement turnaround); solid renter incomes; 1,983 units permitted in Santa Rosa County in 2024 (128 in 5+ unit buildings).
- This rent runs 31% of the median local income ($77k/yr) — at the standard rent-burdened threshold; future hikes will face affordability resistance.
Forward outlook
- Local home prices are declining (-3.0%/yr); year-one equity from $2k of loan paydown is wiped out by about $7k of value loss. Plan a longer hold.
- Santa Rosa County population projected at +31% by 2050 — long-run rental-demand tailwind backs the buy-and-hold thesis.
Negotiation context
- Only 8 days on market — expect competitive offers; lowballing is unlikely to land.
- 2 sale attempts since 19y ago with the ask held roughly flat each time — persistent listings suggest the price (not the market) is what's stuck; bring a comps-based counter.
- Current owner paid $73k; list at $225k implies a 208% gain — meaningful room to come down on a strong offer.
Risks & watch-outs
- Climate carrying-cost: severe wind risk, 99% chance of damaging wind over 30y; extreme-heat days projected 7→21/yr by 2055 (HVAC capex compounding) — expect insurance premiums to compound above CPI over the hold.
Questions for the listing agent
- Is there a deadline driving the sale (1031 exchange, divorce, estate, relocation)? That informs how much negotiation room exists.
- Schools are B-rated — typically a magnet for longer-tenancy family renters. What's the average tenant stay here, and is there a school-zone premium baked into asking?
- What's the average days-on-market for RENTAL listings here right now (not sales)? A rising rental-DOM trend means longer vacancies and softer asking-rent achievability than the comps imply.
- What's the recent tenant-quality profile in this submarket — average credit score on applications, eviction rate, late-payment / NSF rate, and stable-employment percentage? A property-management company in the area should have these aggregated.
- How much new for-sale + rental construction is in the pipeline within 1–3 miles? Heavy new supply typically softens prices + rents 12–24 months out; constrained supply supports both.
Investment metrics
- 1% rule
- 0.89% ✗
- Cap rate
- 7.13%
- Cash-on-cash
- 2.98%
- DSCR
- 1.13
- GRM
- 9.3
CMA / ARV
- ARV (on-the-fly)
- $267,615
- Comps found
- 12
Show comp detail 12 sales within ~0.75 mi
| Address | Dist | Beds/Ba | Sqft | Sold | Price | $/sf | Match |
|---|---|---|---|---|---|---|---|
| 6136 Arnies Way | 0.10mi | 3/2.0 | 1,673 (+7%) | 2mo | $285,000 | $170 | 82 |
| 5898 Cedar Tree Dr | 0.42mi | 3/2.0 | 1,560 (-0%) | 1mo | $265,000 | $170 | 79 |
| 6028 Players Pl | 0.16mi | 4/2.0 (+1) | 1,730 (+10%) | 1mo | $365,000 | $211 | 69 |
| 5773 Hermitage Cir | 0.37mi | 3/2.0 | 1,718 (+10%) | 3mo | $250,000 | $146 | 64 |
| 6008 Kingswood Dr | 0.61mi | 3/2.0 | 1,508 (-4%) | 5mo | $225,000 | $149 | 62 |
| 6108 Arnies Way | 0.24mi | 3/2.0 | 1,762 (+13%) | 10mo | $297,000 | $169 | 60 |
| 5905 Castle Dr | 0.69mi | 3/2.0 | 1,492 (-5%) | 6mo | $255,000 | $171 | 55 |
| 5899 Cedar Tree Dr | 0.44mi | 3/2.0 | 1,425 (-9%) | 13mo | $290,000 | $204 | 54 |
| 5745 Hermitage Cir | 0.44mi | 3/2.5 | 1,748 (+12%) | 7mo | $320,000 | $183 | 52 |
| 5633 Lia Dr | 0.66mi | 3/2.0 | 1,728 (+10%) | 8mo | $295,000 | $171 | 46 |
| 6028 Laurelwood Dr | 0.58mi | 3/2.0 | 1,748 (+12%) | 10mo | $309,000 | $177 | 45 |
| 5887 Southern Bell Ct | 0.72mi | 4/2.0 (+1) | 1,747 (+12%) | 8mo | $275,000 | $157 | 35 |
Match score weights: distance 35% · size 25% · config 20% · recency 20%. Top-matched comps best support the ARV.
Projected returns pro-forma
-3.0% appreciation · 2.7% rent growth · sell at horizon
- IRR
- -11.9%
- Equity multiple
- 0.57×
- Total profit
- $-27,159
- Equity at exit
- $33,548
- IRR
- -3.2%
- Equity multiple
- 0.79×
- Total profit
- $-13,486
- Equity at exit
- $19,454
Cash invested: $63,000 (down + closing). Projections, not guarantees.
Landlord ↔ Tenant lean methodology
- Overall (STATE)
- 87 Strongly Landlord-Friendly
- State Florida
- 87 Strongly Landlord-Friendly · R+3
- County
- — inherits STATE
- City
- — inherits STATE
ZIP-level market 32570
- Home prices YoY
- -15.1%
- Rents YoY
- 2.7%
- Active inventory
- 360
- Price-to-rent
- 9.3×
Monthly cashflow live
- Estimated rent
- $2,013 high interval (Pro) →
- Mortgage (P&I)
- −$1,180
- Tax from tax record
- −$160 /mo · $1,922/yr
- Insurance
- −$94
- HOA
- −$0
- Vacancy / Maint / Mgmt
- −$423
- Net cashflow
- $156
Break-even live
Sensitivity live
| Price | -10% $284 | -5% $220 | +0% $156 | +5% $93 | +10% $29 |
|---|---|---|---|---|---|
| Rent | -10% $-3 | -5% $77 | +0% $156 | +5% $236 | +10% $315 |
| Rate | -1.0pp $270 | -0.5pp $213 | base $156 | +0.5pp $98 | +1.0pp $39 |
UW: 25.0% down · 7.5% · 30yr · 1.5% tax · 5.0% vac · 8.0% maint · 8.0% mgmt
Financing live
Cash to close
- Down payment
- $56,250
- Closing costs
- $6,750
- Reserves months
- —
- Total cash needed
- —
Loan-product check · same deal, 3 products live
Conventional
25% down · 7.5% · 30yr
- Down + closing
- —
- Monthly P&I
- —
- Monthly cashflow
- —
- DSCR
- —
- Eligible?
- —
Personal DTI + credit; lowest rate.
DSCR
20% down · 8.5% · 30yr
- Down + closing
- —
- Monthly P&I
- —
- Monthly cashflow
- —
- DSCR
- —
- Eligible?
- —
No personal income docs; deal must DSCR.
Hard money
10% down · 12.0% · 12mo
- Down + closing
- —
- Monthly P&I
- —
- Monthly cashflow
- —
- DSCR
- —
- Eligible?
- —
Short-term bridge; refi at stabilization.
Rent comps 7 comps
| Address | Beds | Baths | Sqft | Rent | $/sqft | DOM | Units | Dist |
|---|---|---|---|---|---|---|---|---|
| 5723 Maggie Rose Cir Milton, FL | 3.0 | 2.0 | 1610 | $2,000 | $1.24 | 15d | 1 | 0.95mi |
| 5723 Maggie Rose Cir Milton, FL | 3.0 | 2.0 | 1610 | $2,000 | $1.24 | 25d | 1 | 0.95mi |
| 5733 Orange St Milton, FL | 3.0 | 1.5 | 1640 | $1,500 | $0.91 | 25d | 1 | 1.03mi |
| 5555 Hannah St Milton, FL | 3.0 | 2.0 | 2010 | $1,900 | $0.95 | 25d | 1 | 1.06mi |
| 5837 Berryhill Rd Milton, FL | 3.0 | 2.0 | 1131 | $1,950 | $1.72 | 22d | 1 | 1.18mi |
| 6707 Cedar Ridge Cir Milton, FL | 3.0 | 2.5 | 1669 | $1,900 | $1.14 | 15d | 1 | 1.44mi |
| 6716 Barnwood Dr Milton, FL | 3.0 | 2.0 | 1753 | $1,850 | $1.06 | 25d | 1 | 1.46mi |
Listing history 8 events
-
2026-06-18days on market $225,000 Active 8 DOM
-
2026-06-17days on market $225,000 Active 7 DOM
-
2026-06-16days on market $225,000 Active 6 DOM
-
2026-06-15remarks 682-char remark
-
2026-06-15days on market $225,000 Active 5 DOM
-
2026-06-14days on market $225,000 Active 3 DOM
-
2026-06-13remarks 664-char remark
-
2026-06-13$225,000 Active 2 DOM
ⓘ Source: listings_history table (triggers on properties + properties_extension) + one-shot
backfill from property_details.listing_events for pre-trigger history.
Tax reassessment forecast FL · Resets to sale price
- Current annual tax
- $1,922 · $160/mo
- Projected year-2 tax
- $1,922 · $160/mo
- Expected delta
- $0/yr ($0/mo · 0.0%)
ⓘ Screening estimate from a state-policy table — verify with the county assessor before closing.
Climate risk First Street
- Flood 4/10 Moderate FEMA zone X (unshaded) · 22% chance over 30 yrs
- Wildfire 4/10 Moderate
- Heat 9/10 Extreme 7 d/yr ≥106°F today · 21 d/yr by 30 yrs out
- Wind 9/10 Extreme 99% chance of damaging wind over 30 yrs
- Air quality 1/10 Low 0 unhealthy d/yr today · 0 by 30 yrs out
Nearby sold comps map
Loading sold comps map…
Walkable amenities ~0.75 mi
Loading nearby amenities…
Taxation est. · year 1
- Rental income
- $24,153
- − Mortgage interest
- −$12,603
- − Property taxes
- −$1,922
- − Insurance
- −$1,125
- − Repairs & maintenance
- −$1,932
- − Management
- −$1,932
- − Depreciation
- −$6,545
- Taxable loss
- −$1,907
- Est. tax savings @ 24.0%
- +$458
- After-tax cash flow
- $2,333/yr
For passive investors: Depreciation is non-cash, so a rental often shows a tax loss while cash-flowing — sheltering income. Rental losses are passive: they offset passive income freely, and up to $25,000/yr can offset ordinary (W-2) income if you actively participate and your MAGI is under $100k (phasing out to $0 by $150k); unused losses carry forward. On sale, claimed depreciation is recaptured at up to 25%, and gains may owe capital-gains tax (a 1031 exchange can defer both). Figures are a year-1 estimate at your 24.0% rate — not tax advice; consult a CPA.
Schools (NCES district)
- District
- Santa Rosa
- NCES district ID
- 1201650
- Math proficiency
- 63% ▼ -6.00%
- Reading proficiency
- 60% ▼ -5.00%
- Median HH income
- $58,161
- Composite
- 53.12/100
- National rank
- #1511
- State rank
- #8 of 73 in FL
Livability — Milton
- Score
- 78/100
- State rank
- #166
- US rank
- #2480
Category grades
Schools grade is shown separately in the Schools card above.
Census & demographics
- County
- Santa Rosa County · 194,764 people
- City population
- 69,025
- Metro
- Pensacola-Ferry Pass-Brent, FL
- Population (ZIP)
- 37,197
- Household income
- $77,222
- Rent vs Own
- Severe rent burden
- 590.0
Population outlook (Santa Rosa County) Hauer SSP2
- Today (2025)
- 195,978 people
- By 2030
- 209,782 · +7.0%
- By 2040
- 235,293 · +20.1%
- By 2050
- 256,408 · +30.8%
- By 2075
- 298,074 · +52.1%
- By 2100
- 303,216 · +54.7%
Race, ethnicity, and origin ACS 2023
- Neighborhood character
- Predominantly White (80%)
- Race & ethnicity
- White 80% Two or more races 7% Black 6% Hispanic / Latino 6% Asian 1%
- Hispanic origin (detail)
- Mexican 2% Puerto Rican 2%
- Common ancestry
- Italian 4% Lithuanian 3% Portuguese 2%
- Foreign-born
- 4% · Canada
- Languages at home
- 94% English-only · Spanish 4% Other Asian/Pacific 1%
Political lean MEDSL · Santa Rosa
- 2024 margin
- Solid R (+51.0) · D 24.1% · R 75.0%
- 2008→2024 swing
- -3.0pp toward R · 2008: -47.9pp · 2024: -51.0pp
- All cycles
- 2024: R+51.0 2020: R+46.5 2016: R+53.5 2012: R+52.6 2008: R+47.9
Not yet ingested
- Civics
- —
Market trends
- HPI YoY
- ▼ -51.06%
- Current HPI
- 287.7469
- Rent YoY
- ▲ 2.70%
- Metro
- Pensacola-Ferry Pass-Brent, FL
- State GDP YoY
- ▲ 3.28%
- F500 in state
- 36
Industry mix (Fortune 500 HQ in FL)
| Industry | F500 HQs | Revenue |
|---|---|---|
| Industrial Technology | 2 | $29B |
|
||
| Insurance | 2 | $17B |
|
||
| Retail | 1 | $60B |
|
||
| Technology Distribution | 1 | $58B |
|
||
| Homebuilding | 1 | $35B |
|
||
| Technology Manufacturing | 1 | $35B |
|
||
Price history
+276.3% since first listed5 events — show timeline
- 2026-06-10 Listed $225,000 PARMLS
- 2007-10-30 Listing Removed — PARMLS
- 2007-06-13 Listed $139,900 PARMLS
- 1998-12-02 Sold (Public Records) $73,000 Public Records
- 1989-02-01 Sold (Public Records) $59,800 Public Records
Property tax history
+4.5%/yrLatest (2025): $1,922 · +4.3% YoY. Source: county tax records.
Cash-flow waterfall
monthlySold comps — $/sqft
last 12 mo · ≤1 miLoading sold comps…