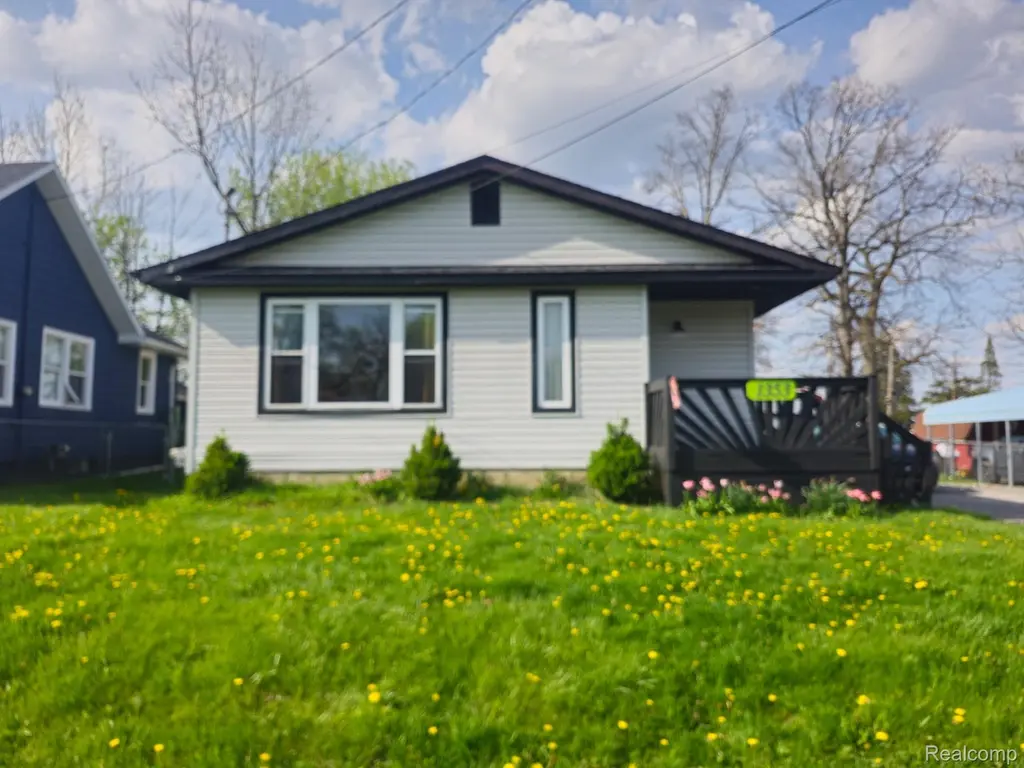
1353 E Decamp St · Burton, MI
Flood risk 1/10 · Minimal
- FEMA flood zone
- X (unshaded)
- Chance of flooding over 30 yrs
- 0.0%
- Est. flood insurance / yr
- $473 – $860
Fire risk 1/10 · Minimal
- Est. fire insurance / yr
- $784 – $1,456
Heat risk 2/10 · Minimal
- Hot days now (above 96°F)
- 7 days/yr
- Hot days in 30 yrs
- 15 days/yr
Wind risk 2/10 · Minimal
- Chance of severe wind over 30 yrs
- —
Air-quality risk 3/10 · Minor
- Unhealthy air days now
- 3 days/yr
- Unhealthy air days in 30 yrs
- 4 days/yr
Risk factors via First Street. Map © Google.
Why this score? — see what drove the B grade
The composite is a weighted blend of 9 inputs, each scored 0–100. Each bar is that input's sub-score; the figure is the points it added to the 100-point composite (weight × sub-score).
- Cash flow +30.0/30.0
- ARV discount +15.0/15.0
- 1% rule +10.0/10.0
- DSCR +10.0/10.0
- Livability +3.1/5.0
- Rent growth +2.5/5.0
- Condition / age +2.5/5.0
- Schools +1.4/10.0
- Appreciation +0.0/10.0
$80,000
🖨 Deal sheet (PDF) 📄 Offer letter ✓ Due diligence
Listing remarks MLS
GREAT OPPORTUNITY ON THIS 3 BEDROOM RANCH. HOME FEATURES A FULL FINISHED BASEMENT, 1 1/2 BATHS DEEP LOT AND AN OPEN FLOOR PLAN. IMMEDIATE OCCUPANCY! HURRY, THIS WON'T LAST LONG.
Key facts
- 0.34 acre lot
- Built 1970
- Listed 6 days
Property features AI
Finance
- Other: Lot approximately 0.34 acres (dimensions 68 x 98 x 67 x 98); Subdivision: Baker Park; Directions: Hemphill to S Grand Traverse to E Decamp
Exterior
- Parking: No garage
- Utilities: Public water; Public sewer
- Home design: Single-family residence; One level; Ground-level entry
- Construction: Vinyl siding; Block foundation; Asphalt roof; Built as residential single-family
- Exterior features: Deck; Porch; Paved road access
Interior
- Kitchen: Dishwasher; Free-standing electric range
- Bathrooms: 1 full bathroom; 1 half bathroom
- Heating & cooling: Forced air heating (natural gas); No cooling
- Interior features: Finished basement with sump pump; Total of 5 rooms
Neighborhood map
What this means for you Summary
Snapshot
- This is a 3-bed/1.5-bath single-family listed at $80k.
Deal economics
- At list price, monthly cash flow is $479 ($6k/yr) — positive.
- The deal already cash-flows at list — no discount required.
- Meets the 1% rule at list price ($1k rent vs $80k).
- Cap rate 13.5% vs local median 3.7% in Burton — top-decile yield for the area; either an underpriced asset or a hidden risk that comps aren't pricing in. Stress-test before assuming the spread holds.
Location & tenants
- Location reads 61/100 on livability (#555 in MI) — a middle-class / working-renter tenant base. Strengths: cost of living A+, housing A+; Watch: employment D, crime F, amenities F.
- Bendle Public Schools (suburban): math 6% / reading 29% proficiency, ranked #487 of 540 in MI (top 90%) — low school quality limits family demand, transient renter base, plan for 1-2y turnover; 81% free/reduced lunch — lower-income household profile, screen leases tightly.
- Zoned schools: Bendle Middle School (math 5% / reading 27%, grade F, #447 of 493 statewide, top 91%, 230 students, 91% FRL); Bendle High School (math 5% / reading 34%, grade F, #611 of 713 statewide, top 87%, 317 students, 90% FRL).
- Market conditions: 54 active listings in the ZIP; 2 comparable units currently listed for rent nearby; 419 units permitted in Genesee County in 2024 (68 in 5+ unit buildings).
Forward outlook
- Local home prices are declining (-3.0%/yr); year-one equity from $553 of loan paydown is wiped out by about $2k of value loss. Plan a longer hold.
- Genesee County population projected at -27% by 2050 — secular population decline; favor cash flow + early exit over multi-decade hold.
- At projected returns (-3.0% appreciation + 3.0% rent growth), your $22k cash investment doubles in ~5 years — after that, you're playing with house money.
Negotiation context
- Only 6 days on market — expect competitive offers; lowballing is unlikely to land.
- 6 sale attempts since 30y ago with the ask held roughly flat each time — persistent listings suggest the price (not the market) is what's stuck; bring a comps-based counter.
- Current owner paid $45k; list at $80k implies a 78% gain — meaningful room to come down on a strong offer.
Questions for the listing agent
- Built in 1970 — when were the roof, HVAC, electrical panel, plumbing, and water heater last replaced?
- Is there a deadline driving the sale (1031 exchange, divorce, estate, relocation)? That informs how much negotiation room exists.
- Schools are F-rated, which usually means shorter tenancies and higher turnover. Who's the typical renter profile here, and what's been the actual vacancy rate?
- Crime grade is F in this area — have there been break-ins, vandalism, or insurance claims at this property in the last 3 years? What carrier currently insures it and at what premium?
- What's the average days-on-market for RENTAL listings here right now (not sales)? A rising rental-DOM trend means longer vacancies and softer asking-rent achievability than the comps imply.
- What's the recent tenant-quality profile in this submarket — average credit score on applications, eviction rate, late-payment / NSF rate, and stable-employment percentage? A property-management company in the area should have these aggregated.
- How much new for-sale + rental construction is in the pipeline within 1–3 miles? Heavy new supply typically softens prices + rents 12–24 months out; constrained supply supports both.
Investment metrics
- 1% rule
- 1.72% ✓
- Cap rate
- 13.48%
- Cash-on-cash
- 25.66%
- DSCR
- 2.14
- GRM
- 4.9
CMA / ARV
- ARV (median comp)
- $109,368
- List price
- $80,000
- Delta
- -26.85%
- Verdict
- UNDERPRICED
- Comps
- 20 within 1.0 mi
Show comp detail 7 sales within ~0.75 mi
| Address | Dist | Beds/Ba | Sqft | Sold | Price | $/sf | Match |
|---|---|---|---|---|---|---|---|
| 1393 Carman St | 0.17mi | 4/2.0 (+1) | 1,776 (-12%) | 6mo | $162,000 | $91 | 61 |
| 4117 Brunswick Ave | 0.66mi | 3/2.5 | 1,808 (-10%) | 0mo | $58,000 | $32 | 48 |
| 912 Huron St | 0.64mi | 3/2.0 | 1,739 (-14%) | 0mo | $33,000 | $19 | 45 |
| 3914 Red Arrow Rd | 0.65mi | 4/2.0 (+1) | 1,785 (-12%) | 1mo | $128,000 | $72 | 43 |
| 726 Huron St | 0.46mi | 3/1.5 | 1,750 (-13%) | 17mo | $60,000 | $34 | 42 |
| 1040 Ronald St | 0.73mi | 4/2.0 (+1) | 2,261 (+12%) | 11mo | $175,000 | $77 | 29 |
| 4110 Red Arrow Rd | 0.65mi | 2/1.0 (-1) | 1,756 (-13%) | 20mo | $62,000 | $35 | 25 |
Match score weights: distance 35% · size 25% · config 20% · recency 20%. Top-matched comps best support the ARV.
Projected returns pro-forma
-3.0% appreciation · 3.0% rent growth · sell at horizon
- IRR
- 19.3%
- Equity multiple
- 1.79×
- Total profit
- $17,592
- Equity at exit
- $11,928
- IRR
- 27.7%
- Equity multiple
- 3.45×
- Total profit
- $54,814
- Equity at exit
- $6,917
Cash invested: $22,400 (down + closing). Projections, not guarantees.
Landlord ↔ Tenant lean methodology
- Overall (STATE)
- 62 Landlord-Friendly
- State Michigan
- 62 Landlord-Friendly · EVEN
- County
- — inherits STATE
- City
- — inherits STATE
ZIP-level market 48529
- Home prices YoY
- -26.5%
- Active inventory
- 54
- Price-to-rent
- 4.9×
Monthly cashflow live
- Estimated rent
- $1,374 medium interval (Pro) →
- Mortgage (P&I)
- −$420
- Tax from tax record
- −$154 /mo · $1,844/yr
- Insurance
- −$33
- HOA
- −$0
- Vacancy / Maint / Mgmt
- −$289
- Net cashflow
- $479
Break-even live
Sensitivity live
| Price | -10% $524 | -5% $502 | +0% $479 | +5% $456 | +10% $434 |
|---|---|---|---|---|---|
| Rent | -10% $370 | -5% $425 | +0% $479 | +5% $533 | +10% $587 |
| Rate | -1.0pp $519 | -0.5pp $499 | base $479 | +0.5pp $458 | +1.0pp $437 |
UW: 25.0% down · 7.5% · 30yr · 1.5% tax · 5.0% vac · 8.0% maint · 8.0% mgmt
Financing live
Cash to close
- Down payment
- $20,000
- Closing costs
- $2,400
- Reserves months
- —
- Total cash needed
- —
Loan-product check · same deal, 3 products live
Conventional
25% down · 7.5% · 30yr
- Down + closing
- —
- Monthly P&I
- —
- Monthly cashflow
- —
- DSCR
- —
- Eligible?
- —
Personal DTI + credit; lowest rate.
DSCR
20% down · 8.5% · 30yr
- Down + closing
- —
- Monthly P&I
- —
- Monthly cashflow
- —
- DSCR
- —
- Eligible?
- —
No personal income docs; deal must DSCR.
Hard money
10% down · 12.0% · 12mo
- Down + closing
- —
- Monthly P&I
- —
- Monthly cashflow
- —
- DSCR
- —
- Eligible?
- —
Short-term bridge; refi at stabilization.
Rent comps 2 comps
| Address | Beds | Baths | Sqft | Rent | $/sqft | DOM | Units | Dist |
|---|---|---|---|---|---|---|---|---|
| 4070 Greenbriar Blvd Burton, MI | 3.0–4.0 | 2.0 | 1512 | $1,399 | $0.93 | 15d | 1 | 1.06mi |
| 3908 Cherokee Ave Flint, MI | 4.0 | 2.5 | 1824 | $1,350 | $0.74 | 15d | 1 | 1.23mi |
Listing history 16 events
-
2026-05-13status Pending 177-char remark
Show marketing remark (177 chars)
GREAT OPPORTUNITY ON THIS 3 BEDROOM RANCH. HOME FEATURES A FULL FINISHED BASEMENT, 1 1/2 BATHS DEEP LOT AND AN OPEN FLOOR PLAN. IMMEDIATE OCCUPANCY! HURRY, THIS WON'T LAST LONG.
-
2026-05-13status Pending 177-char remark
Show marketing remark (177 chars)
GREAT OPPORTUNITY ON THIS 3 BEDROOM RANCH. HOME FEATURES A FULL FINISHED BASEMENT, 1 1/2 BATHS DEEP LOT AND AN OPEN FLOOR PLAN. IMMEDIATE OCCUPANCY! HURRY, THIS WON'T LAST LONG.
-
2026-05-06$80,000 Active 177-char remark
Show marketing remark (177 chars)
GREAT OPPORTUNITY ON THIS 3 BEDROOM RANCH. HOME FEATURES A FULL FINISHED BASEMENT, 1 1/2 BATHS DEEP LOT AND AN OPEN FLOOR PLAN. IMMEDIATE OCCUPANCY! HURRY, THIS WON'T LAST LONG.
-
2026-05-06$80,000 Active 177-char remark
Show marketing remark (177 chars)
GREAT OPPORTUNITY ON THIS 3 BEDROOM RANCH. HOME FEATURES A FULL FINISHED BASEMENT, 1 1/2 BATHS DEEP LOT AND AN OPEN FLOOR PLAN. IMMEDIATE OCCUPANCY! HURRY, THIS WON'T LAST LONG.
-
2017-07-20soldstatus $44,900
-
2017-07-11soldstatus $44,900 Sold
Show marketing remark (105 chars)
Move in this freshly painted Home. New carpet! 3 bedrooms 1 1/2 baths. Full basement. Large storage shed.
-
2017-06-14status Pending
Show marketing remark (105 chars)
Move in this freshly painted Home. New carpet! 3 bedrooms 1 1/2 baths. Full basement. Large storage shed.
-
2017-06-14status Pending
Show marketing remark (105 chars)
Move in this freshly painted Home. New carpet! 3 bedrooms 1 1/2 baths. Full basement. Large storage shed.
-
2017-06-08historical Keep Showing-Contgcy Appl
-
2017-05-31$44,900 Active
Show marketing remark (105 chars)
Move in this freshly painted Home. New carpet! 3 bedrooms 1 1/2 baths. Full basement. Large storage shed.
-
2017-05-31$44,900 Active
Show marketing remark (105 chars)
Move in this freshly painted Home. New carpet! 3 bedrooms 1 1/2 baths. Full basement. Large storage shed.
-
2003-08-26soldstatus $37,050
-
1996-12-30soldstatus $55,000
-
1996-12-30soldstatus $55,000
-
1996-09-06$52,900
-
1996-09-06$52,900
ⓘ Source: listings_history table (triggers on properties + properties_extension) + one-shot
backfill from property_details.listing_events for pre-trigger history.
Tax reassessment forecast MI · Partial reset (capped growth)
- Current annual tax
- $1,844 · $154/mo
- Projected year-2 tax
- $1,844 · $154/mo
- Expected delta
- $0/yr ($0/mo · 0.0%)
ⓘ Screening estimate from a state-policy table — verify with the county assessor before closing.
Climate risk First Street
- Flood 1/10 Low FEMA zone X (unshaded) · 0% chance over 30 yrs
- Wildfire 1/10 Low
- Heat 2/10 Low 7 d/yr ≥96°F today · 15 d/yr by 30 yrs out
- Wind 2/10 Low
- Air quality 3/10 Moderate 3 unhealthy d/yr today · 4 by 30 yrs out
Nearby sold comps map
Loading sold comps map…
Walkable amenities ~0.75 mi
Loading nearby amenities…
Taxation est. · year 1
- Rental income
- $16,488
- − Mortgage interest
- −$4,481
- − Property taxes
- −$1,844
- − Insurance
- −$400
- − Repairs & maintenance
- −$1,319
- − Management
- −$1,319
- − Depreciation
- −$2,327
- Taxable income
- $4,797
- Est. tax owed @ 24.0%
- −$1,151
- After-tax cash flow
- $4,596/yr
For passive investors: Depreciation is non-cash, so a rental often shows a tax loss while cash-flowing — sheltering income. Rental losses are passive: they offset passive income freely, and up to $25,000/yr can offset ordinary (W-2) income if you actively participate and your MAGI is under $100k (phasing out to $0 by $150k); unused losses carry forward. On sale, claimed depreciation is recaptured at up to 25%, and gains may owe capital-gains tax (a 1031 exchange can defer both). Figures are a year-1 estimate at your 24.0% rate — not tax advice; consult a CPA.
Schools (NCES district)
- District
- Bendle Public Schools
- NCES district ID
- 2604740
- Math proficiency
- 6% ▼ -7.00%
- Reading proficiency
- 29% ▼ -1.00%
- Median HH income
- $35,492
- Composite
- 14.36/100
- National rank
- #9438
- State rank
- #487 of 540 in MI
Livability — Burton
- Score
- 61/100
- State rank
- #555
- US rank
- #17380
Category grades
Schools grade is shown separately in the Schools card above.
Census & demographics
- Census place
- Burton, MI
- City population
- 26,014
- Population (ZIP)
- 8,959
Population outlook (Genesee County) Hauer SSP2
- Today (2025)
- 381,312 people
- By 2030
- 362,731 · -4.9%
- By 2040
- 321,550 · -15.7%
- By 2050
- 279,212 · -26.8%
- By 2075
- 193,336 · -49.3%
- By 2100
- 128,118 · -66.4%
Race, ethnicity, and origin ACS 2023
- Neighborhood character
- Predominantly White (82%)
- Race & ethnicity
- White 82% Black 9% Hispanic / Latino 6% Two or more races 4%
- Hispanic origin (detail)
- Mexican 6%
- Common ancestry
- Romanian 6% Lithuanian 4% Slovak 4%
- Foreign-born
- 1% · Canada
- Languages at home
- 99% English-only · Spanish 1%
Political lean MEDSL · Genesee
- 2024 margin
- Toss-up / Even · D 51.4% · R 47.2% · Other 1.4%
- 2008→2024 swing
- -28.3pp toward R · 2008: 32.5pp · 2024: 4.2pp
- All cycles
- 2024: D+4.2 2020: D+9.3 2016: D+9.5 2012: D+28.2 2008: D+32.5
Not yet ingested
- Civics
- —
Market trends
- HPI YoY
- ▼ -82.30%
- Current HPI
- 228.5338
- Rent YoY
- —
- Metro
- —
- State GDP YoY
- ▲ 1.37%
- F500 in state
- 28
Industry mix (Fortune 500 HQ in MI)
| Industry | F500 HQs | Revenue |
|---|---|---|
| Automotive Parts | 3 | $48B |
|
||
| Automotive | 2 | $372B |
|
||
| Chemicals | 1 | $45B |
|
||
| Automotive Retail | 1 | $29B |
|
||
| Healthcare / Medical Devices | 1 | $23B |
|
||
| Automotive Technology | 1 | $20B |
|
||
Price history
+51.2% since first listed16 events — show timeline
- 2026-05-13 Pending — MiRealSource-MiMLS
- 2026-05-13 Pending — REALCOMP
- 2026-05-06 Listed $80,000 REALCOMP
- 2026-05-06 Listed $80,000 MiRealSource-MiMLS
- 2017-07-20 Sold (Public Records) $44,900 Public Records
- 2017-07-11 Sold (MLS) $44,900 REALCOMP
- 2017-06-14 Pending — MiRealSource-MiMLS
- 2017-06-14 Pending — REALCOMP
- 2017-06-08 Contingent — MiRealSource-MiMLS
- 2017-05-31 Listed $44,900 MiRealSource-MiMLS
- 2017-05-31 Listed $44,900 REALCOMP
- 2003-08-26 Sold (Public Records) $37,050 Public Records
- 1996-12-30 Sold (MLS) $55,000 REALCOMP
- 1996-12-30 Sold (MLS) $55,000 MiRealSource-MiMLS
- 1996-09-06 Listed $52,900 REALCOMP
- 1996-09-06 Listed $52,900 MiRealSource-MiMLS
Property tax history
+4.5%/yrLatest (2025): $1,844 · +2.2% YoY. Source: county tax records.
Cash-flow waterfall
monthlySold comps — $/sqft
last 12 mo · ≤1 miLoading sold comps…