 Triplex
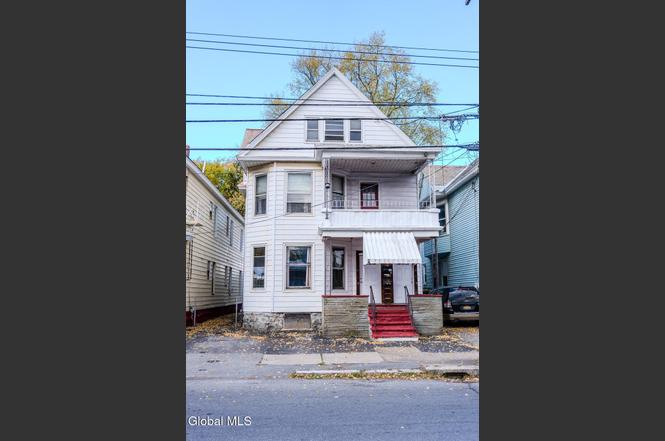
57 N Brandywine Ave · Schenectady, NY
Flood risk 1/10 · Minimal
- FEMA flood zone
- X (unshaded)
- Chance of flooding over 30 yrs
- 0.0%
- Est. flood insurance / yr
- $473 – $860
Fire risk 1/10 · Minimal
- Est. fire insurance / yr
- $691 – $1,283
Heat risk 4/10 · Minor
- Hot days now (above 95°F)
- 7 days/yr
- Hot days in 30 yrs
- 16 days/yr
Wind risk 2/10 · Minimal
- Chance of severe wind over 30 yrs
- 4.0%
Air-quality risk 1/10 · Minimal
- Unhealthy air days now
- 0 days/yr
- Unhealthy air days in 30 yrs
- 0 days/yr
Risk factors via First Street. Map © Google.
Why this score? — see what drove the B grade
The composite is a weighted blend of 9 inputs, each scored 0–100. Each bar is that input's sub-score; the figure is the points it added to the 100-point composite (weight × sub-score).
- Cash flow +26.5/30.0
- Appreciation +10.0/10.0
- DSCR +9.0/10.0
- 1% rule +7.9/10.0
- ARV discount +4.8/15.0
- Livability +3.9/5.0
- Schools +3.0/10.0
- Rent growth +2.5/5.0
- Condition / age +2.5/5.0
$350,000
🖨 Deal sheet 📄 Offer letter ✓ Due diligence
Multi-family units
County records classify this as Multi-Family (2-4 Unit). Listing-text estimate: 3 units. confirmed
Listing remarks MLS
Wonderful three family with unique 2 floor owners unit with 5 br's which is great for large family. Lower units in nice shape with updated baths, Nice rear yard. I wonderful opportunity -- Very Good Condition
Key facts
- Finished attic
- Spacious backyard
- Front parking space
Tags
Neighborhood map
What this means for you Summary
Snapshot
- This is a 3 × 3-bed/1.0-bath units multifamily listed at $350k.
Deal economics
- At list price, monthly cash flow is $920 ($11k/yr) — positive. Per door: $307/mo.
- The deal already cash-flows at list — no discount required.
- Meets the 1% rule at list price ($5k rent vs $350k).
- Recommended offer: $308k (12.0% below list) — sets the bar for market timing.
Location & tenants
- Location reads 78/100 on livability (#167 in NY, #2,597 nationally) — a middle-class / working-renter tenant base. Strengths: commute A+, health & safety A+, cost of living A; Watch: employment D+, crime F.
- Schenectady City School District (urban): math 38% / reading 34% proficiency, ranked #556 of 590 in NY (top 94%) — families likely to look elsewhere, expect single-tenant / working-renter base with shorter leases; 65% free/reduced lunch — lower-income household profile, screen leases tightly.
- Zoned schools: Schenectady High School (math 75% / reading 90%, grade A, #446 of 1,100 statewide, top 41%, 2,743 students, 71% FRL).
- Zoned-school proficiency averages 82% at this address vs 36% district-wide (+46 pts) — the actual schools serving this property are materially stronger than the Schenectady City School District average implies; a family-tenant draw the district grade alone would hide.
- Market conditions: 33 active listings in the ZIP; 154 units permitted in Schenectady County in 2024 (54 in 5+ unit buildings).
Forward outlook
- In year one you build about $37k of equity ($2k loan paydown + $35k appreciation (10.0% local appreciation)).
- Schenectady County population projected to shrink 4% by 2050 — rents likely to lag national; underwrite the cash flow, not the appreciation.
- At projected returns (10.0% appreciation + 3.0% rent growth), your $98k cash investment doubles in ~2 years — after that, you're playing with house money.
- By year 2, paydown + projected appreciation supports a ~$60k cash-out refi (75% LTV) — recoverable capital for the next deal without selling this one.
Negotiation context
- It's been on market 166 days — a 12% lower offer ($308k) is reasonable based on typical stale-listing flexibility.
- 4 sale attempts since 29y ago; this cycle's ask has dropped $110k (24%) from the opening price — seller is motivated, your offer sets the floor, not the list.
- Current owner paid $40k; list at $350k implies a 775% gain — meaningful room to come down on a strong offer.
Risks & watch-outs
- Watch-outs: built in 1902 — expect roof / HVAC / electrical / plumbing capex.
Questions for the listing agent
- It's been on market 166 days. Have you received any prior offers? Is the seller open to a 12% concession, seller financing, or rate buy-down credit?
- Can we see the unit-by-unit rent roll, current vacancy, and any below-market leases? What's the average tenancy length?
- What capital expenditures (roof, boiler, parking lot, exteriors) have been made in the last 5 years, and what's planned in the next 2?
- Built in 1902 — when were the roof, HVAC, electrical panel, plumbing, and water heater last replaced?
- Why hasn't it sold? Are there any deal-killer items the seller is aware of (foundation, flood, title, zoning, code violations)?
- Is there a deadline driving the sale (1031 exchange, divorce, estate, relocation)? That informs how much negotiation room exists.
- Crime grade is F in this area — have there been break-ins, vandalism, or insurance claims at this property in the last 3 years? What carrier currently insures it and at what premium?
- What's the average days-on-market for RENTAL listings here right now (not sales)? A rising rental-DOM trend means longer vacancies and softer asking-rent achievability than the comps imply.
- What's the recent tenant-quality profile in this submarket — average credit score on applications, eviction rate, late-payment / NSF rate, and stable-employment percentage? A property-management company in the area should have these aggregated.
- How much new apartment / multifamily construction is in the pipeline within 1–3 miles? Heavy new supply (>2% of stock underway) typically softens rents 12–24 months out; light construction supports rent growth.
Investment metrics
- 1% rule
- 1.29% ✓
- Cap rate
- 9.45%
- Cash-on-cash
- 11.27%
- DSCR
- 1.50
- GRM
- 6.5
CMA / ARV
- ARV (on-the-fly)
- $330,270
- Comps found
- 8
Show comp detail 8 sales within ~0.75 mi
| Address | Dist | Beds/Ba | Sqft | Sold | Price | $/sf | Match |
|---|---|---|---|---|---|---|---|
| 415 Victory Ave | 0.47mi | 7/3.0 (+1) | 3,144 (-4%) | 13mo | $300,000 | $95 | 56 |
| 143 Elmer Ave | 0.40mi | 6/3.0 | 3,413 (+4%) | 23mo | $250,000 | $73 | 55 |
| 920 Mcclellan St | 0.73mi | 7/5.0 (+1) | 3,368 (+3%) | 0mo | $455,400 | $135 | 48 |
| 959 Wendell Ave | 0.65mi | 6/3.0 | 3,000 (-8%) | 15mo | $355,000 | $118 | 43 |
| 953 Wendell Ave | 0.64mi | 6/3.5 | 3,000 (-8%) | 15mo | $355,000 | $118 | 42 |
| 811 Grant Ave | 0.73mi | 6/3.0 | 3,088 (-6%) | 22mo | $270,000 | $87 | 38 |
| 960 Wendell Ave | 0.64mi | 6/2.0 | 2,988 (-9%) | 22mo | $303,000 | $101 | 33 |
| 1236 Union St | 0.63mi | 5/2.0 (-1) | 3,760 (+15%) | 17mo | $301,000 | $80 | 22 |
Match score weights: distance 35% · size 25% · config 20% · recency 20%. Top-matched comps best support the ARV.
Projected returns pro-forma
10.0% appreciation · 3.0% rent growth · sell at horizon
- IRR
- 32.6%
- Equity multiple
- 3.55×
- Total profit
- $249,449
- Equity at exit
- $315,308
- IRR
- 28.1%
- Equity multiple
- 8.03×
- Total profit
- $688,897
- Equity at exit
- $679,973
Cash invested: $98,000 (down + closing). Projections, not guarantees.
Landlord ↔ Tenant lean methodology
- Overall (STATE)
- 15 Strongly Tenant-Friendly
- State New York
- 15 Strongly Tenant-Friendly · D+10
- County
- — inherits STATE
- City
- — inherits STATE
ZIP-level market 12307
- Home prices YoY
- 3.3%
- Active inventory
- 33
- Price-to-rent
- 19.4×
Monthly cashflow live
- Estimated rent
- $4,512 high interval (Pro) →
- Mortgage (P&I)
- −$1,835
- Tax from tax record
- −$663 /mo · $7,953/yr
- Insurance
- −$146
- HOA
- −$0
- Vacancy / Maint / Mgmt
- −$948
- Net cashflow
- $920
Break-even live
3-unit breakdown (identical units grouped — click to expand)
| Units | Beds | Baths | Est. rent |
|---|---|---|---|
| 3× units | 3 | 1 | $4,512 |
| #1 | 3 | 1 | $1,504 |
| #2 | 3 | 1 | $1,504 |
| #3 | 3 | 1 | $1,504 |
| Total (3 units) | $4,512 | ||
UW: 25.0% down · 7.5% · 30yr · 1.5% tax · 5.0% vac · 8.0% maint · 8.0% mgmt
Financing live
Cash to close
- Down payment
- $87,500
- Closing costs
- $10,500
- Reserves months
- —
- Total cash needed
- —
Loan-product check · same deal, 3 products live
Conventional
25% down · 7.5% · 30yr
- Down + closing
- —
- Monthly P&I
- —
- Monthly cashflow
- —
- DSCR
- —
- Eligible?
- —
Personal DTI + credit; lowest rate.
DSCR
20% down · 8.5% · 30yr
- Down + closing
- —
- Monthly P&I
- —
- Monthly cashflow
- —
- DSCR
- —
- Eligible?
- —
No personal income docs; deal must DSCR.
Hard money
10% down · 12.0% · 12mo
- Down + closing
- —
- Monthly P&I
- —
- Monthly cashflow
- —
- DSCR
- —
- Eligible?
- —
Short-term bridge; refi at stabilization.
Listing history 23 events
-
2026-04-13status Pending
-
2026-01-22price $350,000
-
2025-12-03price $369,900
-
2025-11-14price $399,900
-
2025-10-27$459,900 Active
-
2016-06-14historical 210-char remark
Show marketing remark (210 chars)
Wonderful three family with unique 2 floor owners unit with 5 br's which is great for large family. Lower units in nice shape with updated baths, Nice rear yard. I wonderful opportunity -- Very Good Condition
-
2016-06-12soldstatus $40,000 Closed (Final Sale) 210-char remark
Show marketing remark (210 chars)
Wonderful three family with unique 2 floor owners unit with 5 br's which is great for large family. Lower units in nice shape with updated baths, Nice rear yard. I wonderful opportunity -- Very Good Condition
-
2016-04-27status Pend (Under Cntr) 210-char remark
Show marketing remark (210 chars)
Wonderful three family with unique 2 floor owners unit with 5 br's which is great for large family. Lower units in nice shape with updated baths, Nice rear yard. I wonderful opportunity -- Very Good Condition
-
2016-04-04price $40,000 210-char remark
Show marketing remark (210 chars)
Wonderful three family with unique 2 floor owners unit with 5 br's which is great for large family. Lower units in nice shape with updated baths, Nice rear yard. I wonderful opportunity -- Very Good Condition
-
2016-02-24price $54,900 210-char remark
Show marketing remark (210 chars)
Wonderful three family with unique 2 floor owners unit with 5 br's which is great for large family. Lower units in nice shape with updated baths, Nice rear yard. I wonderful opportunity -- Very Good Condition
-
2016-01-26price $59,900 210-char remark
Show marketing remark (210 chars)
Wonderful three family with unique 2 floor owners unit with 5 br's which is great for large family. Lower units in nice shape with updated baths, Nice rear yard. I wonderful opportunity -- Very Good Condition
-
2015-12-29$65,900 New 210-char remark
Show marketing remark (210 chars)
Wonderful three family with unique 2 floor owners unit with 5 br's which is great for large family. Lower units in nice shape with updated baths, Nice rear yard. I wonderful opportunity -- Very Good Condition
-
2007-10-11soldstatus $128,000
-
2007-10-11soldstatus $128,000
-
2007-10-10soldstatus $99,000 49-char remark
Show marketing remark (49 chars)
Call office for more details. Very Good Condition
-
2007-06-29soldstatus $63,200
-
2007-03-15historical 49-char remark
Show marketing remark (49 chars)
Call office for more details. Very Good Condition
-
2006-07-26$99,900 49-char remark
Show marketing remark (49 chars)
Call office for more details. Very Good Condition
-
2003-11-18soldstatus $32,000
-
2002-03-13soldstatus $21,516
-
2001-08-23soldstatus $30,000
-
1997-09-12$32,900
-
1995-12-11soldstatus $41,000
ⓘ Source: listings_history table (triggers on properties + properties_extension) + one-shot
backfill from property_details.listing_events for pre-trigger history.
Tax reassessment forecast NY · Partial reset (capped growth)
- Current annual tax
- $7,953 · $663/mo
- Projected year-2 tax
- $7,953 · $663/mo
- Expected delta
- $0/yr ($0/mo · 0.0%)
ⓘ Screening estimate from a state-policy table — verify with the county assessor before closing.
Climate risk First Street
- Flood 1/10 Low FEMA zone X (unshaded) · 0% chance over 30 yrs
- Wildfire 1/10 Low
- Heat 4/10 Moderate 7 d/yr ≥95°F today · 16 d/yr by 30 yrs out
- Wind 2/10 Low 4% chance of damaging wind over 30 yrs
- Air quality 1/10 Low 0 unhealthy d/yr today · 0 by 30 yrs out
Nearby sold comps map
Loading sold comps map…
Walkable amenities ~0.75 mi
Loading nearby amenities…
Taxation est. · year 1
- Rental income
- $54,144
- − Mortgage interest
- −$19,605
- − Property taxes
- −$7,953
- − Insurance
- −$1,750
- − Repairs & maintenance
- −$4,332
- − Management
- −$4,332
- − Depreciation
- −$10,182
- Taxable income
- $5,991
- Est. tax owed @ 24.0%
- −$1,438
- After-tax cash flow
- $9,608/yr
For passive investors: Depreciation is non-cash, so a rental often shows a tax loss while cash-flowing — sheltering income. Rental losses are passive: they offset passive income freely, and up to $25,000/yr can offset ordinary (W-2) income if you actively participate and your MAGI is under $100k (phasing out to $0 by $150k); unused losses carry forward. On sale, claimed depreciation is recaptured at up to 25%, and gains may owe capital-gains tax (a 1031 exchange can defer both). Figures are a year-1 estimate at your 24.0% rate — not tax advice; consult a CPA.
Schools (NCES district)
- District
- Schenectady City School District
- NCES district ID
- 3626010
- Math proficiency
- 38% ▲ 12.00%
- Reading proficiency
- 34% ▲ 2.00%
- Median HH income
- $39,453
- Composite
- 30.2/100
- National rank
- #6309
- State rank
- #556 of 590 in NY
Livability — Schenectady
- Score
- 78/100
- State rank
- #167
- US rank
- #2597
Category grades
Schools grade is shown separately in the Schools card above.
Census & demographics
- Census place
- Schenectady, NY
- City population
- 141,369
- Population (ZIP)
- 7,977
Population outlook (Schenectady County) Hauer SSP2
- Today (2025)
- 155,046 people
- By 2030
- 154,322 · -0.5%
- By 2040
- 151,796 · -2.1%
- By 2050
- 148,621 · -4.1%
- By 2075
- 141,229 · -8.9%
- By 2100
- 126,014 · -18.7%
Race, ethnicity, and origin ACS 2023
- Neighborhood character
- Highly diverse neighborhood (Simpson 0.81)
- Race & ethnicity
- Black 28% Hispanic / Latino 25% White 19% Two or more races 16% Asian 11% Native American 3%
- Hispanic origin (detail)
- Mexican 5% Puerto Rican 14% Dominican 3%
- Common ancestry
- Lithuanian 3% Ukrainian 3% Romanian 1%
- Foreign-born
- 32% · Canada, Jamaica, South Korea
- Languages at home
- 79% English-only · Spanish 12% Arabic 2% Other Asian/Pacific 1%
Political lean MEDSL · Schenectady
- 2024 margin
- D (+10.8) · D 55.4% · R 44.6%
- 2008→2024 swing
- -1.8pp toward R · 2008: 12.7pp · 2024: 10.8pp
- All cycles
- 2024: D+10.8 2020: D+15.7 2016: D+5.8 2012: D+15.4 2008: D+12.7
Not yet ingested
- Civics
- —
Market trends
- HPI YoY
- ▲ 12.60%
- Current HPI
- 398.0252
- Rent YoY
- —
- Metro
- —
- State GDP YoY
- ▲ 2.60%
- F500 in state
- 92
Industry mix (Fortune 500 HQ in NY)
| Industry | F500 HQs | Revenue |
|---|---|---|
| Financial Services | 10 | $950B |
|
||
| Consumer Goods | 9 | $162B |
|
||
| Insurance | 4 | $225B |
|
||
| Telecommunications | 2 | $144B |
|
||
| Pharmaceuticals | 2 | $112B |
|
||
| Media / Entertainment | 2 | $69B |
|
||
Price history
+753.7% since first listed23 events — show timeline
- 2026-04-13 Pending — Global MLS
- 2026-01-22 Price Changed $350,000 Global MLS
- 2025-12-03 Price Changed $369,900 Global MLS
- 2025-11-14 Price Changed $399,900 Global MLS
- 2025-10-27 Listed $459,900 Global MLS
- 2016-06-14 Listing Removed — Global MLS
- 2016-06-12 Sold (MLS) $40,000 Global MLS
- 2016-04-27 Pending — Global MLS
- 2016-04-04 Price Changed $40,000 Global MLS
- 2016-02-24 Price Changed $54,900 Global MLS
- 2016-01-26 Price Changed $59,900 Global MLS
- 2015-12-29 Listed $65,900 Global MLS
- 2007-10-11 Sold (Public Records) $128,000 Public Records
- 2007-10-11 Sold (Public Records) $128,000 Public Records
- 2007-10-10 Sold (MLS) $99,000 Global MLS
- 2007-06-29 Sold (Public Records) $63,200 Public Records
- 2007-03-15 Listing Removed — Global MLS
- 2006-07-26 Listed $99,900 Global MLS
- 2003-11-18 Sold (MLS) $32,000 Global MLS
- 2002-03-13 Sold (Public Records) $21,516 Public Records
- 2001-08-23 Sold (Public Records) $30,000 Public Records
- 1997-09-12 Listed $32,900 Global MLS
- 1995-12-11 Sold (Public Records) $41,000 Public Records
Property tax history
+0.5%/yrLatest (2025): $7,953 · +3.7% YoY. Source: county tax records.
Cash-flow waterfall
monthlySold comps — $/sqft
last 12 mo · ≤1 miLoading sold comps…