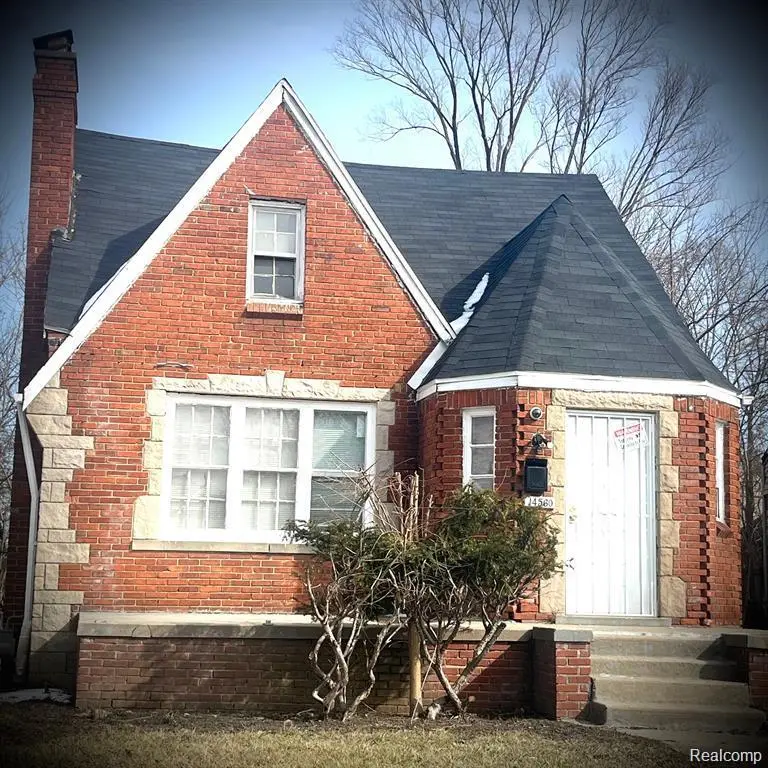
14560 Santa Rosa Dr · Detroit, MI
Flood risk 3/10 · Minor
- FEMA flood zone
- X (unshaded)
- Chance of flooding over 30 yrs
- 0.2%
- Est. flood insurance / yr
- $473 – $860
Fire risk 1/10 · Minimal
- Est. fire insurance / yr
- $784 – $1,456
Heat risk 3/10 · Minor
- Hot days now (above 97°F)
- 7 days/yr
- Hot days in 30 yrs
- 15 days/yr
Wind risk 2/10 · Minimal
- Chance of severe wind over 30 yrs
- —
Air-quality risk 4/10 · Minor
- Unhealthy air days now
- 4 days/yr
- Unhealthy air days in 30 yrs
- 6 days/yr
Risk factors via First Street. Map © Google.
Why this score? — see what drove the C+ grade
The composite is a weighted blend of 9 inputs, each scored 0–100. Each bar is that input's sub-score; the figure is the points it added to the 100-point composite (weight × sub-score).
- Cash flow +30.0/30.0
- 1% rule +10.0/10.0
- DSCR +10.0/10.0
- Rent growth +4.0/5.0
- Livability +3.7/5.0
- Condition / age +2.5/5.0
- Schools +1.3/10.0
- ARV discount +0.0/15.0
- Appreciation +0.0/10.0
$79,458
🖨 Deal sheet 📄 Offer letter ✓ Due diligence
Listing remarks MLS
TENANT OCCUPIED BRICK BUNGALOW HOME LOCATED SOUTH OF FENKELL AND WEST OF LIVERNOIS. THIS HOME FEATURES A SPACIOUS LIVING ROOM, FORMAL DINING ROOM, KITCHEN, TWO GOOD SIZED BEDROOMS AND FULL BATHROOM ON THE MAIN FLOOR, SPRAWLING PRIMARY BEDROOM UPSTAIRS, AND AN UNFINISHED BASEMENT. TENANT RENT IS 1100 PER MONTH. PROPERTY IS SOLD AS-IS. ALL DIMENSIONS ARE ESTIMATED AND SHOULD BE VERIFIED. ALL SHOWINGS REQUIRE A LICENSED AGENT TO BE PRESENT. BUYER TO PAY DETROIT INVESTMENT CO A 295 PROCESSING FEE AT CLOSING. PHOTOS ARE FROM BEFORE THE TENANT MOVED IN, IN 2023.
Key facts
- 4,356 sq ft lot
- Built 1938
- Listed 185 days
Neighborhood map
What this means for you Summary
Snapshot
- This is a 3-bed/1.0-bath single-family listed at $79k.
Deal economics
- At list price, monthly cash flow is $397 ($5k/yr) — positive.
- The deal already cash-flows at list — no discount required.
- Meets the 1% rule at list price ($1k rent vs $79k).
- Recommended offer: $70k (12.0% below list) — sets the bar for market timing.
- Cap rate 12.3% vs local median 10.2% in Detroit — meaningfully above typical; check what's discounted (condition, days-on-market, listing class) to confirm the premium yield is real.
Location & tenants
- Location reads 73/100 on livability (#218 in MI) — a middle-class / working-renter tenant base. Strengths: amenities A+, commute A+, cost of living A+; Watch: schools F, crime F, employment F.
- Detroit Public Schools Community District (urban): math 10% / reading 24% proficiency, ranked #499 of 540 in MI (top 92%) — low school quality limits family demand, transient renter base, plan for 1-2y turnover; 90% free/reduced lunch — lower-income household profile, screen leases tightly.
- Market conditions: Rents rising fast (+6.1%/yr); 346 active listings in the ZIP; 40 comparable units currently listed for rent nearby; rentals at typical pace (median 20d on market — plan ~3-4 weeks tenant-placement turnaround); lower-income renter base — watch delinquency; 2,639 units permitted in Wayne County in 2024 (1,216 in 5+ unit buildings).
- This rent runs 44% of the median local income ($33k/yr) — at the standard rent-burdened threshold; future hikes will face affordability resistance.
Forward outlook
- Local home prices are declining (-3.0%/yr); year-one equity from $550 of loan paydown is wiped out by about $2k of value loss. Plan a longer hold.
- Wayne County population projected at -17% by 2050 — secular population decline; favor cash flow + early exit over multi-decade hold.
- At projected returns (-3.0% appreciation + 6.1% rent growth), your $22k cash investment doubles in ~5 years — after that, you're playing with house money.
Negotiation context
- It's been on market 185 days — a 12% lower offer ($70k) is reasonable based on typical stale-listing flexibility.
- 4 sale attempts since 23y ago; this cycle's ask has dropped $10k (11%) from the opening price — seller is motivated, your offer sets the floor, not the list.
- Current owner paid $34k; list at $79k implies a 137% gain — meaningful room to come down on a strong offer.
Risks & watch-outs
- Watch-outs: built in 1938 — expect roof / HVAC / electrical / plumbing capex.
Questions for the listing agent
- It's been on market 185 days. Have you received any prior offers? Is the seller open to a 12% concession, seller financing, or rate buy-down credit?
- Built in 1938 — when were the roof, HVAC, electrical panel, plumbing, and water heater last replaced?
- Why hasn't it sold? Are there any deal-killer items the seller is aware of (foundation, flood, title, zoning, code violations)?
- Is there a deadline driving the sale (1031 exchange, divorce, estate, relocation)? That informs how much negotiation room exists.
- Schools are F-rated, which usually means shorter tenancies and higher turnover. Who's the typical renter profile here, and what's been the actual vacancy rate?
- Crime grade is F in this area — have there been break-ins, vandalism, or insurance claims at this property in the last 3 years? What carrier currently insures it and at what premium?
- What's the average days-on-market for RENTAL listings here right now (not sales)? A rising rental-DOM trend means longer vacancies and softer asking-rent achievability than the comps imply.
- What's the recent tenant-quality profile in this submarket — average credit score on applications, eviction rate, late-payment / NSF rate, and stable-employment percentage? A property-management company in the area should have these aggregated.
- How much new for-sale + rental construction is in the pipeline within 1–3 miles? Heavy new supply typically softens prices + rents 12–24 months out; constrained supply supports both.
Investment metrics
- 1% rule
- 1.54% ✓
- Cap rate
- 12.29%
- Cash-on-cash
- 21.42%
- DSCR
- 1.95
- GRM
- 5.4
CMA / ARV
- ARV (median comp)
- $61,542
- List price
- $79,458
- Delta
- 29.11%
- Verdict
- OVERPRICED
- Comps
- 20 within 1.0 mi
Show comp detail 12 sales within ~0.75 mi
| Address | Dist | Beds/Ba | Sqft | Sold | Price | $/sf | Match |
|---|---|---|---|---|---|---|---|
| 14629 Monica St | 0.11mi | 3/1.0 | 1,128 (-6%) | 4mo | $19,000 | $17 | 81 |
| 15021 Petoskey Ave | 0.34mi | 3/1.0 | 1,177 (-2%) | 1mo | $28,000 | $24 | 79 |
| 7447 Ellsworth St | 0.44mi | 3/1.0 | 1,160 (-4%) | 5mo | $35,500 | $31 | 69 |
| 14752 Petoskey Ave | 0.21mi | 3/1.5 | 1,029 (-14%) | 0mo | $40,000 | $39 | 64 |
| 14203 Cherrylawn St | 0.71mi | 3/2.0 | 1,250 (+4%) | 5mo | $58,000 | $46 | 52 |
| 13903 Cloverlawn Ave | 0.74mi | 3/1.5 | 1,265 (+5%) | 5mo | $140,000 | $111 | 51 |
| 15379 Woodingham Dr | 0.67mi | 4/1.0 (+1) | 1,300 (+8%) | 4mo | $7,000 | $5 | 47 |
| 14249 Cloverlawn St | 0.59mi | 3/1.0 | 1,035 (-14%) | 5mo | $69,000 | $67 | 45 |
| 14628 Ohio St | 0.68mi | 4/1.5 (+1) | 1,129 (-6%) | 9mo | $50,000 | $44 | 43 |
| 6433 Globe St | 0.71mi | 3/1.0 | 1,344 (+12%) | 7mo | $100,000 | $74 | 41 |
| 8240 Desoto St | 0.64mi | 4/1.0 (+1) | 1,368 (+14%) | 8mo | $59,500 | $43 | 35 |
| 8282 Desoto St | 0.68mi | 4/2.0 (+1) | 1,380 (+15%) | 7mo | $149,000 | $108 | 29 |
Match score weights: distance 35% · size 25% · config 20% · recency 20%. Top-matched comps best support the ARV.
Projected returns pro-forma
-3.0% appreciation · 6.14% rent growth · sell at horizon
- IRR
- 17.6%
- Equity multiple
- 1.74×
- Total profit
- $16,433
- Equity at exit
- $11,847
- IRR
- 28.2%
- Equity multiple
- 3.90×
- Total profit
- $64,458
- Equity at exit
- $6,870
Cash invested: $22,248 (down + closing). Projections, not guarantees.
Landlord ↔ Tenant lean methodology
- Overall (STATE)
- 62 Landlord-Friendly
- State Michigan
- 62 Landlord-Friendly · EVEN
- County
- — inherits STATE
- City
- — inherits STATE
ZIP-level market 48238
- Home prices YoY
- -14.4%
- Rents YoY
- 6.1%
- Active inventory
- 346
- Price-to-rent
- 5.4×
Monthly cashflow live
- Estimated rent
- $1,224 high interval (Pro) →
- Mortgage (P&I)
- −$417
- Tax from tax record
- −$120 /mo · $1,441/yr
- Insurance
- −$33
- HOA
- −$0
- Vacancy / Maint / Mgmt
- −$257
- Net cashflow
- $397
Break-even live
UW: 25.0% down · 7.5% · 30yr · 1.5% tax · 5.0% vac · 8.0% maint · 8.0% mgmt
Financing live
Cash to close
- Down payment
- $19,864
- Closing costs
- $2,384
- Reserves months
- —
- Total cash needed
- —
Loan-product check · same deal, 3 products live
Conventional
25% down · 7.5% · 30yr
- Down + closing
- —
- Monthly P&I
- —
- Monthly cashflow
- —
- DSCR
- —
- Eligible?
- —
Personal DTI + credit; lowest rate.
DSCR
20% down · 8.5% · 30yr
- Down + closing
- —
- Monthly P&I
- —
- Monthly cashflow
- —
- DSCR
- —
- Eligible?
- —
No personal income docs; deal must DSCR.
Hard money
10% down · 12.0% · 12mo
- Down + closing
- —
- Monthly P&I
- —
- Monthly cashflow
- —
- DSCR
- —
- Eligible?
- —
Short-term bridge; refi at stabilization.
Rent comps 40 comps
| Address | Beds | Baths | Sqft | Rent | $/sqft | DOM | Units | Dist |
|---|---|---|---|---|---|---|---|---|
| 2690 Ewald Cir Detroit, MI | 1.0–2.0 | 1.0 | 750 | $900 | $1.20 | 24d | 4 | 0.37mi |
| 14656 Roselawn St Detroit, MI | 3.0 | 1.0 | 1000 | $1,200 | $1.20 | 17d | 1 | 0.47mi |
| 4287 W Grand St Unit 4289 Detroit, MI | 3.0 | 1.0 | 1250 | $1,000 | $0.80 | 43d | 1 | 0.54mi |
| 3812 W Grand St Detroit, MI | 2.0 | 1.0 | 1100 | $1,025 | $0.93 | 16d | 1 | 0.54mi |
| 2034 Ewald Cir Detroit, MI | 2.0 | 1.0 | 1000 | $995 | $0.99 | 4d | 1 | 0.56mi |
| 14550 Northlawn St Detroit, MI | 3.0 | 2.0 | 950 | $1,200 | $1.26 | 16d | 1 | 0.56mi |
| 13620 Tuller St Detroit, MI | 4.0 | 1.0 | 1064 | $1,374 | $1.29 | 12d | 1 | 0.59mi |
| 2926 Ewald Cir Detroit, MI | 2.0 | 1.0 | 800 | $900 | $1.12 | 17d | 1 | 0.60mi |
| 4045 Clements St Detroit, MI | 3.0 | 1.0 | 850 | $1,150 | $1.35 | 43d | 1 | 0.61mi |
| 4045 Clements St Detroit, MI | 3.0 | 1.0 | 850 | $1,150 | $1.35 | 24d | 1 | 0.61mi |
| 14011 Roselawn St Detroit, MI | 4.0 | 1.5 | 1300 | $1,450 | $1.12 | 17d | 1 | 0.61mi |
| 14011 Roselawn St Detroit, MI | 4.0 | 1.5 | 1300 | $1,450 | $1.12 | 1d | 1 | 0.61mi |
| 14570 Cherrylawn St Detroit, MI | 3.0 | 1.0 | 840 | $1,250 | $1.49 | 12d | 1 | 0.62mi |
| Ohio St Unit 4 Detroit, MI | 4.0 | 1.5 | 1400 | $750 | $0.54 | 43d | 1 | 0.68mi |
| 14242 Ohio St Detroit, MI | 4.0 | 1.0 | 1400 | $1,000 | $0.71 | 43d | 1 | 0.71mi |
| 15345 Parkside St Detroit, MI | 3.0 | 1.0 | 1152 | $1,300 | $1.13 | 43d | 1 | 0.75mi |
| 3824 Tyler St Apt 1 Detroit, MI | 3.0 | 1.0 | 900 | $1,523 | $1.69 | 16d | 1 | 0.76mi |
| 13979 Cherrylawn St Detroit, MI | 3.0 | 1.0 | 1296 | $1,334 | $1.03 | 20d | 1 | 0.76mi |
| 7350 Globe St Detroit, MI | 3.0 | 1.0 | 1000 | $1,550 | $1.55 | 3d | 1 | 0.77mi |
| 4203 Tyler St Detroit, MI | 2.0 | 1.0 | 950 | $895 | $0.94 | 43d | 1 | 0.77mi |
| 3740 Tyler St Unit 1 Detroit, MI | 3.0 | 1.0 | 1300 | $1,300 | $1.00 | 4d | 1 | 0.78mi |
| 3783 Tyler St Unit Lower Detroit, MI | 3.0 | 1.0 | 1000 | $1,150 | $1.15 | 43d | 1 | 0.79mi |
| 4336 Buena Vista St Detroit, MI | 3.0 | 1.0 | 1300 | $1,100 | $0.85 | 43d | 1 | 0.79mi |
| 15457 Cloverlawn St Detroit, MI | 3.0 | 2.0 | 1500 | $1,275 | $0.85 | 24d | 1 | 0.84mi |
| 15771 Turner St Detroit, MI | 2.0 | 1.0 | 1000 | $1,049 | $1.05 | 43d | 1 | 0.85mi |
| 12663 Stoepel St Detroit, MI | 2.0 | 1.0 | 1100 | $1,050 | $0.95 | 21d | 1 | 0.96mi |
| 12663 Stoepel St Unit 1 Detroit, MI | 2.0 | 1.0 | 750 | $975 | $1.30 | 17d | 1 | 0.96mi |
| 13620 Kentucky St Detroit, MI | 3.0 | 1.0 | 1248 | $1,200 | $0.96 | 4d | 1 | 0.98mi |
| 12415 Monica St Detroit, MI | 2.0 | 1.0 | 1000 | $1,200 | $1.20 | 43d | 1 | 1.04mi |
| 2433 Pasadena St Unit 2435 Detroit, MI | 2.0 | 1.0 | 700 | $1,025 | $1.46 | 43d | 1 | 1.06mi |
| 15777 Wisconsin St Unit 77 Detroit, MI | 2.0 | 1.0 | 900 | $950 | $1.06 | 4d | 1 | 1.09mi |
| 15906 Alden St Detroit, MI | 3.0 | 1.0 | 1030 | $1,150 | $1.12 | 16d | 1 | 1.10mi |
| 12703 Northlawn St Detroit, MI | 2.0 | 1.0 | 1365 | $1,053 | $0.77 | 20d | 1 | 1.10mi |
| 4268 Cortland St Unit 1 Detroit, MI | 2.0 | 1.0 | 1000 | $1,050 | $1.05 | 43d | 1 | 1.10mi |
| 13639 La Salle Blvd Detroit, MI | 2.0 | 1.0 | 800 | $695 | $0.87 | 10d | 1 | 1.11mi |
| 16255 Lilac St Detroit, MI | 3.0 | 1.0 | 1312 | $1,394 | $1.06 | 17d | 1 | 1.14mi |
| 14881 Mendota St Detroit, MI | 3.0 | 1.0 | 1026 | $1,100 | $1.07 | 24d | 1 | 1.20mi |
| 16582 Santa Rosa Dr Detroit, MI | 3.0 | 1.0 | 1314 | $1,399 | $1.06 | 17d | 1 | 1.21mi |
| 15839 Kentucky St Detroit, MI | 2.0 | 1.0 | 800 | $1,200 | $1.50 | 17d | 1 | 1.23mi |
| 15878 Kentucky St Detroit, MI | 2.0 | 1.0 | 800 | $900 | $1.12 | 43d | 1 | 1.24mi |
Listing history 25 events
-
2026-06-18days on market $79,458 Active 185 DOM
-
2026-06-17days on market $79,458 Active 184 DOM
-
2026-06-15days on market $79,458 Active 182 DOM
-
2026-06-13days on market $79,458 Active 180 DOM
-
2026-06-13days on market $79,458 Active 179 DOM
-
2026-06-09days on market $79,458 Active 176 DOM
-
2026-06-08days on market $79,458 Active 175 DOM
-
2026-06-07days on market $79,458 Active 174 DOM
-
2026-06-04days on market $79,458 Active 171 DOM
-
2026-06-03days on market $79,458 Active 170 DOM
-
2026-06-01days on market $79,458 Active 168 DOM
-
2026-05-31days on market $79,458 Active 167 DOM
-
2026-04-02price $84,900 562-char remark
Show marketing remark (562 chars)
TENANT OCCUPIED BRICK BUNGALOW HOME LOCATED SOUTH OF FENKELL AND WEST OF LIVERNOIS. THIS HOME FEATURES A SPACIOUS LIVING ROOM, FORMAL DINING ROOM, KITCHEN, TWO GOOD SIZED BEDROOMS AND FULL BATHROOM ON THE MAIN FLOOR, SPRAWLING PRIMARY BEDROOM UPSTAIRS, AND AN UNFINISHED BASEMENT. TENANT RENT IS 1100 PER MONTH. PROPERTY IS SOLD AS-IS. ALL DIMENSIONS ARE ESTIMATED AND SHOULD BE VERIFIED. ALL SHOWINGS REQUIRE A LICENSED AGENT TO BE PRESENT. BUYER TO PAY DETROIT INVESTMENT CO A 295 PROCESSING FEE AT CLOSING. PHOTOS ARE FROM BEFORE THE TENANT MOVED IN, IN 2023.
-
2026-01-30price $88,900 562-char remark
Show marketing remark (562 chars)
TENANT OCCUPIED BRICK BUNGALOW HOME LOCATED SOUTH OF FENKELL AND WEST OF LIVERNOIS. THIS HOME FEATURES A SPACIOUS LIVING ROOM, FORMAL DINING ROOM, KITCHEN, TWO GOOD SIZED BEDROOMS AND FULL BATHROOM ON THE MAIN FLOOR, SPRAWLING PRIMARY BEDROOM UPSTAIRS, AND AN UNFINISHED BASEMENT. TENANT RENT IS 1100 PER MONTH. PROPERTY IS SOLD AS-IS. ALL DIMENSIONS ARE ESTIMATED AND SHOULD BE VERIFIED. ALL SHOWINGS REQUIRE A LICENSED AGENT TO BE PRESENT. BUYER TO PAY DETROIT INVESTMENT CO A 295 PROCESSING FEE AT CLOSING. PHOTOS ARE FROM BEFORE THE TENANT MOVED IN, IN 2023.
-
2026-01-29price $88,900 562-char remark
Show marketing remark (562 chars)
TENANT OCCUPIED BRICK BUNGALOW HOME LOCATED SOUTH OF FENKELL AND WEST OF LIVERNOIS. THIS HOME FEATURES A SPACIOUS LIVING ROOM, FORMAL DINING ROOM, KITCHEN, TWO GOOD SIZED BEDROOMS AND FULL BATHROOM ON THE MAIN FLOOR, SPRAWLING PRIMARY BEDROOM UPSTAIRS, AND AN UNFINISHED BASEMENT. TENANT RENT IS 1100 PER MONTH. PROPERTY IS SOLD AS-IS. ALL DIMENSIONS ARE ESTIMATED AND SHOULD BE VERIFIED. ALL SHOWINGS REQUIRE A LICENSED AGENT TO BE PRESENT. BUYER TO PAY DETROIT INVESTMENT CO A 295 PROCESSING FEE AT CLOSING. PHOTOS ARE FROM BEFORE THE TENANT MOVED IN, IN 2023.
-
2025-12-15$89,400 Active 562-char remark
Show marketing remark (562 chars)
TENANT OCCUPIED BRICK BUNGALOW HOME LOCATED SOUTH OF FENKELL AND WEST OF LIVERNOIS. THIS HOME FEATURES A SPACIOUS LIVING ROOM, FORMAL DINING ROOM, KITCHEN, TWO GOOD SIZED BEDROOMS AND FULL BATHROOM ON THE MAIN FLOOR, SPRAWLING PRIMARY BEDROOM UPSTAIRS, AND AN UNFINISHED BASEMENT. TENANT RENT IS 1100 PER MONTH. PROPERTY IS SOLD AS-IS. ALL DIMENSIONS ARE ESTIMATED AND SHOULD BE VERIFIED. ALL SHOWINGS REQUIRE A LICENSED AGENT TO BE PRESENT. BUYER TO PAY DETROIT INVESTMENT CO A 295 PROCESSING FEE AT CLOSING. PHOTOS ARE FROM BEFORE THE TENANT MOVED IN, IN 2023.
-
2023-08-23historical
-
2008-06-06historical
-
2008-03-06$9,900
-
2004-05-25soldstatus $33,500
-
2004-04-05soldstatus $33,500
-
2003-12-29$32,900
-
1999-07-12soldstatus $14,000
ⓘ Source: listings_history table (triggers on properties + properties_extension) + one-shot
backfill from property_details.listing_events for pre-trigger history.
Tax reassessment forecast MI · Partial reset (capped growth)
- Current annual tax
- $1,441 · $120/mo
- Projected year-2 tax
- $1,441 · $120/mo
- Expected delta
- $0/yr ($0/mo · 0.0%)
ⓘ Screening estimate from a state-policy table — verify with the county assessor before closing.
Climate risk First Street
- Flood 3/10 Moderate FEMA zone X (unshaded) · 20% chance over 30 yrs
- Wildfire 1/10 Low
- Heat 3/10 Moderate 7 d/yr ≥97°F today · 15 d/yr by 30 yrs out
- Wind 2/10 Low
- Air quality 4/10 Moderate 4 unhealthy d/yr today · 6 by 30 yrs out
Nearby sold comps map
Loading sold comps map…
Walkable amenities ~0.75 mi
Loading nearby amenities…
Taxation est. · year 1
- Rental income
- $14,687
- − Mortgage interest
- −$4,451
- − Property taxes
- −$1,441
- − Insurance
- −$397
- − Repairs & maintenance
- −$1,175
- − Management
- −$1,175
- − Depreciation
- −$2,312
- Taxable income
- $3,737
- Est. tax owed @ 24.0%
- −$897
- After-tax cash flow
- $3,868/yr
For passive investors: Depreciation is non-cash, so a rental often shows a tax loss while cash-flowing — sheltering income. Rental losses are passive: they offset passive income freely, and up to $25,000/yr can offset ordinary (W-2) income if you actively participate and your MAGI is under $100k (phasing out to $0 by $150k); unused losses carry forward. On sale, claimed depreciation is recaptured at up to 25%, and gains may owe capital-gains tax (a 1031 exchange can defer both). Figures are a year-1 estimate at your 24.0% rate — not tax advice; consult a CPA.
Schools (NCES district)
- District
- Detroit Public Schools Community District
- NCES district ID
- 2601103
- Math proficiency
- 10% ▼ -2.00%
- Reading proficiency
- 24% ▲ 6.00%
- Median HH income
- $25,815
- Composite
- 13.06/100
- National rank
- #9564
- State rank
- #499 of 540 in MI
Livability — Detroit
- Score
- 73/100
- State rank
- #218
- US rank
- #5427
Category grades
Schools grade is shown separately in the Schools card above.
Census & demographics
- Census place
- Detroit, MI
- County
- Wayne County · 1,562,939 people
- City population
- 572,865
- Metro
- Detroit-Warren-Dearborn, MI
- Population (ZIP)
- 24,731
- Household income
- $33,315
- Rent vs Own
- Severe rent burden
- 2172.0
Population outlook (Wayne County) Hauer SSP2
- Today (2025)
- 1,675,273 people
- By 2030
- 1,620,300 · -3.3%
- By 2040
- 1,502,341 · -10.3%
- By 2050
- 1,384,039 · -17.4%
- By 2075
- 1,124,592 · -32.9%
- By 2100
- 881,193 · -47.4%
Race, ethnicity, and origin ACS 2023
- Neighborhood character
- Predominantly Black (94%)
- Race & ethnicity
- Black 94% Two or more races 3% White 1%
- Foreign-born
- 1%
Political lean MEDSL · Wayne
- 2024 margin
- Strong D (+29.0) · D 62.7% · R 33.7% · Other 3.6%
- 2008→2024 swing
- -20.5pp toward R · 2008: 49.5pp · 2024: 29.0pp
- All cycles
- 2024: D+29.0 2020: D+38.1 2016: D+37.3 2012: D+46.9 2008: D+49.5
Not yet ingested
- Civics
- —
Market trends
- HPI YoY
- ▼ -31.96%
- Current HPI
- 189.6227
- Rent YoY
- ▲ 6.14%
- Metro
- Detroit-Warren-Dearborn, MI
- State GDP YoY
- ▲ 1.37%
- F500 in state
- 28
Industry mix (Fortune 500 HQ in MI)
| Industry | F500 HQs | Revenue |
|---|---|---|
| Automotive Parts | 3 | $48B |
|
||
| Automotive | 2 | $372B |
|
||
| Chemicals | 1 | $45B |
|
||
| Automotive Retail | 1 | $29B |
|
||
| Healthcare / Medical Devices | 1 | $23B |
|
||
| Automotive Technology | 1 | $20B |
|
||
Price history
+506.4% since first listed13 events — show timeline
- 2026-04-02 Price Changed $84,900 MiRealSource-MiMLS
- 2026-04-02 Price Changed $84,900 REALCOMP
- 2026-01-30 Price Changed $88,900 MiRealSource-MiMLS
- 2026-01-29 Price Changed $88,900 REALCOMP
- 2025-12-15 Listed $89,400 REALCOMP
- 2025-12-15 Listed $89,400 MiRealSource-MiMLS
- 2023-08-23 Rental Removed — REALCOMP
- 2008-06-06 Listing Removed — REALCOMP
- 2008-03-06 Listed $9,900 REALCOMP
- 2004-05-25 Sold (Public Records) $33,500 Public Records
- 2004-04-05 Sold (MLS) $33,500 REALCOMP
- 2003-12-29 Listed $32,900 REALCOMP
- 1999-07-12 Sold (Public Records) $14,000 Public Records
Property tax history
+6.2%/yrLatest (2025): $1,441 · -54.1% YoY. Source: county tax records.
Cash-flow waterfall
monthlySold comps — $/sqft
last 12 mo · ≤1 miLoading sold comps…